Subscriptions report - Cloud product performance
Appropriate roles: Global admin | Admin agent | Report viewer | Executive report viewer
The Product Subscriptions report presents analytics on cloud subscriptions that you've sold or that you manage for your customers. This is a product-specific report that includes performance of subscriptions associated with cloud products such as Office 365, Azure, Dynamics, and others.
You can view the following sections from the Product Subscriptions report.
- Summary
- Geographical spread of subscriptions
- Subscriptions add/churn trend
- Subscription distribution by partner locations, sales channel, SKUs, partner attach type, segment
- Trend by subscription states
- Products trend
Note
This report is available from the Insights dashboard. To view this report, you must be assigned a specific role in Partner Center, such as Global admin, Account admin, Report viewer, or Executive report viewer. For more information, see your company's Global admin. Specific types of data in this report might also be available only to users with Executive report viewer privileges.
Summary
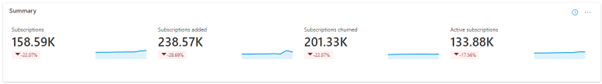
The summary section presents a snapshot view of the key performance indicators (KPIs) related to subscriptions sold or managed by you for your customers.
For more information about each section of the summary, see below:
Subscriptions:
- Current count of the cloud product subscriptions sold or managed by you.
- Percentage growth or decline of subscriptions during your selected date range.
- The Micro chart presents a month-over-month trend of subscriptions count during your selected date range.
Active subscriptions:
- Current count of cloud product subscriptions with Active usage measured based on product telemetry. This excludes all trial subscriptions for Azure subscriptions.
- Percentage growth or decline of active subscriptions over the selected time period.
- The Micro chart presents a month-over-month trend of active subscriptions during your selected date range.
Subscriptions added:
- Total customer subscriptions added (sold or managed) by you during the selected date range. New subscriptions with Active or Renewed state are counted as Subscriptions added.
- Percentage growth or decline of subscriptions added in the last full month compared to the first full month.
- The Micro chart presents a monthly trend of subscriptions added during your selected date range.
Subscriptions churned:
- Total customer subscriptions churned during your selected date range. Subscriptions with state Deprovisioned or Suspended in that month are counted as a churned subscription.
- Percentage of subscriptions churned during the selected date range.
- The Micro chart presents a monthly trend of subscriptions churned over the selected date range.
Subscriptions by products: Breakdown of the current subscription count by cloud products.
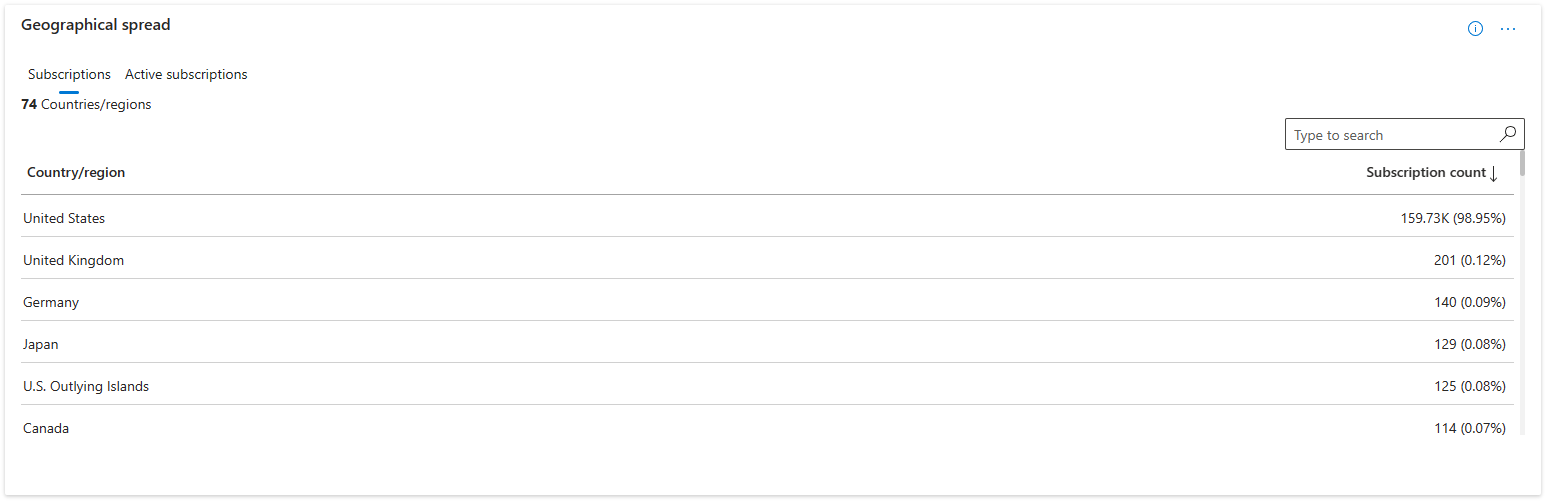
Geographical spread of subscriptions
The table presents the countries/regions where you have subscriptions and the count per country/region of total and active subscriptions. Both fields in the table are sortable.
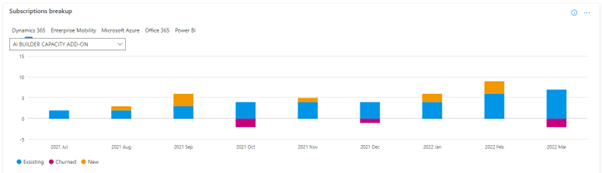
Subscription adds/churns
This view presents a trend of subscriptions. These are broken down into different categories (New, Existing, Churned) for the selected date range. The X-axis represents months of the selected date range. The Y-axis represents subscription count. Churned subscriptions are represented on the negative scale of the Y-axis.
The stacked column chart presents a breakdown of new, existing, and churned subscriptions for the month. You can rebuild the column chart, broken down with specific stack items. To do so, select those specific items in the legend. You can also use the slider on top of the chart to zoom into a specific period.
Subscription distribution
This view presents a breakdown of your current subscriptions by your Microsoft AI Cloud Partner Program locations, customer segments, sales channel/Azure pricing model, and the attribution type. Select the respective tabs to view the breakdown by these categories. The leader board shows a breakdown of specific item categories, select those item categories in the legend.
Subscription state distribution
The segment shows distribution of your current customer subscriptions by subscription state or status. This includes the following subscription states: Active, Disabled, Deprovisioned, Open, InGracePeriod, Closed, and Others.
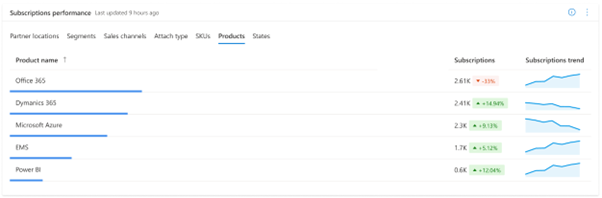
Products trend
The leader board presents a monthly trend of subscriptions broken down by commercial products, such as Azure, Office, and Dynamics. Along with every product family the count of Subscriptions and Subscriptions trend is shown.

Note
The subscription count broken down by SKUs might not always match the total subscription count for that product. This might occur if a customer has purchased multiple SKUs under the same product subscription.
Next steps
- For more reports, see Partner Center Insights.
Note
You can download the raw data powering this report from the Download Reports section in the Insights dashboard.
Feedback
Coming soon: Throughout 2024 we will be phasing out GitHub Issues as the feedback mechanism for content and replacing it with a new feedback system. For more information see: https://aka.ms/ContentUserFeedback.
Submit and view feedback for