Events
Power BI DataViz World Championships
Feb 14, 4 PM - Mar 31, 4 PM
With 4 chances to enter, you could win a conference package and make it to the LIVE Grand Finale in Las Vegas
Learn moreThis browser is no longer supported.
Upgrade to Microsoft Edge to take advantage of the latest features, security updates, and technical support.
In this article you learn how to create a system chart. System charts are organization-owned charts, which makes them available to anyone with access to read the data running the app. System charts can't be assigned or shared with specific app users.
Note
Model-driven apps not configured to display All charts for a table need newly created charts selected for the table within the app designer. More information: Add table assets
Sign in to Power Apps.
On the left navigation pane, select the Tables. If the item isn’t in the side panel pane, select …More and then select the item you want.
Open the table that requires a chart, and then select Charts.
Select New chart.
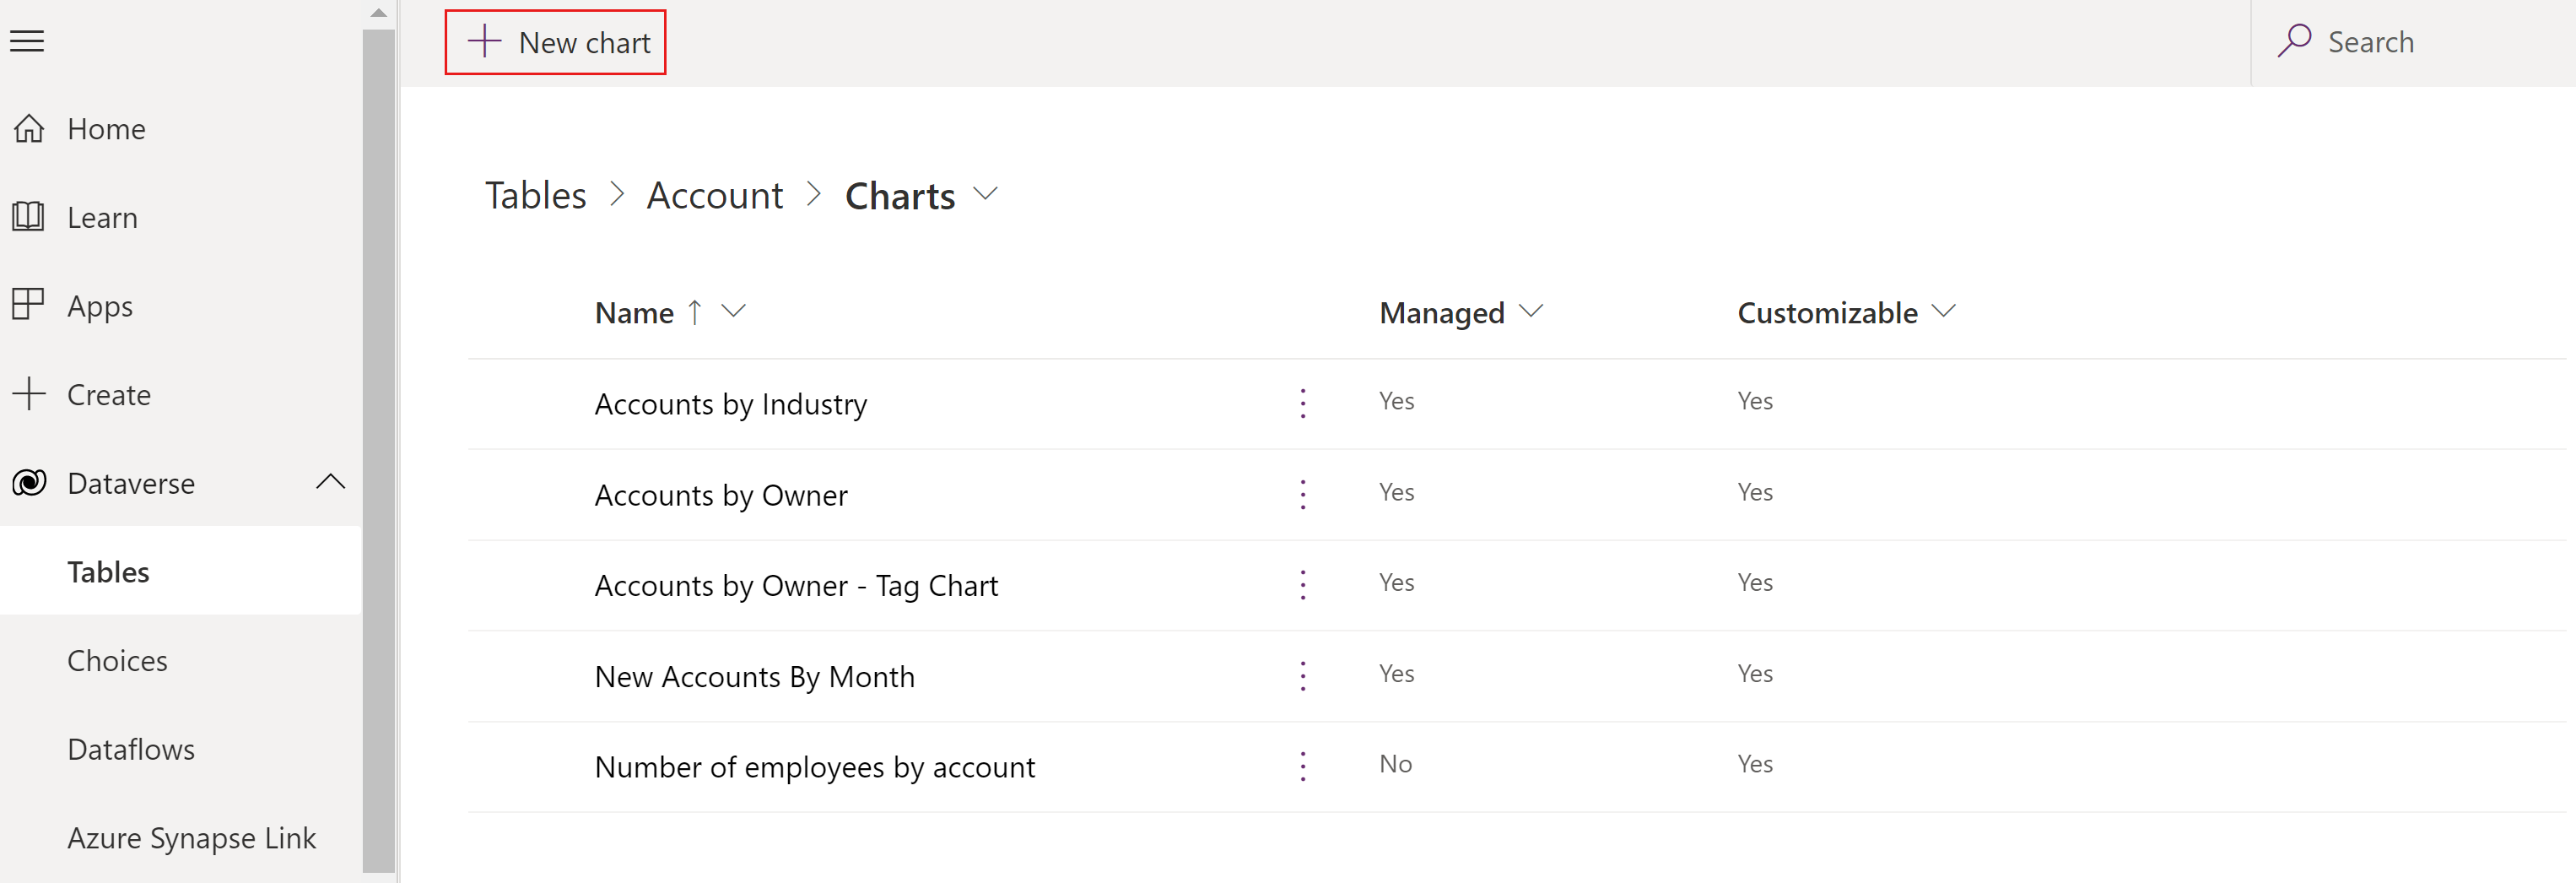
A new window opens where you can create a chart.
Specify the type of chart, and how the data is displayed in the chart.
Enter the chart name, such as Number of employees by account.
In the Select Column dropdowns:
Add a description to identify the purpose of the chart, such as This column chart displays the number of employees by account name.
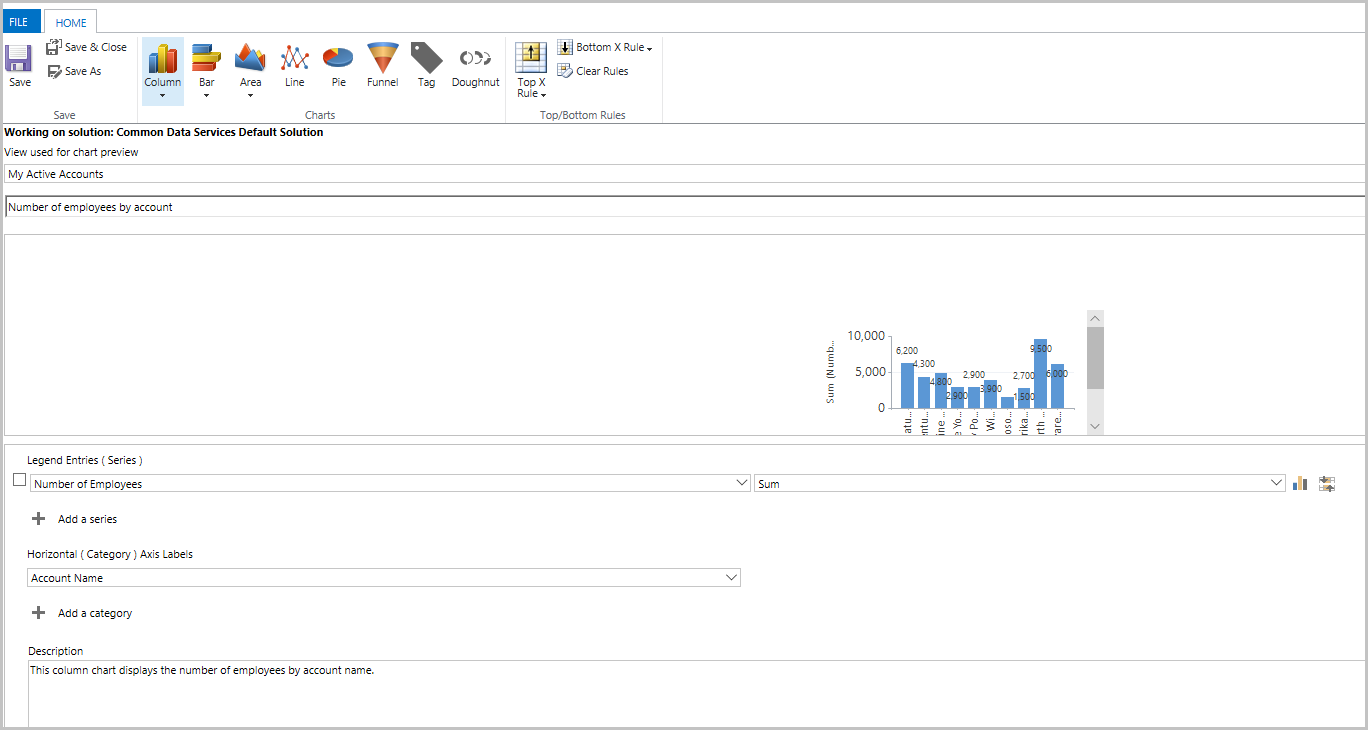
Select Save and Close.
The Number of employees by account chart is now displayed in the app designer list of charts available for the account table.
Note
When creating a chart, you can preview it with a selected view. The view isn't permanently associated with the chart. The next time you open the chart, the chart displays using the configured default view. You can change the view to display the chart for the data from a different view.
Now that the chart is created, it can be used to visualize table data in the model-driven app. Follow these steps to view the chart:
Open a model-driven app that contains your table via a solution or open the app directly from the Apps area.
Select ... next to the app, and then select Play. The model-driven app opens in a separate browser tab.
On the left navigation pane, select a table such as Accounts.
On the command bar, select Show Chart.
The chart pane opens.
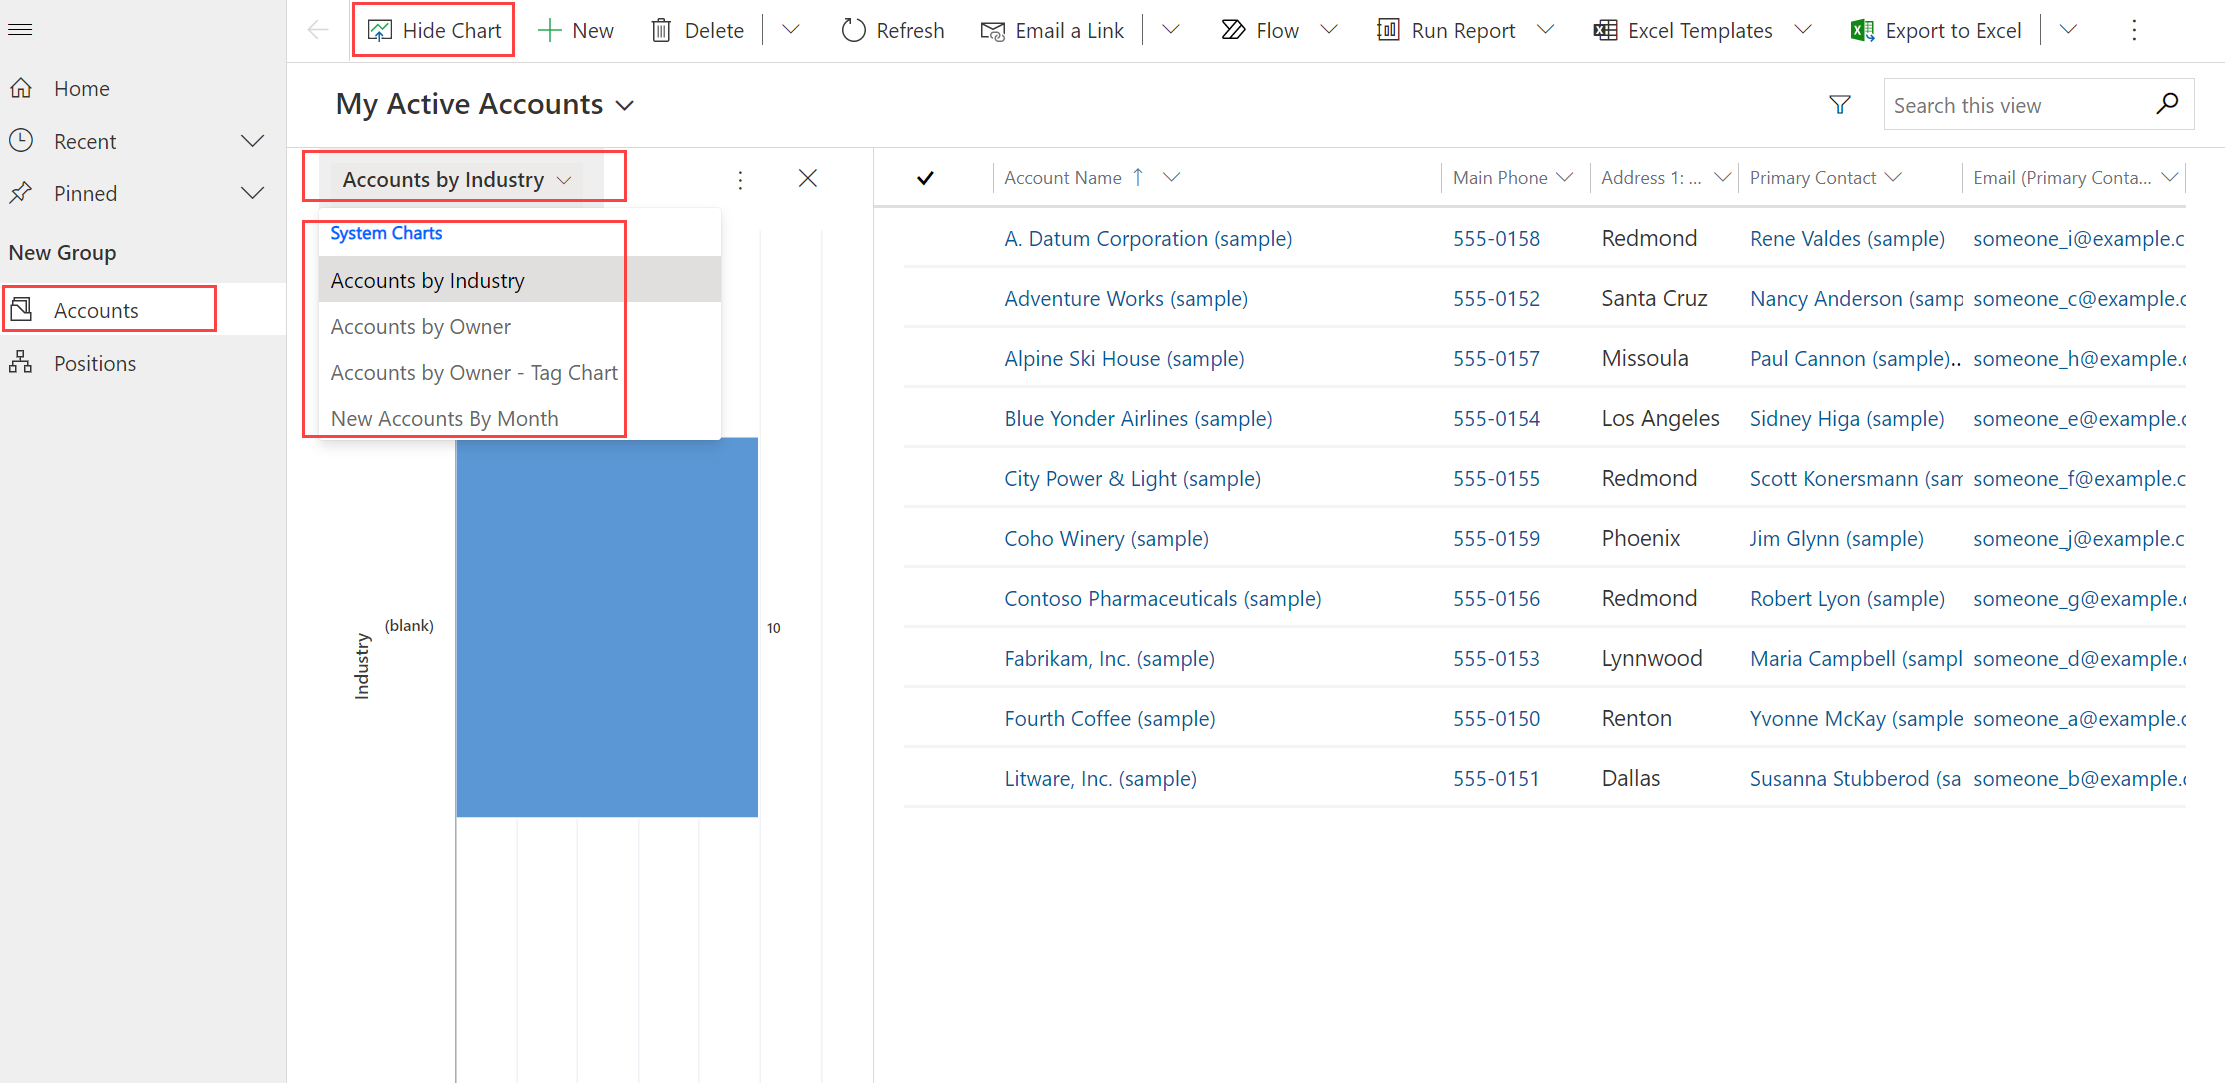
By selecting the dropdown chart list, any of the system charts in the app are available to select.
The chart appears in-line with the data view.
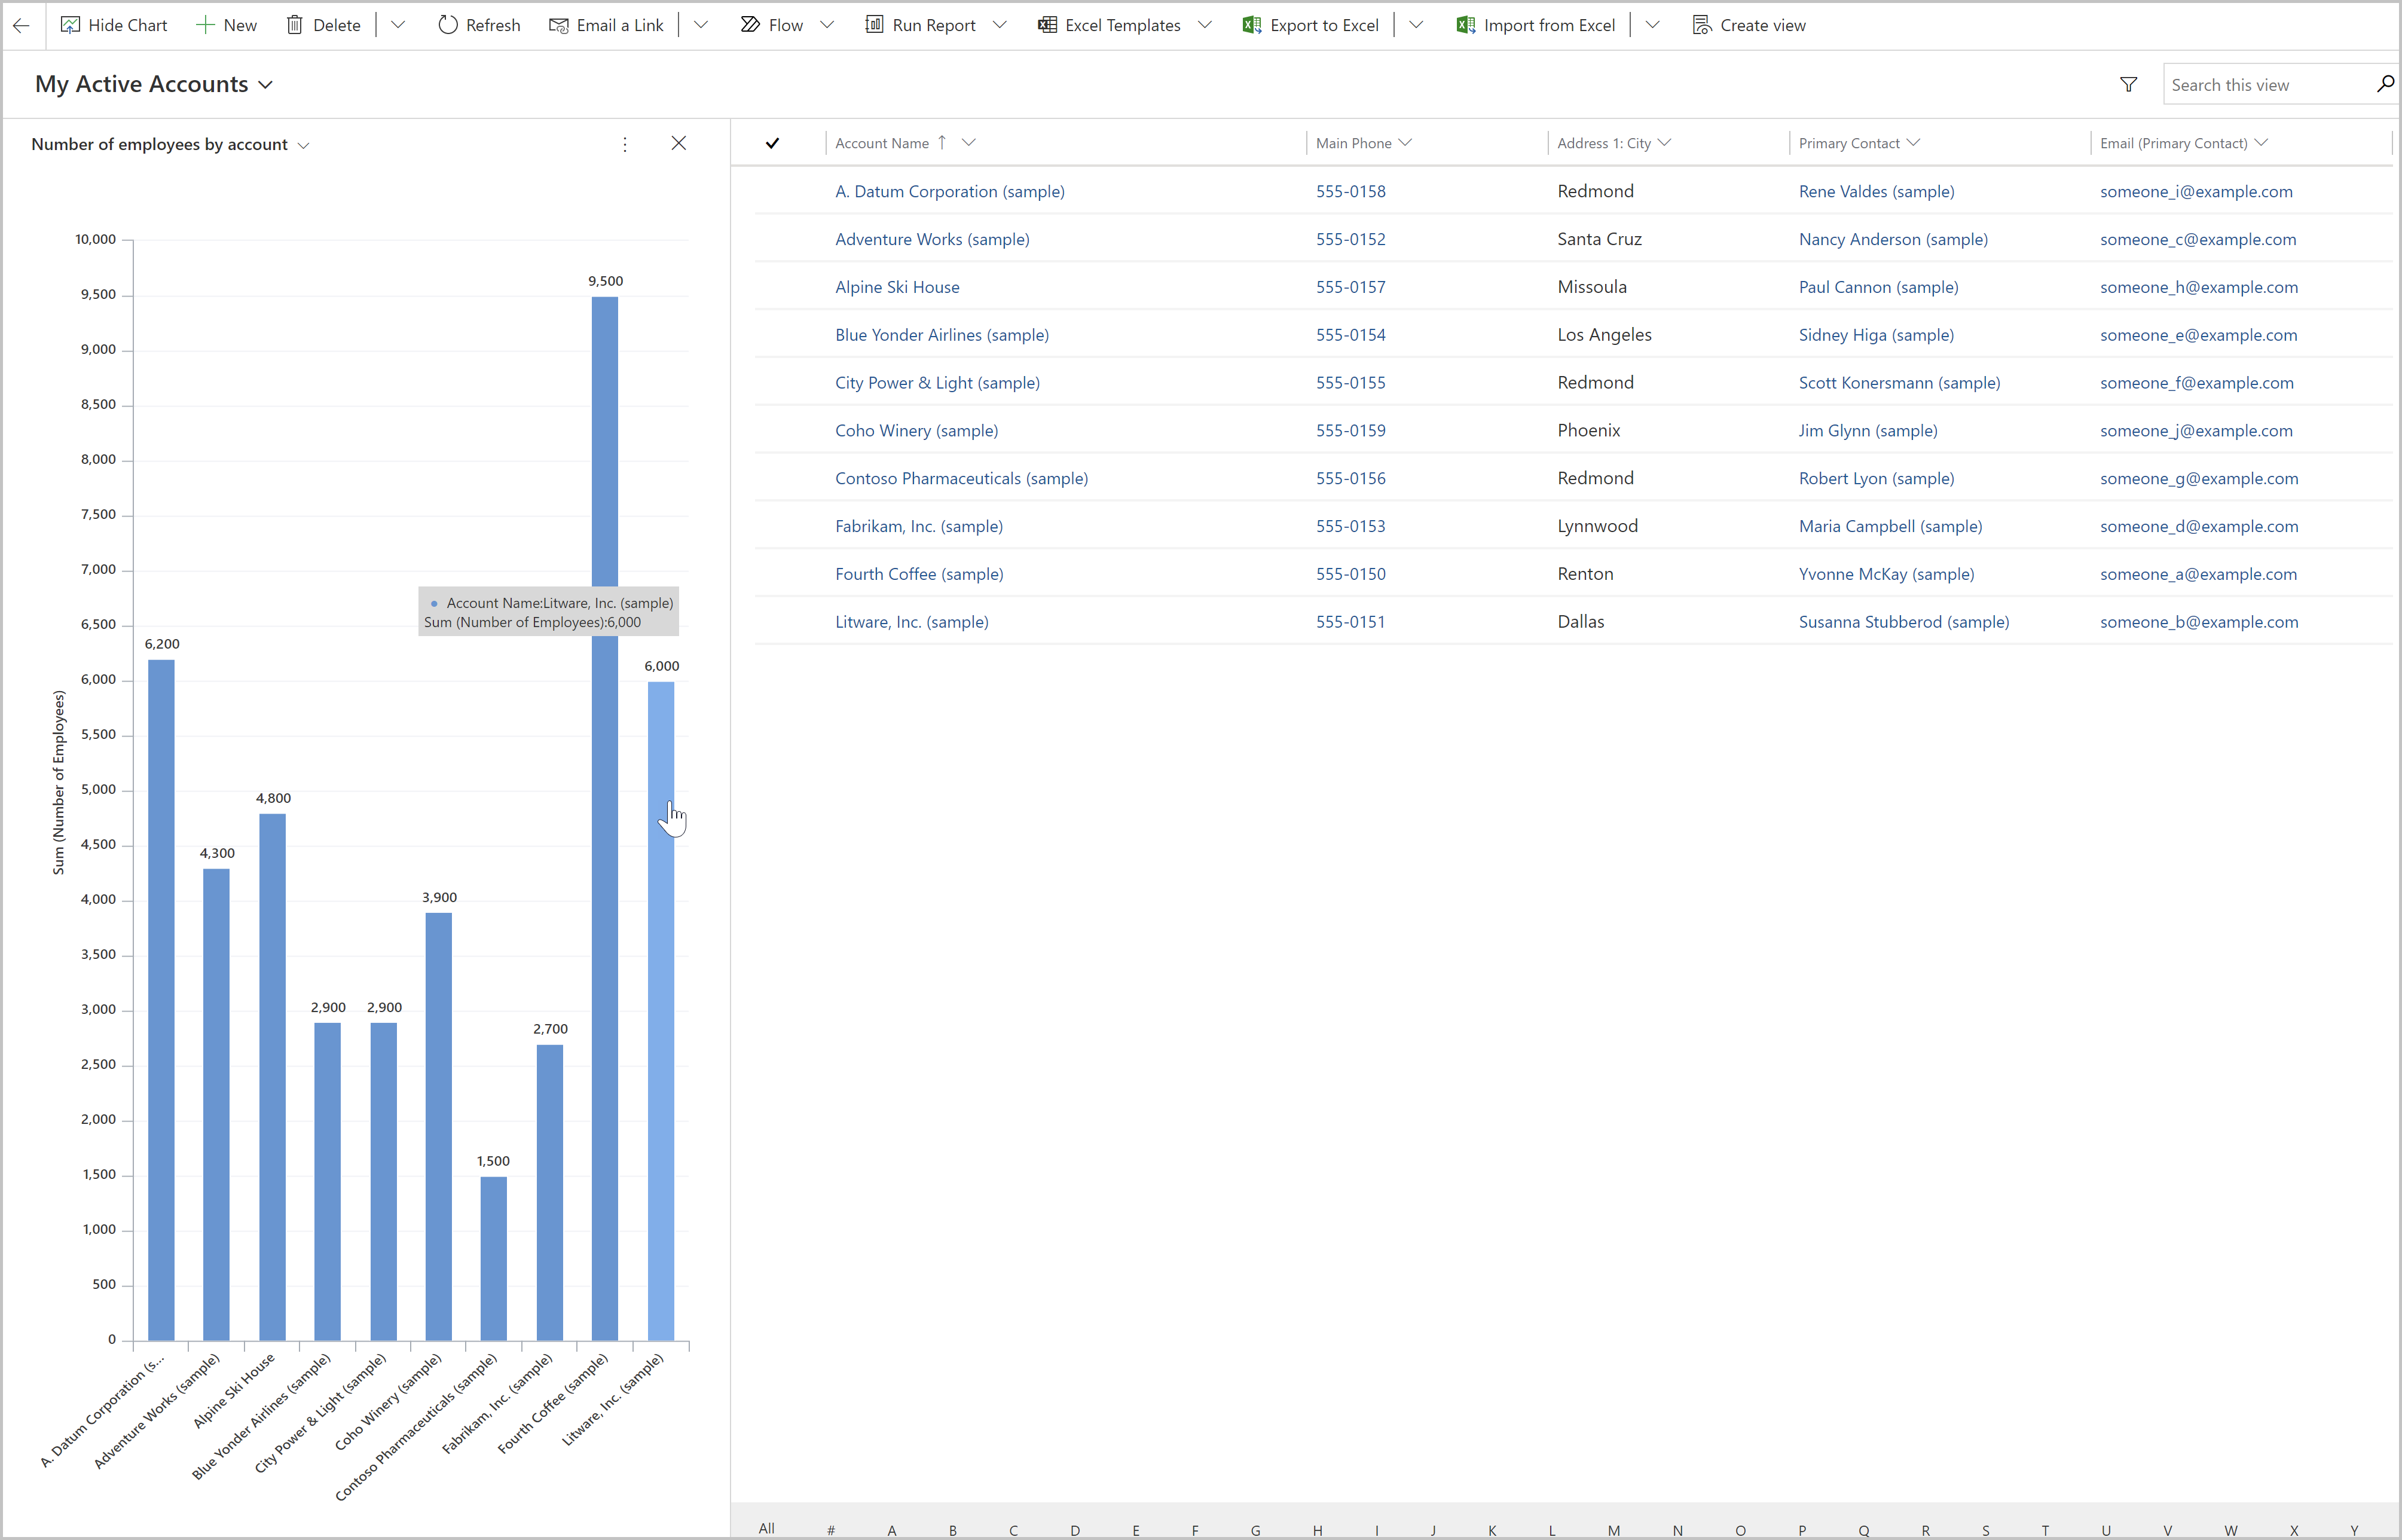
Use your chart:
Note
If the chart isn't visible in the dropdown chart list, then the model-driven app has been created with specific charts associated with it. To resolve this, open the model-driven app in design mode, select charts, and then select your newly created chart.
 Then save and publish your app.
Charts display views that return up to 50,000 records. Views that exceed 50,000 records display the message: The maximum record limit is exceeded. Reduce the number of records. More information: Reporting infrastructure
In the chart designer, adding an order by on certain calculated columns isn't supported and cause an error. The calculated columns causing the issue are using another calculated column, a related table column, or a local column on the table.
Events
Power BI DataViz World Championships
Feb 14, 4 PM - Mar 31, 4 PM
With 4 chances to enter, you could win a conference package and make it to the LIVE Grand Finale in Las Vegas
Learn moreTraining
Learning path
Create a model-driven application in Power Apps - Training
This learning path introduces you to creating a model-driven app in Power Apps that uses Microsoft Dataverse.
Certification
Microsoft Certified: Power Platform Developer Associate - Certifications
Demonstrate how to simplify, automate, and transform business tasks and processes using Microsoft Power Platform Developer.