Debug a model-driven app with Monitor
Monitor can help you debug and diagnose problems and help you build faster, more reliable apps. Monitor provides a deep view into how an app runs by providing a log of all key activities in your app as the app runs. You can also collaboratively debug a published model-driven app with a support engineer or debug issues of another user's session. For more information on how to collaboratively debug a published model-driven app, go to Collaborative troubleshooting using Monitor.
Important
Monitor for model-driven app requires the client version of your model-driven app to be 1.4.5973-2307.2 or later.
For more information about when you should monitor an app, see Monitor overview. To run Monitor with a canvas app, see Debugging canvas apps with Monitor.
Use Monitor to diagnose a model-driven app
Sign into Power Apps, and then select Apps from the left navigation pane.
Select the model-driven app that you want to monitor, and then select Monitor on the command bar.
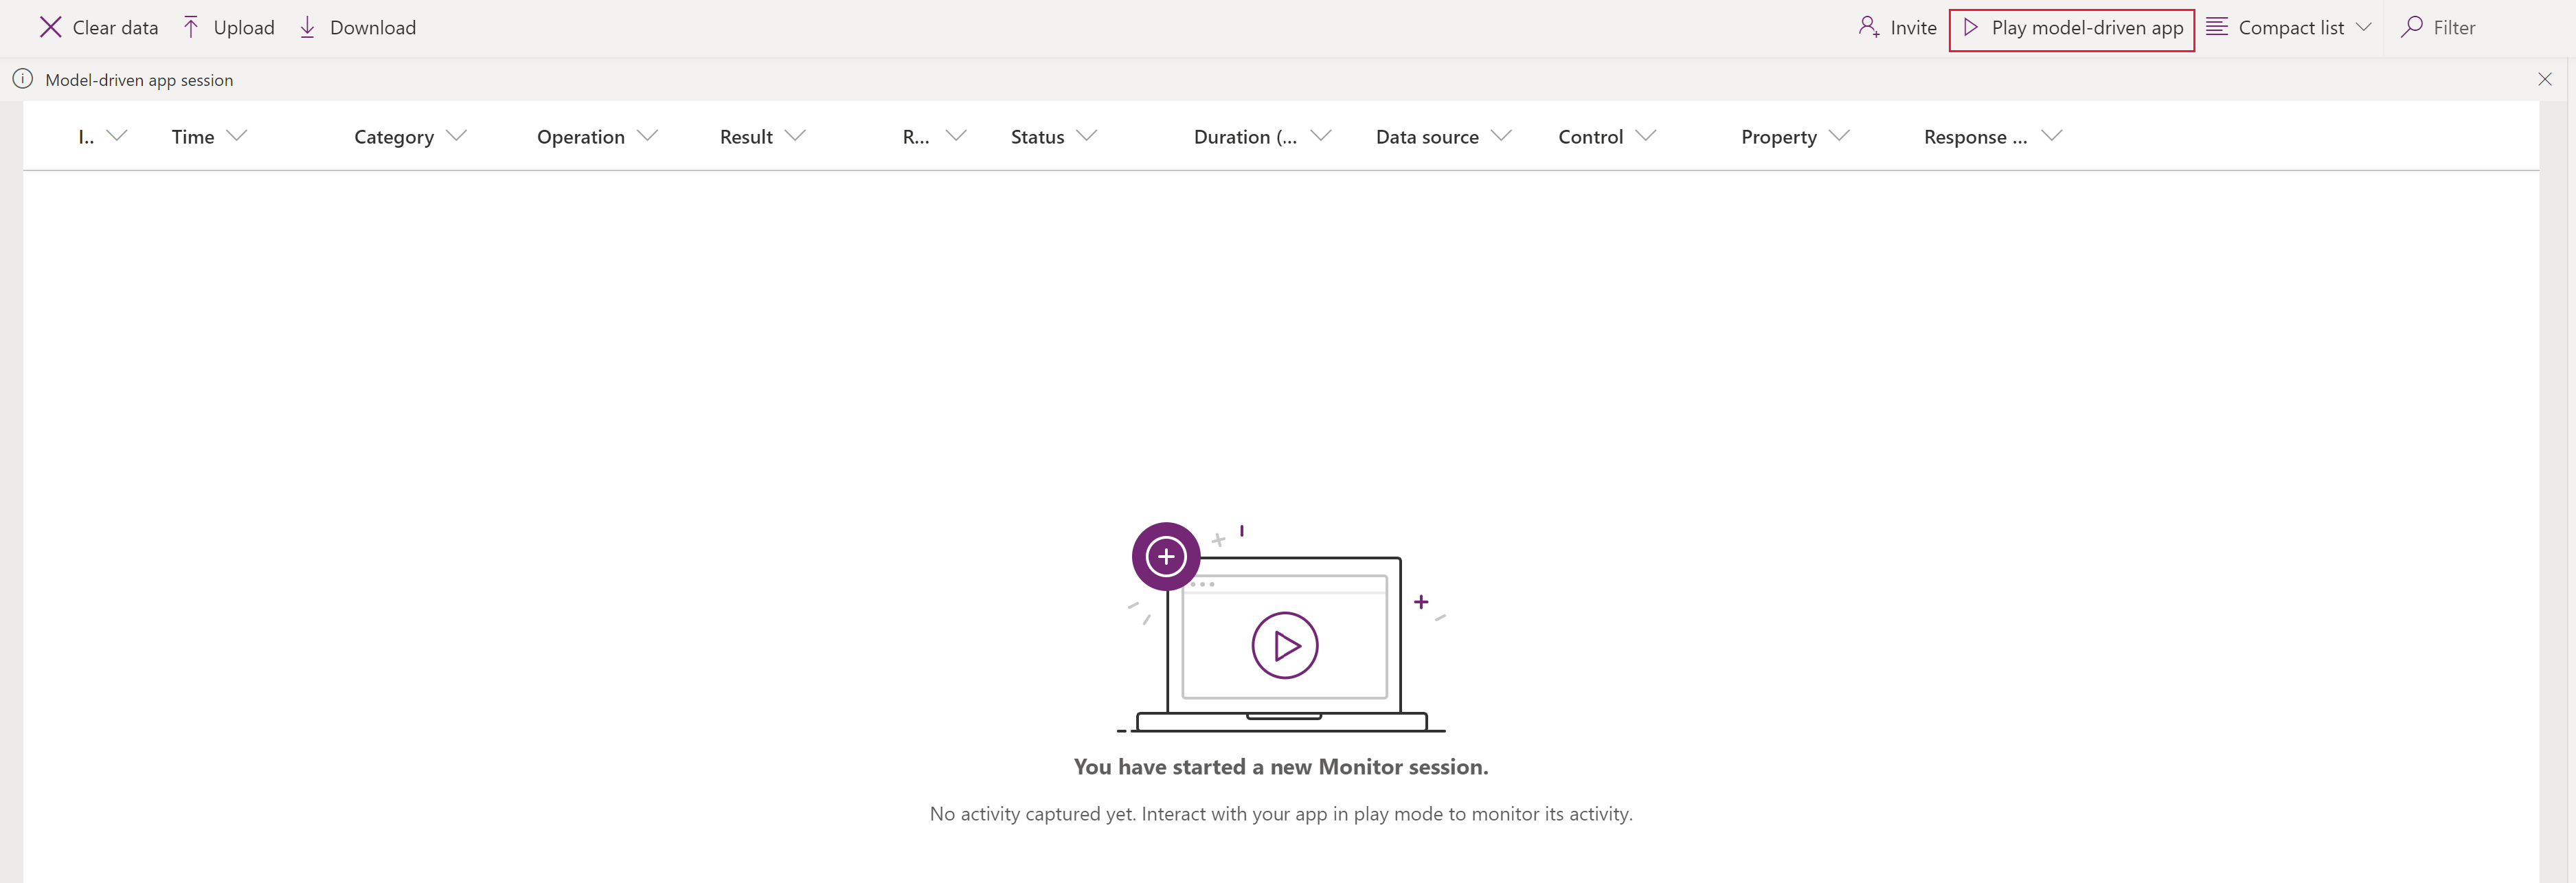
In the web page that opens, select Play model-driven app to open your app.
Note
Alternatively, you can run a model-driven app and add “&monitor=true” to the end of the URL in the browser. Then, select Monitor on the command bar to start a monitoring session in a new tab.
After the app is opened from Monitor, you’ll see a Join monitor debug session? dialog box. This lets you know that any data from the app will be sent to the Monitor owner. Select Join. Events begin to flow to the Monitor session screen as they occur in the app.
Select an event to display additional information in the right pane.
Events monitored
Page navigation, command executions, form saves, and other major actions will send key performance indicators and network events to Monitor.
FullLoad
FullLoad signifies the complete load of a page navigation, such as an edit form load. This event waits for certain network requests to complete and all rendering to finish, so the form can be ready before FullLoad completes.
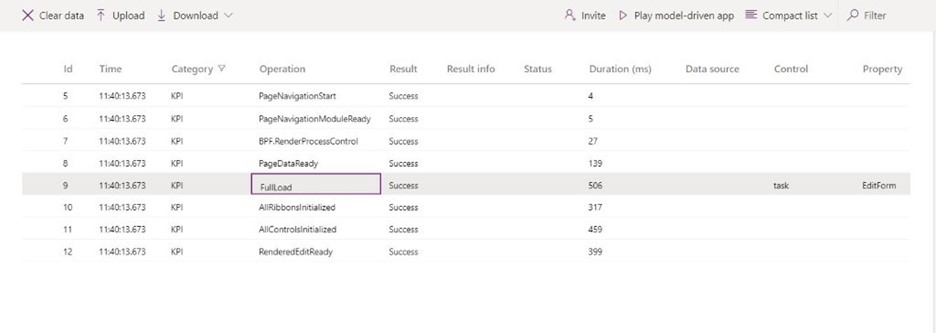
Select a FullLoad event to display the Details tab.
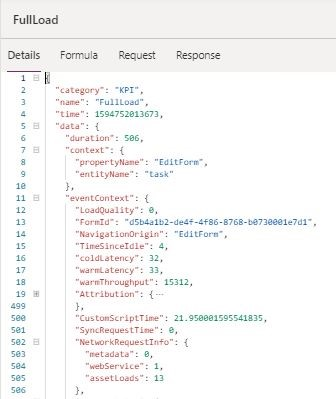
The FullLoad event captures many statistics about the page load. You can see the task edit form loaded in 506 ms, and selecting the row reveals information in the property pane. You can see details on customScriptTime (time spent execute custom JavaScript), loadType (0 = first-time loading page type, 1 = first time loading entity, 2 = first-time loading record, 3 = exact record has been visited), and FormId (form identifier for further diagnosis). Expanding Attribution gives a breakdown of custom JS execution time by type, publisher, solution, version, web resource, and method. This can help identify bottlenecks in form load time.
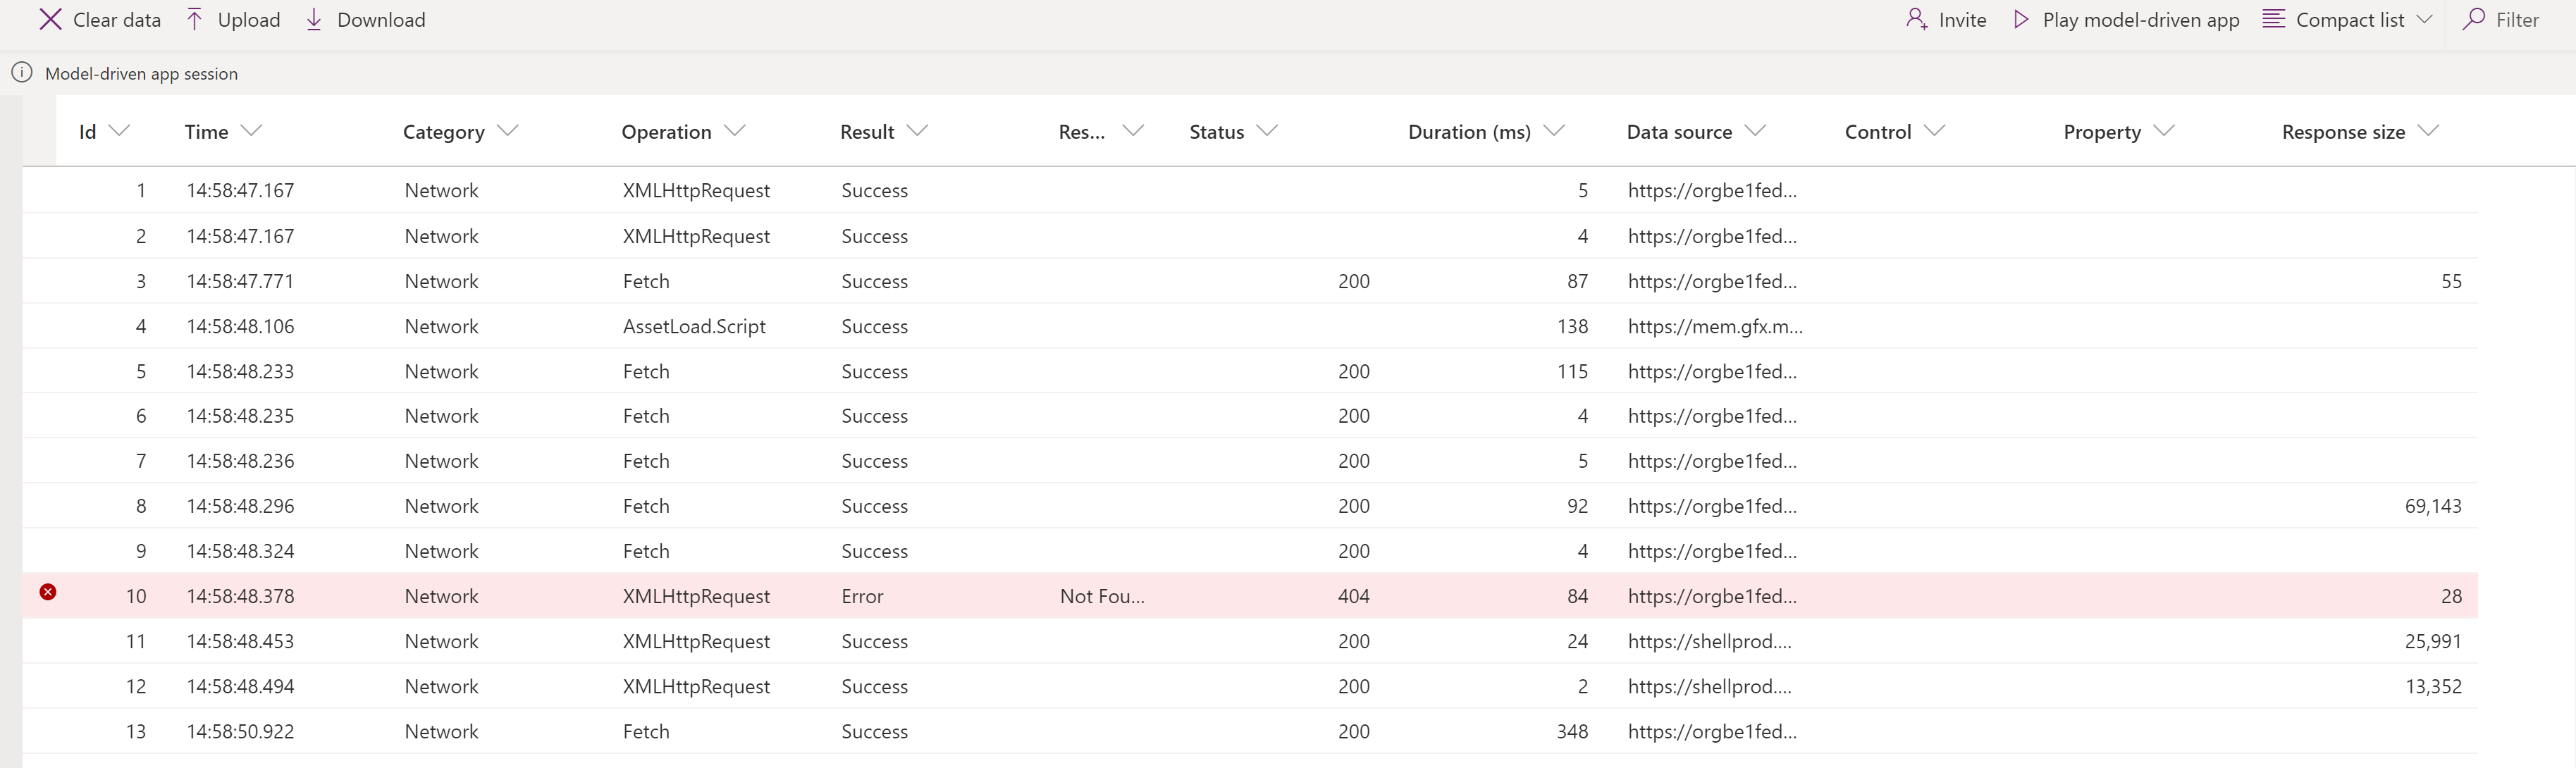
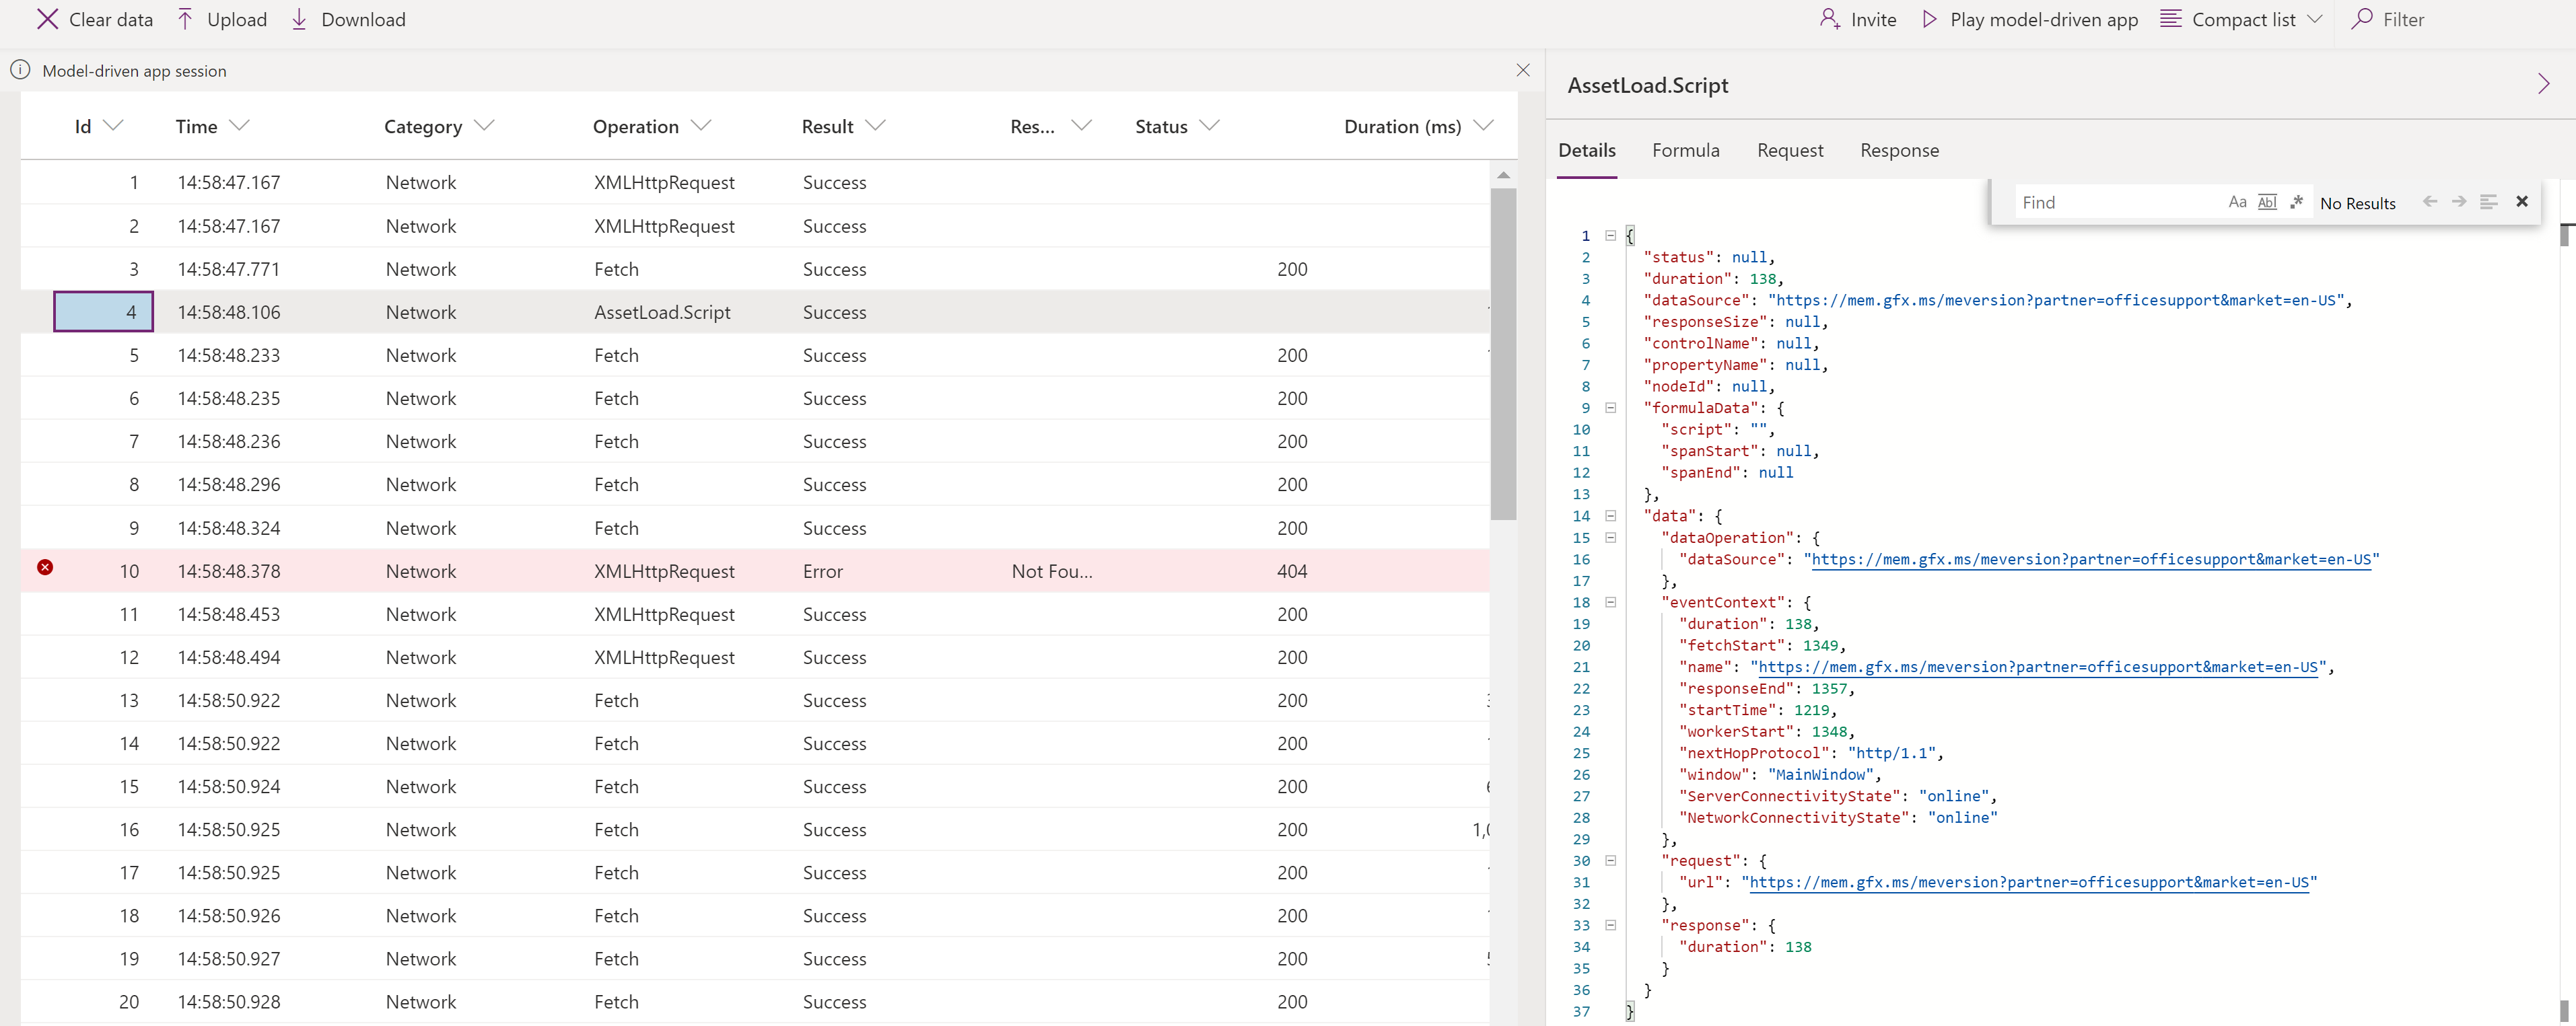
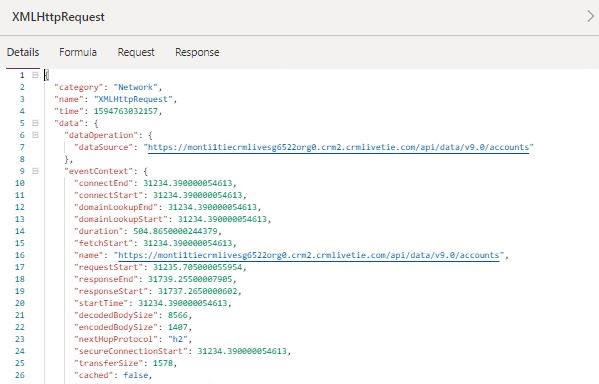
Network
The Network events reveal details about each request made from the app.
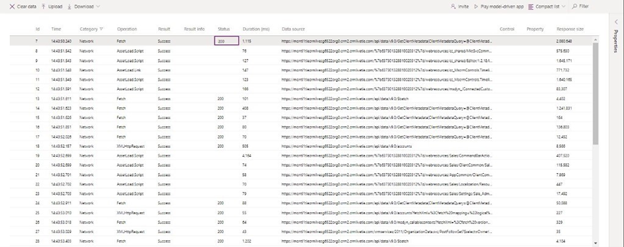
Select a Network event to display the Details tab.
Earlier you learned about Monitor and how to use it to model-driven apps. Let’s look at a few scenarios where Monitor can assist you in solving script errors, unexpected behavior, and slowdowns.
Custom script errors
Sometimes, a bug in the custom JS causes a script error or functionality problem when loading a page. While this usually produces a call stack in the dialog, it’s hard to always know where it’s coming from or decode the error. Monitor receives events from the app with more details about the errors, so you can debug more quickly, and easily.
For example, imagine a user is experiencing a script error dialog on account form load. You can use Monitor to get more details on the event. Once the scenario is reproduced, you can see the script error produces an error event highlighted in red. Selecting this row gives you not only the call stack but the publisher name, solution name/version, web resource name, and type (such as onload, onchange, RuleEvaluation, and CustomControl). In this example, it looks like a typo in the script.

Slow performance
Browser developer tools can help profile slow page loads, but there's much data to filter though and it’s not clear what is important to look at. Monitor solves this problem by showing relevant events that contribute to page load performance.
For example, imagine a user is experiencing slow account form loads, and the browser is constantly freezing up. In this case, after you reproduce the issue, you can see a performance warning telling you that a synchronous XMLHttpRequest was sent during the load which degraded performance.

See previous blog post for how to alleviate synchronous XMLHttpRequest (XHR) performance problems.
For every page load, the data platform sends all KPI for the loading sequence as well as network request details as mentioned earlier.
See also
Feedback
Coming soon: Throughout 2024 we will be phasing out GitHub Issues as the feedback mechanism for content and replacing it with a new feedback system. For more information see: https://aka.ms/ContentUserFeedback.
Submit and view feedback for