Events
Power BI DataViz World Championships
Feb 14, 4 PM - Mar 31, 4 PM
With 4 chances to enter, you could win a conference package and make it to the LIVE Grand Finale in Las Vegas
Learn moreThis browser is no longer supported.
Upgrade to Microsoft Edge to take advantage of the latest features, security updates, and technical support.
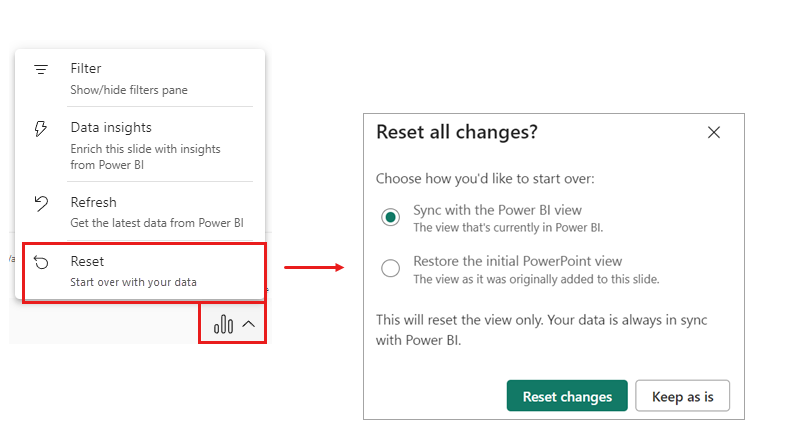
When you embed a Power BI report in your PowerPoint presentation, you want to know that it will remain stable and unaltered. For this reason, the Power BI add-in refreshes data from the Power BI service without modifying the view of the report itself. However, since reports in the Power BI service are dynamic and subject to change (such as the addition of new visuals, additional filters, etc.), you might sometimes want to pull the latest changes into your presentation. To do this, you used to have to remove the report from the presentation and then re-embed it. Now, the enhanced Reset command makes this easy. The command has two options:
Add-ins that were saved as Public snapshot can be printed, and don't require you to go over all the slides to load the add-ins for a permissions check before the public image is made visible.
For add-ins that were saved as Public snapshot, you might be able to improve loading times by using the Show as saved image option on the add-in side menu. This replaces the entire add-in with an image representation of it. This can be useful when you are presenting your presentation and need the fastest loading times possible.
When a presentation is open for a long time, the Power BI data shown in the add-in can become outdated. To make sure the data you have in your slides is up to date, a new notification tells you when more up-to-date data exists in Power BI, and gives you an option to refresh the data with the latest data from Power BI.
When you add the Power BI add-in to an empty slide that doesn't have a title yet, the Power BI add-in offers you suggestions for the slide title based on the content of the add-in. The title can be the report name, the page or visual name, or both. Just choose the desired option and select Add title.

PowerPoint allows you to continuously play back a presentation. This is especially useful when you want to present information in public displays without any human interaction.
Until now, if the presentation you wanted to run continuously as a slide show had slides with the Power BI add-in, there was the possibility that the data in the add-in would become outdated, since the add-in only got the data from Power BI when the slide loaded or when you manually refreshed the data being presented.
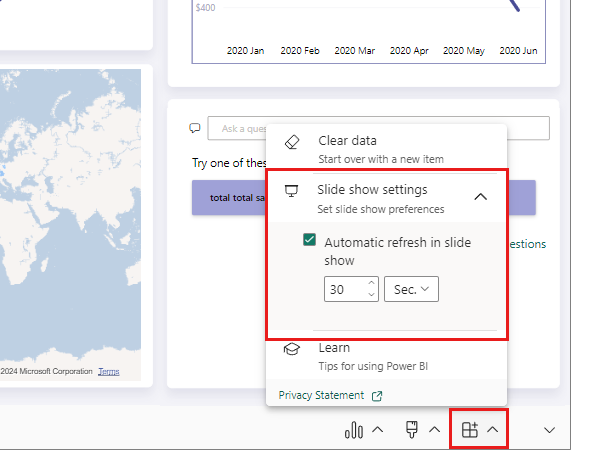
With this new automatic refresh in slide show feature, you can now set the add-in to automatically pull fresh data from Power BI while the presentation is in slide show mode, ensuring that your presentation always shows the most recent data.
To set up automatic refresh for your slide show, go to the add-in footer, select Add-in options, choose Slide show settings, check Automatic refresh in slide show and set the desired refresh frequency.
Note
This feature requires that your Office version meet the add-in's minimum Office version requirement. Auto refresh only happens in slide show mode, and not while you're editing the presentation.
The "save as static image" functionality that enables you to turn your live view of Power BI data into a static image has been improved and expanded!
A new dropdown menu in the add-in footer makes it easy to switch between live data and a static image.
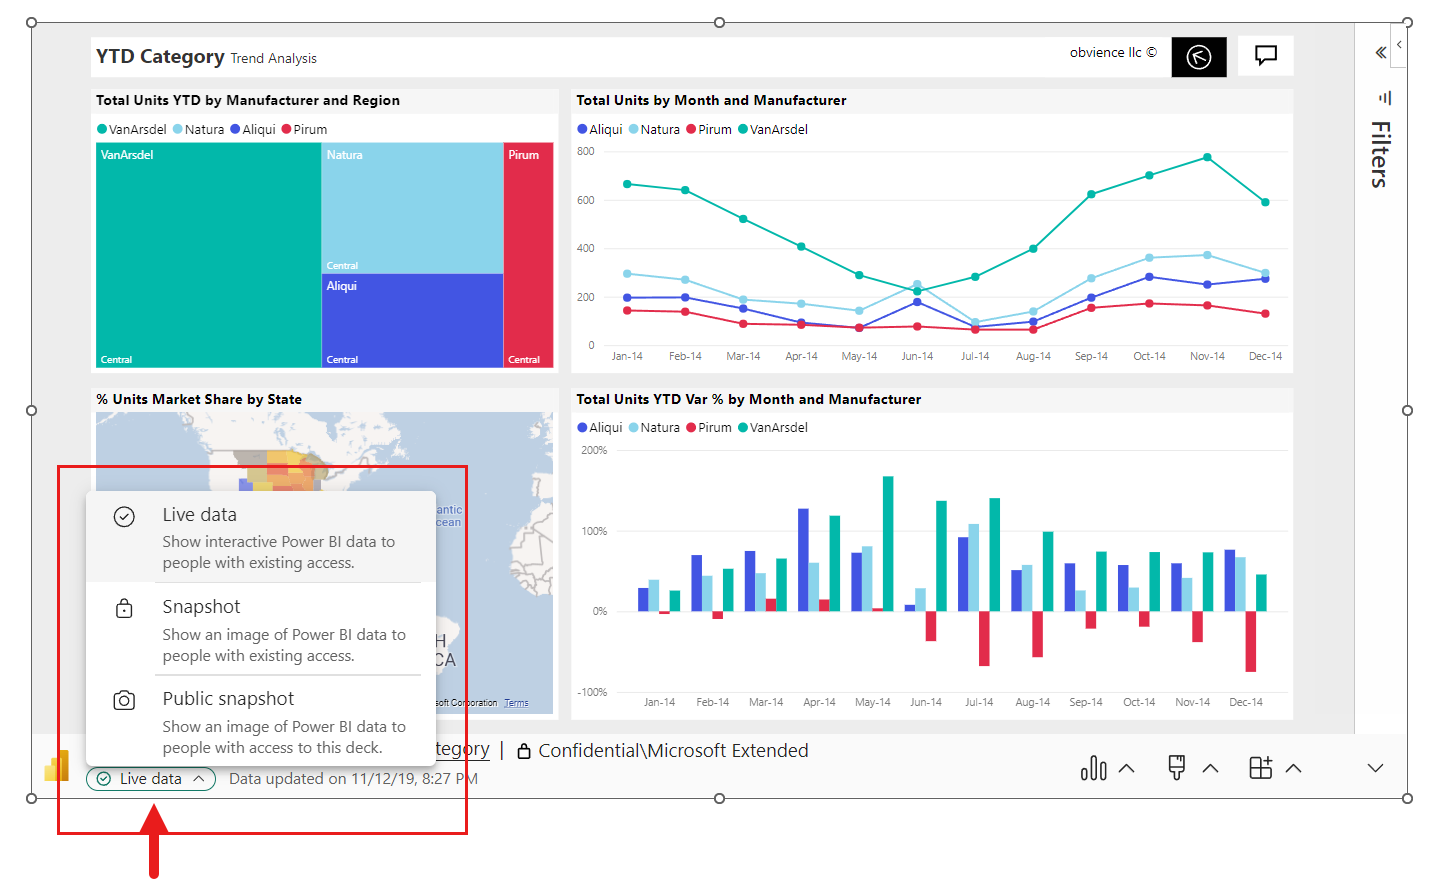
New static image options make it possible to use static images without having to worry about inadvertently exposing Power BI content to unauthorized users.
Snapshot: When you choose Snapshot, only users who have permission to view the report in Power BI will see the static image. Users who don't have permission will be able to request access. This option helps prevent inadvertently showing Power BI content to unauthorized users.
Public snapshot: When you choose Public snapshot, anyone who can view the presentation will see the static image, regardless of their permissions in Power BI.
The improved functionality also helps prevent inadvertent exposure of Power BI content in the slide thumbnails you see in such places as the navigation pane and slide sorter. Now thumbnails of slides that include an add-in merely display a blue-cube until the slide with the add-in actually loads and Power BI permissions are checked. At that point the thumbnail captures an image of whatever is displayed in the slide.
The improved save-as-static-image functionality requires Office version 2312 (Build 17126) or later. If your Office version meets this requirement, don't use the Save as image option located the add-in side pane.
You can only switch between live data and a static image in the PowerPoint desktop application - you can't do this in PowerPoint for the web. However, PowerPoint for the web does respect the choice you made in the desktop application. So whatever view you selected in the desktop app will be the view that you'll see in PowerPoint for the web.
When you paste a direct report link (the URL copied from the browser) to the Power BI add-in in a presentation, you can now make that link shareable within the Power BI add-in. Previously, when you pasted a direct report link into the Power BI add-in, there was no option to make it sharable in the add-in before you added it to the presentation. Viewers of the presentation had to have access to the report before you used the direct report link or they wouldn't be able to see the data.
Now, if you have permissions to reshare a report, the Power BI add-in can replace the link you pasted with a shareable link. When you have sharable links enabled, you'll see a checkbox added below the report URL that asks you if you want to give viewers automatic access to the data. Mark this checkbox and Power BI add-in creates a shareable link for you. If you use a sharable link, other users viewing the presentation will have the required permissions to see the report and won't need to request access when the viewing the presentation.
You must have sharable links enabled for your organization to use this feature. For more information on using sharable links, go to Change a direct link to a shareable link.
It's easier to find and insert the Power BI reports you need for your presentation. Now, when you add the Power BI add-in to your slide, the add-in automatically scans the title of the slide and suggests Power BI content that might be relevant. Let's say the title of your slide is "New stores sales," for example. The add-in shows you a list of Power BI reports that contain data about sales. The add-in also shows you your recently visited Power BI reports, and makes it easy to access reports you're working on or frequently use. Learn more about the new feature
Now you can add a custom outline to your Power BI add-in. Customize color, weight, transparency, and more to make your data stand out.

With exciting, recently released features you can now:
The Power BI add-in for PowerPoint is now supported in national/regional clouds as an admin-managed add-in. For more information, see Deploying the add-in in national/regional clouds.
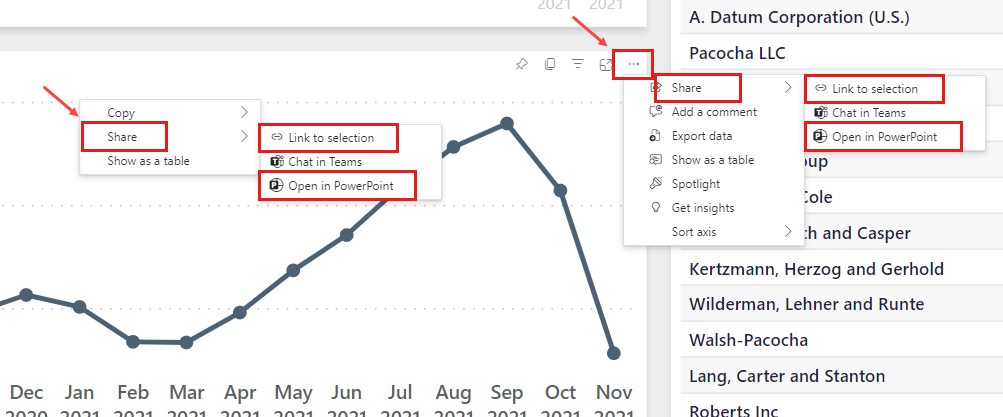
Ever want to put just a single live visual on a slide? Well, now it's super easy. Right select on the visual and choose Open in PowerPoint to open a new presentation with the visual already loaded into the add-in. If you're adding the visual to an existing presentation, choose Link to selection to get the visual's URL for pasting into the add-in in the existing presentation. You can do the same from the More options (...) menu. Check out the documentation for details.
Power BI's data insights help you find and explore insights such as anomalies and trends as you consume and interact with your data. Now with the add-in, you can easily generate insights, which you can then either paste directly into your slide or copy to the clipboard for pasting elsewhere, such as in the slide's notes. Learn more.
Events
Power BI DataViz World Championships
Feb 14, 4 PM - Mar 31, 4 PM
With 4 chances to enter, you could win a conference package and make it to the LIVE Grand Finale in Las Vegas
Learn moreTraining
Learning path
Use advance techniques in canvas apps to perform custom updates and optimization - Training
Use advance techniques in canvas apps to perform custom updates and optimization
Certification
Microsoft Certified: Power BI Data Analyst Associate - Certifications
Demonstrate methods and best practices that align with business and technical requirements for modeling, visualizing, and analyzing data with Microsoft Power BI.
Documentation
Add a live Power BI report page to PowerPoint - Power BI
Learn how to install the Power BI PowerPoint add-in in a PowerPoint slide.
View and present live Power BI data in PowerPoint - Power BI
Learn how to work with live Power BI data in PowerPoint.
About storytelling with Power BI in PowerPoint - Power BI
Learn about enhancing data storytelling in PowerPoint with live, interactive Power BI data using the Power BI add-in for PowerPoint.