Events
Power BI DataViz World Championships
Feb 14, 4 PM - Mar 31, 4 PM
With 4 chances to enter, you could win a conference package and make it to the LIVE Grand Finale in Las Vegas
Learn moreThis browser is no longer supported.
Upgrade to Microsoft Edge to take advantage of the latest features, security updates, and technical support.
APPLIES TO: ![]() Power BI Desktop
Power BI Desktop ![]() Power BI service
Power BI service
With dynamic format strings for measures, you can determine how measures appear in visuals by conditionally applying a format string with a separate DAX expression.
Note
Dynamic format strings for measures is currently in Preview. When in Preview, functionality and documentation are likely to change.
Dynamic format strings overcome an inherent disadvantage of using the FORMAT function. That is, with FORMAT even numeric data types are returned as a string, which may not work with visuals that require numeric values, like charts. When using dynamic format strings, the measure keeps its data type and isn't forced to change to a string data type. This applies different format strings to the measure depending on the context.
Dynamic format strings can also be used with calculation groups. The same DAX patterns that work with calculation groups can also be utilized in dynamic format strings for measures, but the scope is limited to individual measures instead of all measures in the model. To learn more, see Calculation groups - Dynamic format strings.
In the Data pane, select the measure for which you want to specify a dynamic format string.
In the Measure tools ribbon > Formatting section > Format listbox, select Dynamic. A new listbox with Format already selected appears to the left of the DAX formula bar. This drop down is how you can switch between the static measure DAX expression and the dynamic format string DAX expression. Whatever the static format string was in use before switching to Dynamic is prepopulated as a string in the DAX formula bar.
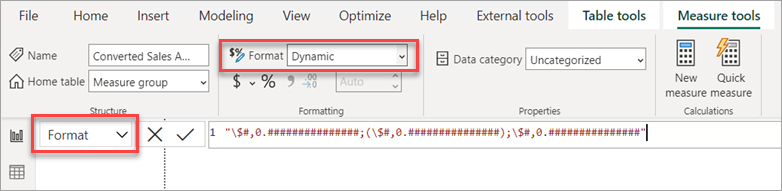
Overwrite the string with a DAX expression that outputs the correct format string for your measure. For example, the following expression looks up the currency format string we want from a ‘Country Currency Format Strings’ table:
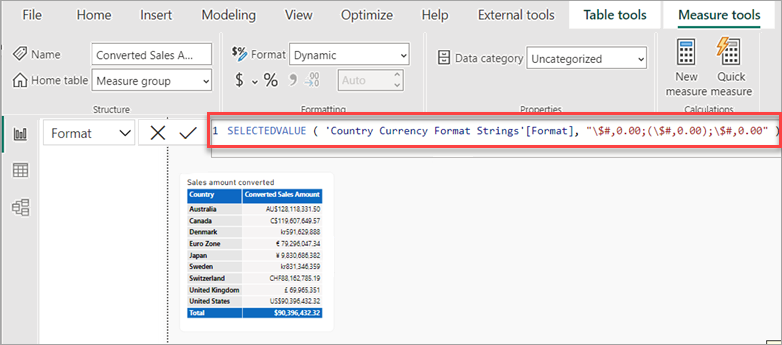
Verify your dynamic format string works in a visual.
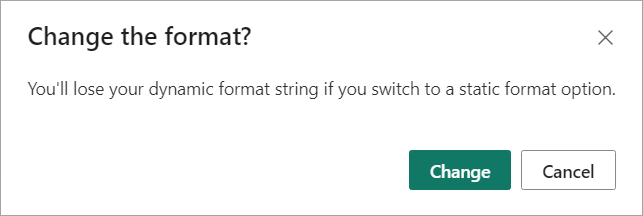
To delete the dynamic format string and return to using a static format string, in the Formatting section > Format listbox, select a different format option. Because there's no undo to this action, a dialog appears asking if you want to proceed. If you want to go back to using a dynamic format string again, you must reenter the DAX expression.
The best way to learn about a new feature is to try it yourself. You can do just that with the sample Adventure Works 2020 PBIX file available at DAX sample model. By using the sample model, you can add currency conversion to show converted sales amount by year. After downloading, open the file in Power BI Desktop.
The sample model doesn't contain all the data necessary to create and use dynamic format strings. To get started, you first need to add two tables.
On the Home ribbon, select Enter data.
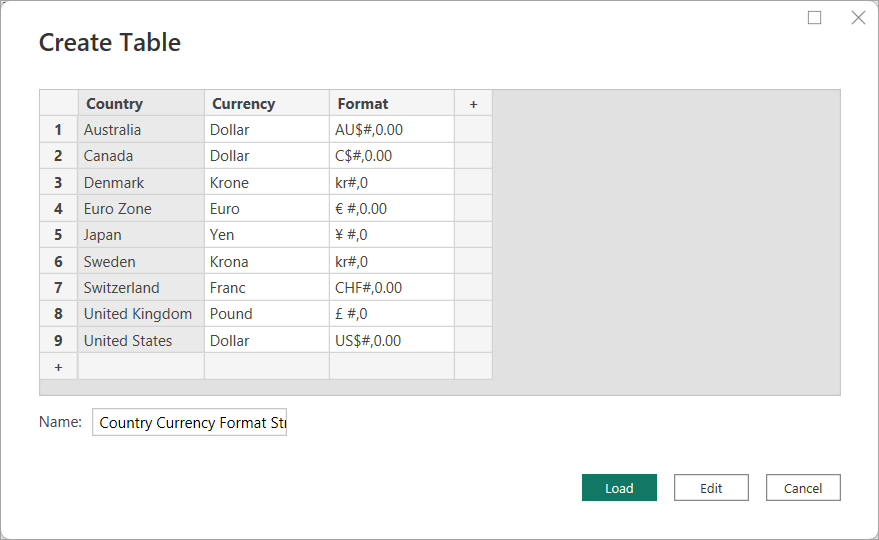
In the Create Table dialog, enter the following table name, and then copy and paste the following table:
Table name: Country Currency Format Strings
| Country | Currency | Format |
|---|---|---|
| Australia | Dollar | AU$#,0.00 |
| Canada | Dollar | C$#,0.00 |
| Denmark | Krone | kr#,0 |
| Euro Zone | Euro | € #,0.00 |
| Japan | Yen | ¥ #,0 |
| Sweden | Krona | kr#,0 |
| Switzerland | Franc | CHF#,0.00 |
| United Kingdom | Pound | £ #,0 |
| United States | Dollar | US$#,0.00 |
Verify the table looks correct, and then click Load.
Repeat the previous steps for the following table:
Table name: Yearly Average Exchange Rates
| Country | Currency | Year | Yearly Average Exchange Rate |
|---|---|---|---|
| Australia | Dollar | 2022 | 1.442 |
| Australia | Dollar | 2021 | 1.332 |
| Australia | Dollar | 2020 | 1.452 |
| Australia | Dollar | 2019 | 1.439 |
| Australia | Dollar | 2018 | 1.34 |
| Australia | Dollar | 2017 | 1.358 |
| Canada | Dollar | 2022 | 1.301 |
| Canada | Dollar | 2021 | 1.254 |
| Canada | Dollar | 2020 | 1.341 |
| Canada | Dollar | 2019 | 1.327 |
| Canada | Dollar | 2018 | 1.297 |
| Canada | Dollar | 2017 | 1.35 |
| Denmark | Krone | 2022 | 7.077 |
| Denmark | Krone | 2021 | 6.29 |
| Denmark | Krone | 2020 | 6.538 |
| Denmark | Krone | 2019 | 6.67 |
| Denmark | Krone | 2018 | 6.319 |
| Denmark | Krone | 2017 | 6.864 |
| Euro Zone | Euro | 2022 | 0.951 |
| Euro Zone | Euro | 2021 | 0.846 |
| Euro Zone | Euro | 2020 | 0.877 |
| Euro Zone | Euro | 2019 | 0.893 |
| Euro Zone | Euro | 2018 | 0.848 |
| Euro Zone | Euro | 2017 | 0.923 |
| Japan | Yen | 2022 | 131.454 |
| Japan | Yen | 2021 | 109.817 |
| Japan | Yen | 2020 | 106.725 |
| Japan | Yen | 2019 | 109.008 |
| Japan | Yen | 2018 | 110.424 |
| Japan | Yen | 2017 | 116.667 |
| Sweden | Krona | 2022 | 10.122 |
| Sweden | Krona | 2021 | 8.584 |
| Sweden | Krona | 2020 | 9.205 |
| Sweden | Krona | 2019 | 9.457 |
| Sweden | Krona | 2018 | 8.703 |
| Sweden | Krona | 2017 | 8.894 |
| Switzerland | Franc | 2022 | 0.955 |
| Switzerland | Franc | 2021 | 0.914 |
| Switzerland | Franc | 2020 | 0.939 |
| Switzerland | Franc | 2019 | 0.994 |
| Switzerland | Franc | 2018 | 0.979 |
| Switzerland | Franc | 2017 | 1.024 |
| United Kingdom | Pound | 2022 | 0.811 |
| United Kingdom | Pound | 2021 | 0.727 |
| United Kingdom | Pound | 2020 | 0.779 |
| United Kingdom | Pound | 2019 | 0.784 |
| United Kingdom | Pound | 2018 | 0.75 |
| United Kingdom | Pound | 2017 | 0.808 |
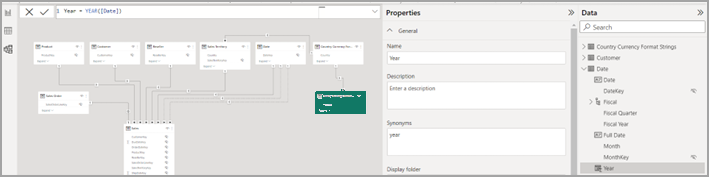
A new Year column is needed in the existing Date table.
In Model view, right-click the Date table, and then select New column.
In the DAX formula bar, enter the following expression: Year = YEAR([Date]), and then press Enter.
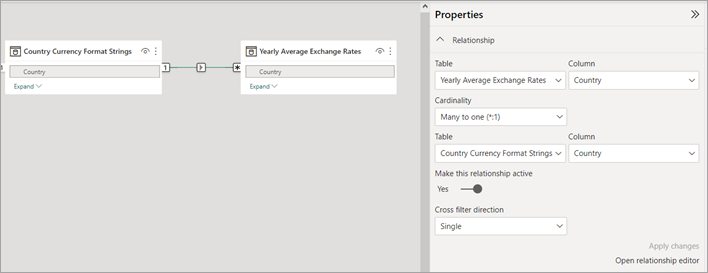
Relationships are needed between your new Yearly Average Exchange Rates and Country Currency Format Strings tables, and between Yearly Average Exchange Rates table and the existing Date table.
If you have Autodetect for relationships on, the relationship between Country Currency Format Strings and Yearly Average Exchange Rates on the Country column may have been created for you. If not, then create this relationship:
The relationship should look like this:
If you have Autodetect for relationships on, a relationship between Country Currency Format Strings and Sales territory on the Country column may have been created. This relationship, however, isn't correct for our model. In Model view, delete this relationship.
Instead, create a relationship between Yearly Average Exchange Rates and Date on the Year column.
The relationship should look like this:

Save your model.
A measure group helps you organize different measures by having them in a single table.
In the Home ribbon, select Enter data.
In the Create Table dialog, leave the values blank. Name the table Sales measures, and then click Load. This table contains your new measures.
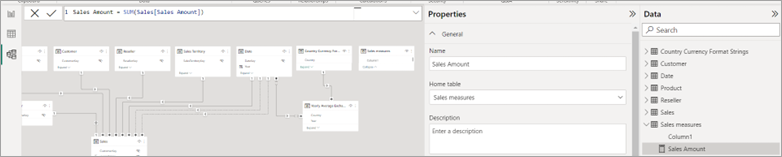
In the Data pane, expand and right-click Sales measures, and then select New measure. Enter the following DAX expression into the DAX formula bar, and then press Enter:
Sales Amount = SUM(Sales[Sales Amount])
It should look like this:
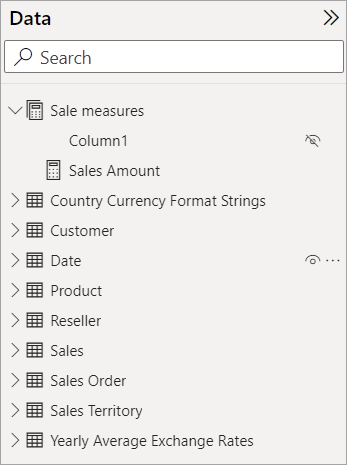
In Sales measures, right-click Column1, and then select Hide in report view. This changes Sales measures to a measure group, which now appears at the top of the Data pane with a measure group icon, like this:
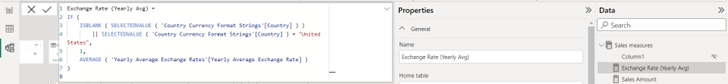
You can now create a measure to compute the exchange rate. Right-click Sales measures, select New measure, enter the following expression into the DAX formula bar, and then press Enter:
Exchange Rate (Yearly Avg) =
IF (
    ISBLANK ( SELECTEDVALUE ( 'Country Currency Format Strings'[Country] ) )
        || SELECTEDVALUE ( 'Country Currency Format Strings'[Country] ) = "United States",
    1,
    AVERAGE ( 'Yearly Average Exchange Rates'[Yearly Average Exchange Rate] )
)
It should look like this:
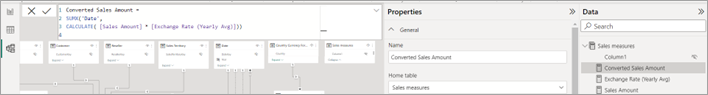
Now you create another measure to convert the Sales Amount measure to other currencies. Right-click Sales measures, select New measure, enter the following expression into the DAX formula bar, and then press Enter:
    Converted Sales Amount =
    SUMX('Date',
    CALCULATE( [Sales Amount] * [Exchange Rate (Yearly Avg)]))
The Sales measures measure group should now look like this:
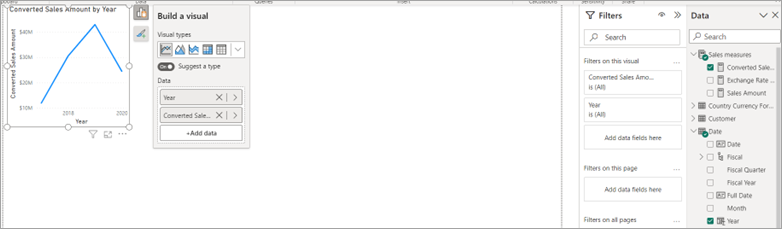
Go to Report view. Add a new, blank page to the report.
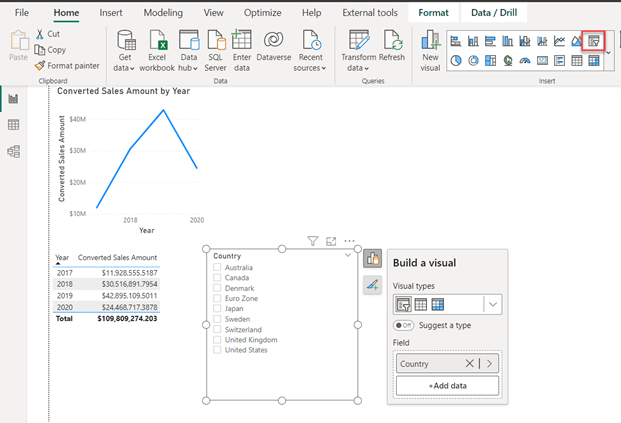
Add a line chart visual to your new report page. You use this visual to see your measure before adding the dynamic format string for measures.
In the Data pane > Sales measures, select Converted Sales Amount. Without clicking anywhere else, also select Year in the Date table.
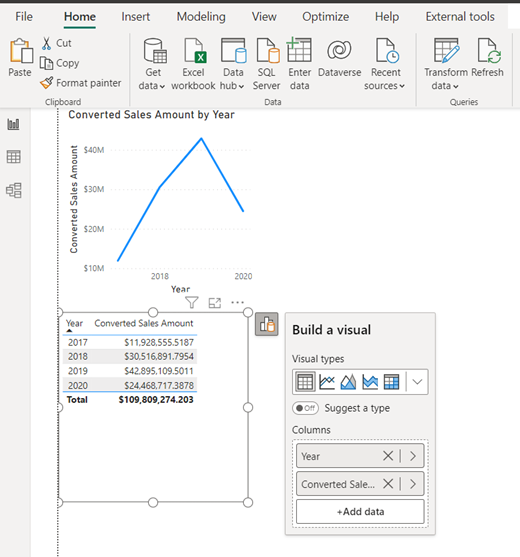
Copy and then paste the visual so you have two line chart visuals. Change the second line chart visual to a table visual, and then move it below the line chart, like this:
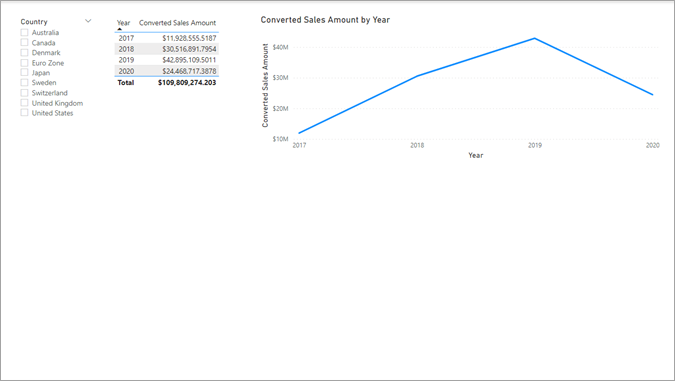
Add a slicer visual to your report page. In the Format ribbon, add Country from the Country Currency Format Strings table to the slicer.
Rearrange the visuals until they have a better layout, something like this:
While not required, you can change visual properties to make a nicer report:
Slicer
Table
Line chart
Canvas (optional)
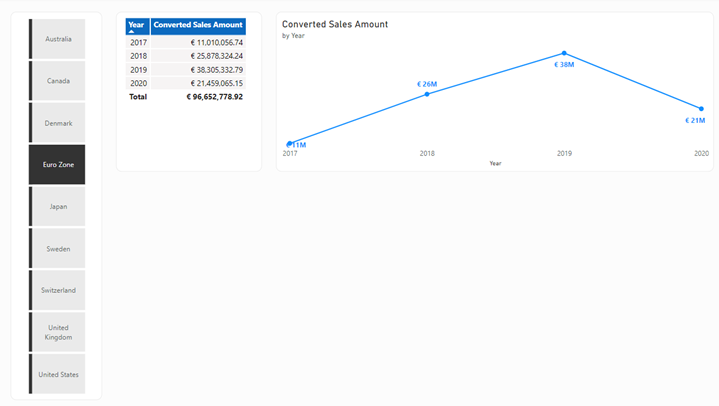
With those visual properties, you get a nice report page, like this:
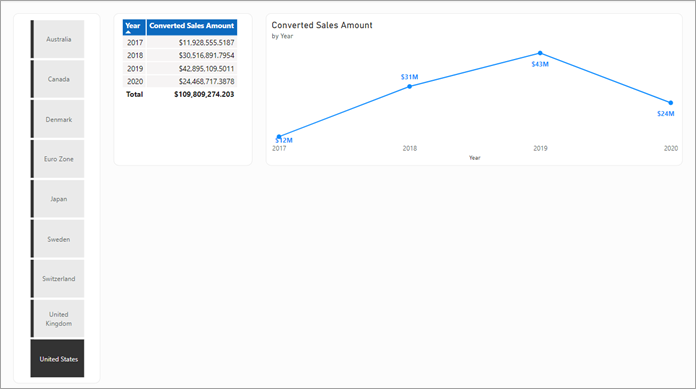
Selecting different Country names in the slicer shows the Converted Sales Amount measure result in visuals, but not in the right format for that country or region.
In the Data pane > Sales measures, select Converted Sales Amount.
In the Measure tools ribbon, click the Format drop down, and then select Dynamic.
The dropdown listbox to the left of the formula bar should now say Format, and the formula in the formula bar should have a format string. Replace the format string with the following DAX expression, and then press Enter:
SELECTEDVALUE ( 'Country Currency Format Strings'[Format], "\$#,0.00;(\$#,0.00);\$#,0.00" )
It should look like this:
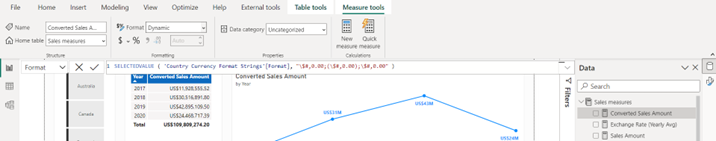
Select a different Country in the slicer. The table and line chart visuals should now show the converted currency amount, in the correct format, for that country or region. Try selecting a different country/region in the slicer to see how the visuals change.
Save your model.
During Preview, the following issues and limitations are being addressed:
Visuals have formatting options that may impact how the format string is displayed. If the formatting is showing unexpectedly in a visual, go to the visual Format options, search for Display units and change it from Auto to None.

The measure itself can be referenced directly in its dynamic format string by using its name, like [Measure A], or indirectly by using SELECTEDMEASURE().
Dynamic format strings for measures are only for model measures. Report measures that can be added to a live connect report can't have dynamic format strings for measures.
With DirectQuery for Analysis Services, when you click Make changes to this model on a live connect report, it shifts the connection to the DirectQuery over Analysis Services. In general, you can make changes to the format strings of the remote model measures. During Preview:
Events
Power BI DataViz World Championships
Feb 14, 4 PM - Mar 31, 4 PM
With 4 chances to enter, you could win a conference package and make it to the LIVE Grand Finale in Las Vegas
Learn moreTraining
Module
Add measures to Power BI Desktop models - Training
In this module, you'll learn how to work with implicit and explicit measures. You'll start by creating simple measures, which summarize a single column or table. Then, you'll create more complex measures based on other measures in the model. Additionally, you'll learn about the similarities of, and differences between, a calculated column and a measure.
Certification
Microsoft Certified: Power BI Data Analyst Associate - Certifications
Demonstrate methods and best practices that align with business and technical requirements for modeling, visualizing, and analyzing data with Microsoft Power BI.
Documentation
Use custom format strings in Power BI Desktop - Power BI
Learn how to use custom format strings in Power BI Desktop to customize how fields appear in visuals.
Use report readers to change visuals (preview) - Power BI
Learn how to let report readers dynamically change the visuals in a report by using field parameters.
Create calculation groups in Power BI - Power BI
Learn how to create calculation groups in Power BI.