Events
Power BI DataViz World Championships
Feb 14, 4 PM - Mar 31, 4 PM
With 4 chances to enter, you could win a conference package and make it to the LIVE Grand Finale in Las Vegas
Learn moreThis browser is no longer supported.
Upgrade to Microsoft Edge to take advantage of the latest features, security updates, and technical support.
This Insights feature helps you easily explore and find insights such as anomalies and trends in your data as you interact and consume your reports. It notifies you if there are interesting insights and provides explanations for them. It works out of the box on any report, so you can automatically start getting insights from your reports without any setup.

Did you know? Power BI has other insights features that use artificial intelligence (AI):
Insights is supported for reports in workspaces that are hosted in Power BI Premium and Premium Per User (PPU) capacities. If you have a PPU license, you can also use the feature in workspaces that are hosted in shared capacities, but notifications won't be supported.
Power BI automatically runs insights analysis when you open a report. The light bulb in the action bar turns yellow and toast notifications are shown if there are Top insights for visuals in your current report page. Top insights are those that are noteworthy, based on factors like recency and significance of the trend or anomaly. These notifications are supported only in Premium and PPU workspaces. Note that the tenant and report setting for receiving notifications should be turned on for this to work.
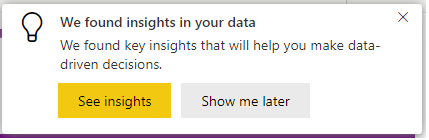
Select the See insights button to open the Insights pane or choose Show me later if you’d not like to get further notifications for this report in the current session.
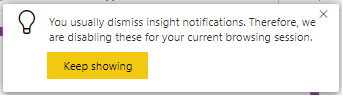
If you usually dismiss these notifications or don't engage with them, they'll be disabled for the current session. You can select Keep Showing to continue getting notifications.
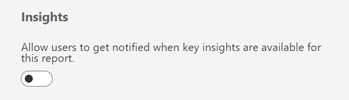
You can control the setting for notifications in a report as shown below:
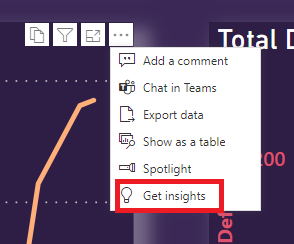
Select Get insights in the action bar to open the Insights pane.

The pane only shows insights about the current report page and it updates when you select a different page on the report.
Select More options (...) in the upper-right corner of a visual and then Get insights to see insights about just that visual.
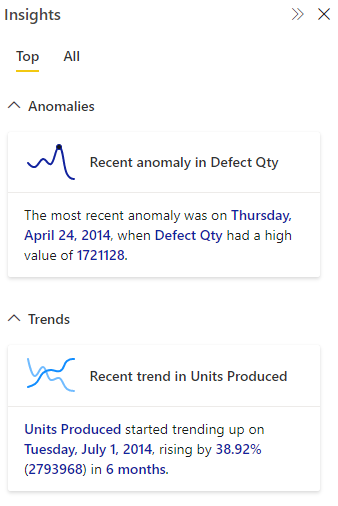
The Insights pane currently shows you three types of insights – Anomalies, Trends, and KPI analysis. The Top tab shows you Top insights. All tab shows you both Top insights and other insights.
Insights are computed every time you open a report or interact with a report such as changing pages, changing filters, or cross-filtering your data.
An anomaly is an abnormality in time-series data, such as unexpected spikes and dips in the data. The algorithm computes a boundary around what’s considered a normal or expected value. Any value found outside this boundary is marked as an anomaly. Check out this technical blog for more details about the algorithm. There are three types of anomaly insights:
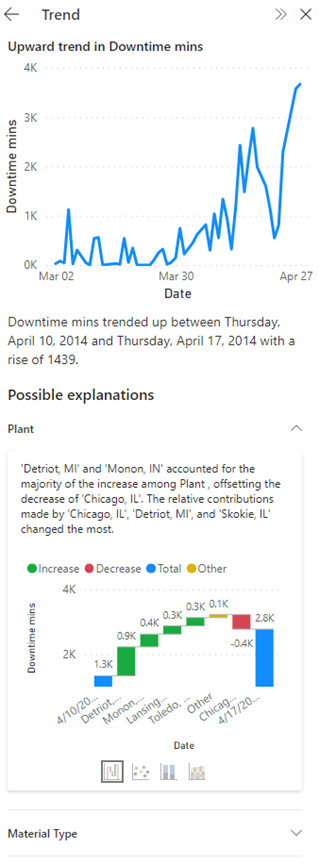
A trend occurs there's a prolonged increase or decrease in time-series data. There are a series of steps the Power BI algorithm uses to find meaningful trends: It first performs data smoothening, interpolation, time-series sampling. The trends are then identified for statistical significance based on the slope and length of a change in value. The algorithm removes noise like seasonality and outliers. For example, if sales jump in December, the algorithm won't mark that as a noteworthy trend because it's common for sales to jump around the holidays.
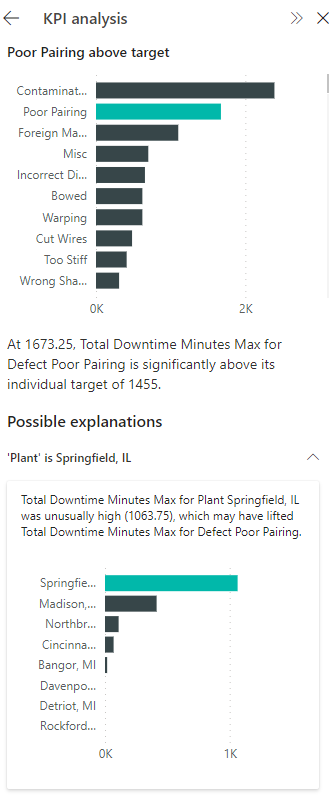
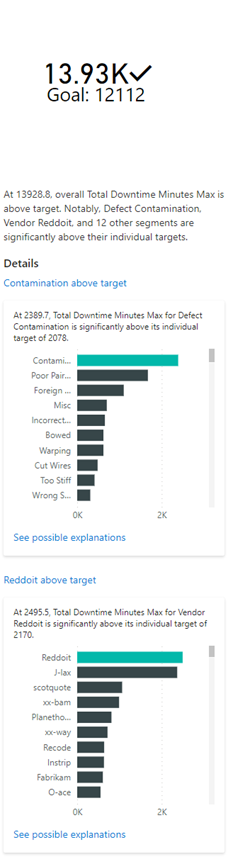
KPI analysis with a target looks at the variance of the current value to its target. It's considered significant if the variance is high or low compared to other segments. KPI analysis without a target looks at the value itself and flags ones that are high or low compared to other segments.
Select the card to get more details about the insight. Expand/collapse the cards under Possible Explanations to view/hide the explanation visuals and text.
When an anomaly in your data is flagged, Power BI runs the analysis across different dimensions in your data model to look for spikes or dips in the measure that correlate to the anomaly. They're shown as possible explanations ranked by strength. For more information, see Apply insights in Power BI to explain fluctuations in visuals.

When a trend in your data is flagged, Power BI looks for and identifies the categories that most influenced the increase or decrease in the identified trend. Possible explanations are ranked based on the relative contributions from different categories to the increase or decrease in trend. For more information see Run quick insights on a semantic model.
For KPI analysis explanations, Power BI looks for and identifies the categories that have significantly high or low values. For KPI analysis with target, possible explanations are ranked based on Z-scores of the difference of the value from the target. Whereas for KPI analysis without target, possible explanations are ranked based on the Z-scores of the value itself.
If the insight mentions multiple anomalies, or trends, selecting the insight card will show you the Details cards to help you choose the specific anomaly/trend/KPI segment you’d like to get explanations for.
Insights is currently not available in apps and embedded for reports in Premium workspaces. Users with PPU license can still use Insights. If no insights found are found, you see this message: “We didn’t find any insights”. Here are some possible reasons:
Explanations aren't supported in the following cases:
If no explanations are found, you see this message: “We didn’t find any significant explanations”. You can try bringing in more fields for the analysis.
For more information about insights, see the following articles:
Events
Power BI DataViz World Championships
Feb 14, 4 PM - Mar 31, 4 PM
With 4 chances to enter, you could win a conference package and make it to the LIVE Grand Finale in Las Vegas
Learn moreTraining
Learning path
Use advance techniques in canvas apps to perform custom updates and optimization - Training
Use advance techniques in canvas apps to perform custom updates and optimization
Certification
Microsoft Certified: Power BI Data Analyst Associate - Certifications
Demonstrate methods and best practices that align with business and technical requirements for modeling, visualizing, and analyzing data with Microsoft Power BI.
Documentation
Use insights to explain increases and decreases in visuals - Power BI
Learn how to easily gain insights to increases or decreases in Power BI Desktop or the Power BI service.
Generate data insights on your semantic model automatically - Power BI
Learn how to get insights about your semantic models and dashboard tiles.
Types of Insights supported by Power BI - Power BI
Learn about Insights in Power BI how they work, what they can do, and why they help interpret your data.