Events
Power BI DataViz World Championships
Feb 14, 4 PM - Mar 31, 4 PM
With 4 chances to enter, you could win a conference package and make it to the LIVE Grand Finale in Las Vegas
Learn moreThis browser is no longer supported.
Upgrade to Microsoft Edge to take advantage of the latest features, security updates, and technical support.
APPLIES TO: ![]() Power BI Desktop
Power BI Desktop ![]() Power BI service
Power BI service
If you want to filter multiple related fields in a single slicer, you do so by building what's called a hierarchy slicer. You can create these slicers in either Power BI Desktop or in the Power BI service.
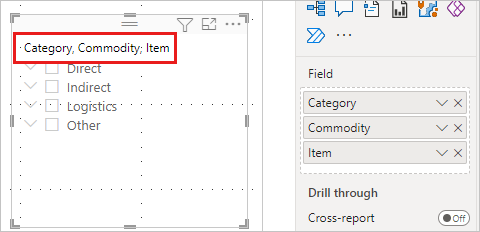
When you add multiple fields to the slicer, by default it displays an arrow, or chevron next to the items that can be expanded to show the items in the next level.
![]()
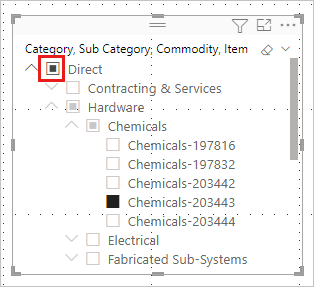
When you select one or more children for an item, you see a semi-selected square for the top-level item.
The behavior of the slicer hasn't changed. You can also style your slicer how you want. For example, in the Format pane, on the Visual tab > Slicer settings > Options Style, you can swap between a Vertical list or a Dropdown.
 you can set it to single-select mode.
You can also make other formatting changes for hierarchy slicers:
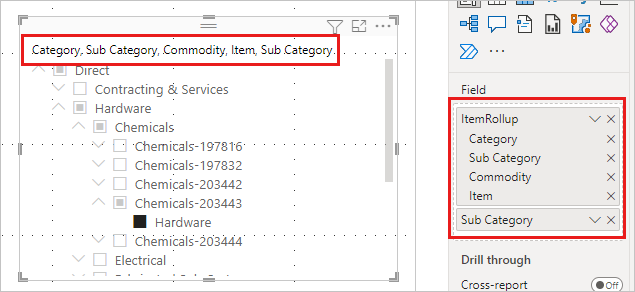
You can edit the title for any slicer, but it's especially useful for hierarchy slicers. By default, the name of a hierarchy slicer is a list of the field names in the hierarchy.
In this example, the title of the slicer lists the three fields in the hierarchy: Category, Commodity, and Item.
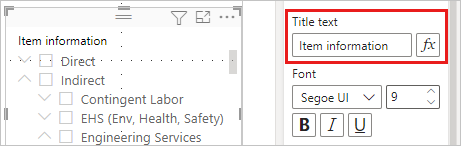
To change the slicer title:
Select the slicer, the Format pane, and then the Visual tab.
Expand Slicer header to see the current name of the slicer in the Title text box.
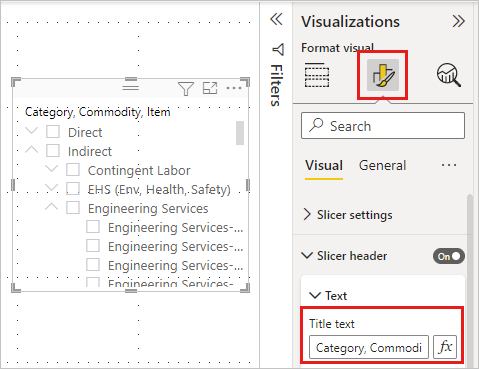
Select the Title text box and enter a new name.
Hierarchy slicers have some other formatting options. You can change the expand/collapse icon from the default arrow to plus and minus signs, or a caret:
Select the hierarchy slicer, then select Format.
From the Visual tab, expand Hierarchy, and then expand Expand/collapse.
For Expand/collapse icon, select Chevron, Plus/minus, or Caret.
![]()
If space is tight on your report, you may want to reduce the amount you indent the child items. By default, the indentation is 15 pixels. To change the indentation:
Select the slicer, then select Format.
From the Visual tab, expand Hierarchy, and then expand Levels. Drag Stepped layout indentation smaller or larger. You can also enter a number in the box.

Events
Power BI DataViz World Championships
Feb 14, 4 PM - Mar 31, 4 PM
With 4 chances to enter, you could win a conference package and make it to the LIVE Grand Finale in Las Vegas
Learn moreTraining
Module
Use hierarchies and DAX in your first data model - Online workshop - Training
In this module, you add measures to a Power BI data model for the first time. You use hierarchies, matrix visuals, and DAX in your data model to explore the data further.
Certification
Microsoft Certified: Power BI Data Analyst Associate - Certifications
Demonstrate methods and best practices that align with business and technical requirements for modeling, visualizing, and analyzing data with Microsoft Power BI.