Events
Power BI DataViz World Championships
Feb 14, 4 PM - Mar 31, 4 PM
With 4 chances to enter, you could win a conference package and make it to the LIVE Grand Finale in Las Vegas
Learn moreThis browser is no longer supported.
Upgrade to Microsoft Edge to take advantage of the latest features, security updates, and technical support.
APPLIES TO: ![]() Power BI Desktop
Power BI Desktop ![]() Power BI service
Power BI service
In this tutorial, you start with a built-in Power BI sample semantic model and create a report with a decomposition tree. A decomposition tree is an interactive visual for ad hoc exploration and conducting root cause analysis. It's also an artificial intelligence (AI) visualization. You can ask it to find the next category, or dimension, to drill down into based on certain criteria. For more information, see Create and view decomposition tree visuals in Power BI.

This tutorial shows you how to:
If you want to familiarize yourself with the built-in sample in this tutorial and its scenario, see Retail Analysis sample for Power BI: Take a tour before you begin.
You don't need a Power BI license to explore the samples in Power BI Desktop. You just need a Fabric free license to explore the sample in the Power BI service, and save it to your My workspace.
To open a Power BI .pbix file, you need to get Power BI Desktop. It's a free download.
Open the Power BI service (app.powerbi.com), and select Learn in the left navigation.
On the Learning center page, under Sample reports, scroll until you see the Retail Analysis Sample.

Select the sample. It opens in Reading mode.
Power BI imports the built-in sample, adding a new dashboard, report, and semantic model to your current workspace.
You have several options for exploring your semantic model. In this tutorial, you're going to explore the semantic model by creating your own report from scratch.

Select More options (...) > Create report.
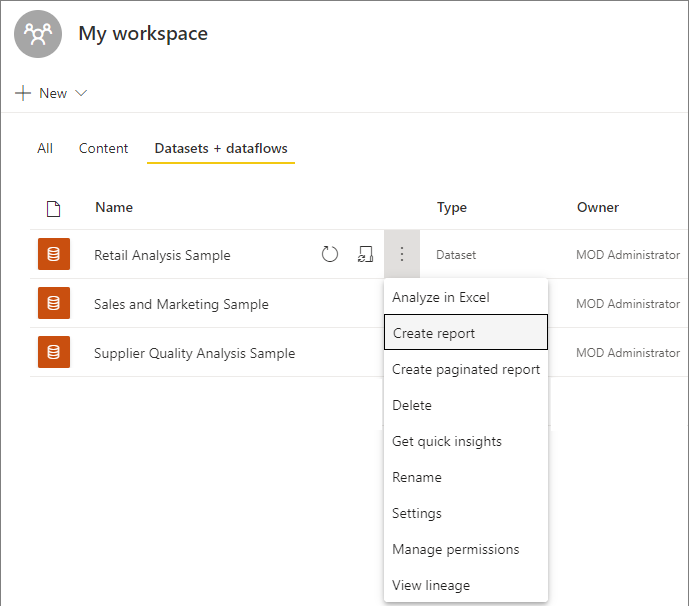
The semantic model opens in report editing mode.

Let's add a decomposition tree, or decomp tree, to our report for ad hoc analysis.
Open Power BI Desktop and load the Retail Analysis Sample. You can get this sample from Download original sample Power BI files.
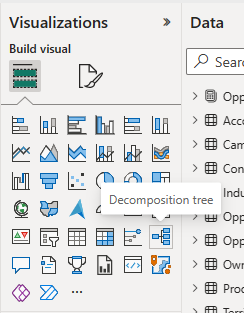
Select the Report icon to open the Reports view. In the Visualizations pane, select the Decomposition tree icon.
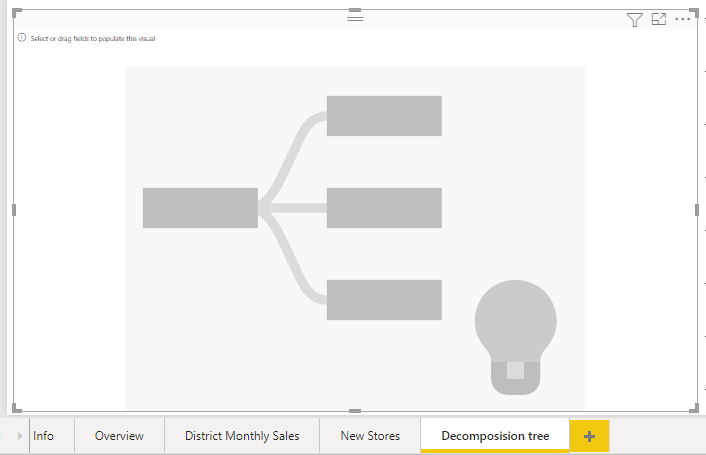
Drag the edge so it fills most of the page. Decomposition trees can get wide.
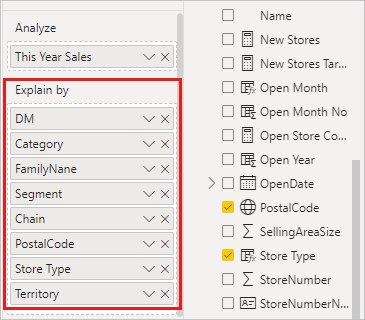
Decomp trees analyze one value by many categories, or dimensions. Expand Sales > This Year Sales and select Value. Power BI adds Value to the Analyze box.

Next, select dimension fields and add them to the Explain by box. Add as many as you want, in any order. You can use them or not, in any order, in the decomp tree. We added:
Now comes the ad hoc analysis part.
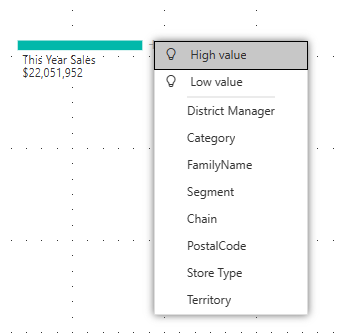
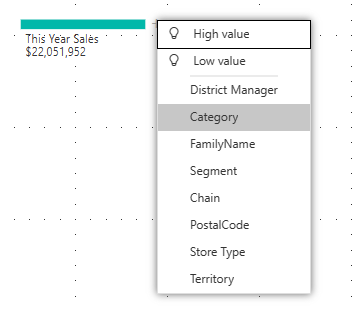
Select the plus sign (+) next to This Year Sales and select High value. That means Power BI uses artificial intelligence to analyze all the different categories in the Explain by box, and pick the one to drill into to get the highest value of the measure being analyzed.
Power BI selects Store type.
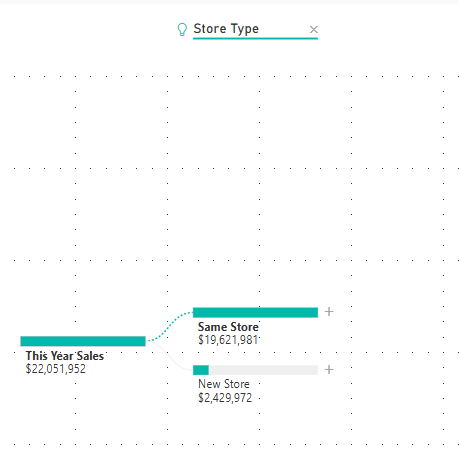
Keep selecting High value until you have a decomp tree that looks like this one.

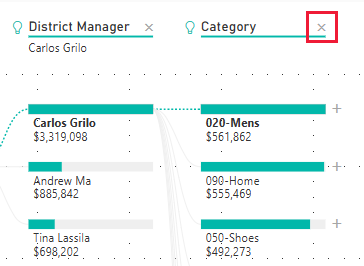
Or select other values yourself, and see what you end up with.
You can delete levels by selecting the X in the heading.
Save your report. Now anyone who views your report can interact with the decomp tree, starting from the first This Year Sales and choosing their own path to follow.
Learn about everything else you can do with decomp trees in Create and view decomposition tree visuals in Power BI.
More questions? Try the Power BI Community
Events
Power BI DataViz World Championships
Feb 14, 4 PM - Mar 31, 4 PM
With 4 chances to enter, you could win a conference package and make it to the LIVE Grand Finale in Las Vegas
Learn moreTraining
Module
Create and share your first Power BI report - Training
With Power BI, you can create compelling visuals and reports. In this module, you learn how to use Power BI Desktop to connect to data, build visuals, and create a report that you can share with others in your organization. You then learn how to publish the report to the Power BI service, so that others can see your insights and benefit from your work.
Certification
Microsoft Certified: Power BI Data Analyst Associate - Certifications
Demonstrate methods and best practices that align with business and technical requirements for modeling, visualizing, and analyzing data with Microsoft Power BI.