Events
Power BI DataViz World Championships
Feb 14, 4 PM - Mar 31, 4 PM
With 4 chances to enter, you could win a conference package and make it to the LIVE Grand Finale in Las Vegas
Learn moreThis browser is no longer supported.
Upgrade to Microsoft Edge to take advantage of the latest features, security updates, and technical support.
This article explains how to use the No data binding feature to create Power BI custom visuals without data roles. Ordinarily, when you create a visual in a Power BI report, the values are defined interactively by adding data fields to the Values well on the Visualizations pane.
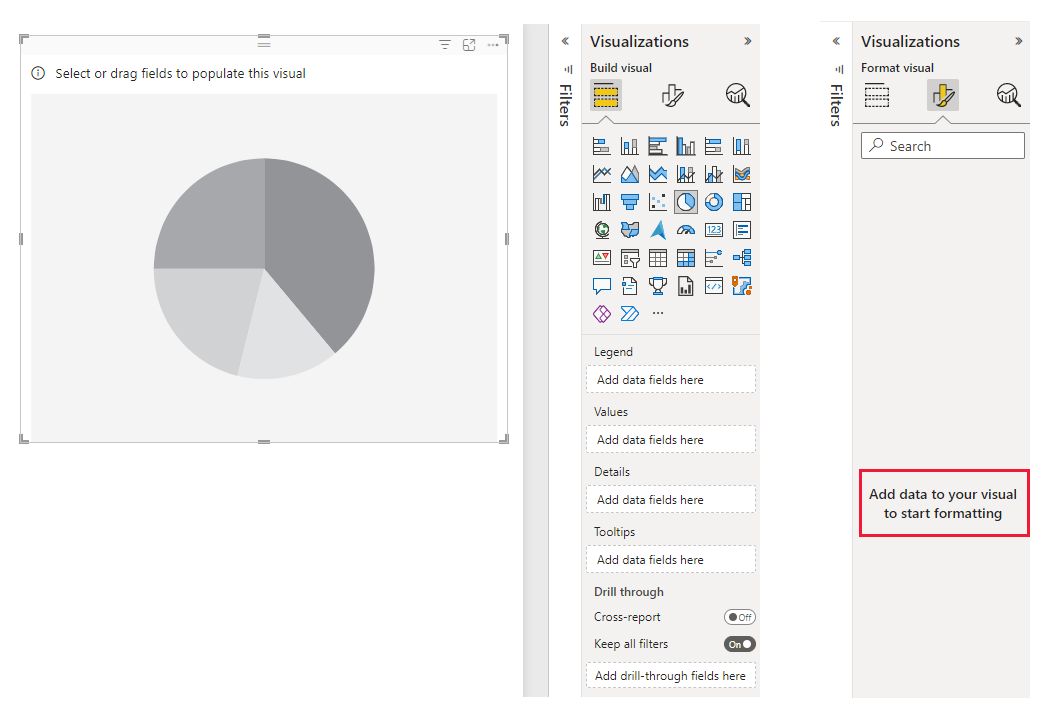
By default, if no values are defined, the format settings are disabled, and you can't update the visual's formatting.
The dataRoles property of the capabilities model allows you to format graphics in Power BI without binding data.
Using the dataRoles capabilities property, you can render a visual and use the update method to change the format settings. You can change settings even if the data buckets are empty, or if your visual doesn't use any data roles.
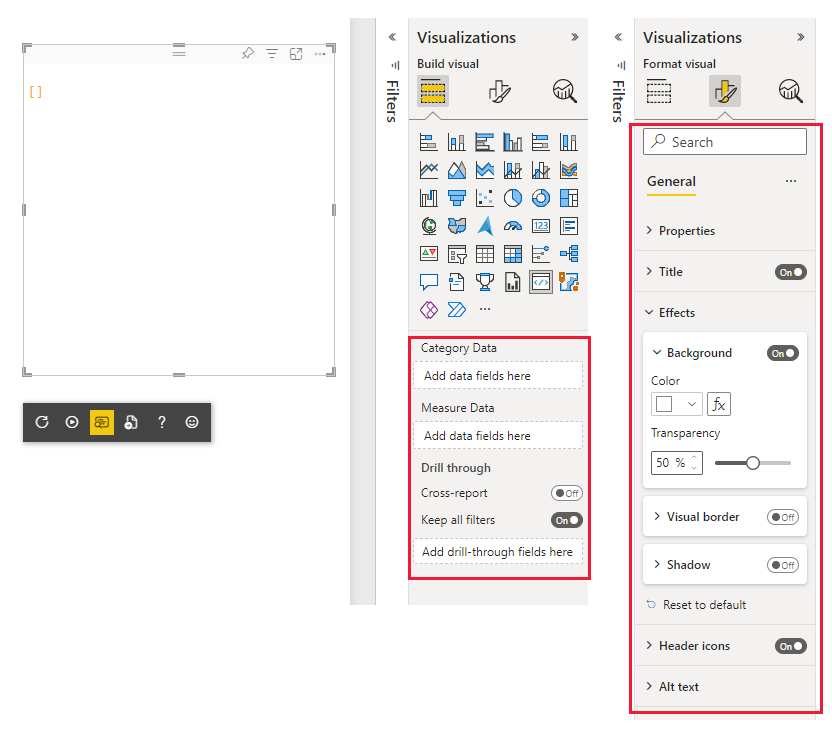
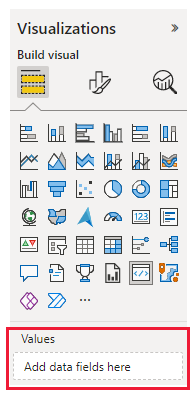
The following tabs show two examples of a Power BI visual. One visual requires binding data, and the other uses the no data roles feature and doesn't require binding data.
When binding data is required, the formatting settings are disabled if there are no data roles or the data wells are empty.
Note
This feature is available from API version 3.6.0 and above. To find out which version you’re using, check the apiVersion in the pbiviz.json file.
To enable the No data binding feature, set the following two parameters in the capabilities.json file to true.
supportsLandingPage allows you to display information on the Power BI card before it's loaded with data.
supportsEmptyDataView allows Power BI updates when the values field is empty.
    {
        "supportsLandingPage": true,
        "supportsEmptyDataView": true,
    }
Events
Power BI DataViz World Championships
Feb 14, 4 PM - Mar 31, 4 PM
With 4 chances to enter, you could win a conference package and make it to the LIVE Grand Finale in Las Vegas
Learn moreTraining
Module
Use visuals in Power BI - Training
Create and customize visuals to present data in compelling and insightful ways.
Certification
Microsoft Certified: Power BI Data Analyst Associate - Certifications
Demonstrate methods and best practices that align with business and technical requirements for modeling, visualizing, and analyzing data with Microsoft Power BI.
Documentation
Power BI visual data point selections - Power BI
Learn how to use the selection manager to add data point selections to Power BI visuals and make them interactive.
Fetch more data from Power BI - Power BI
This article discusses how to enable a segmented fetch of large semantic models for Power BI visuals by using the fetchMoreData API.
Visual interactions in Power BI visuals - Power BI
This article discusses how to check whether Power BI visuals allows users to interact with a visual.