Debug Power BI custom visuals
This article describes some basic debugging procedures you can use when developing your visual. After reading this article, you should be able use the following methods to debug your visual:
Insert breakpoints
The visual's entire JavaScript is reloaded every time the visual is updated Therefore, any breakpoints you add will be lost when the debug visual is refreshed. As a workaround, use debugger statements in your code. It's recommended to turn off auto reload while using debugger in your code.
Here's an example of how to use a debugger statement in your update method.
public update(options: VisualUpdateOptions) {
    console.log('Visual update', options);
    debugger;
    this.target.innerHTML = `<p>Update count: <em>${(this.updateCount</em></p>`;
}
Catch exceptions
When working on your visual, you'll notice that all errors are 'consumed' by the Power BI service. This is an intentional feature of Power BI. It prevents misbehaving visuals from causing the entire app to become unstable.
As a workaround, add code to catch and log your exceptions, or set your debugger to break on caught exceptions.
Log exceptions with a decorator
To log exceptions in your Power BI visual, you need define an exception logging decorator. To do this, add the following code to your visual:
export function logExceptions(): MethodDecorator {
    return function (target: Object, propertyKey: string, descriptor: TypedPropertyDescriptor<any>): TypedPropertyDescriptor<any> {
        return {
            value: function () {
                try {
                    return descriptor.value.apply(this, arguments);
                } catch (e) {
                    console.error(e);
                    throw e;
                }
            }
        }
    }
}
You can use this decorator on any function to see error logging as follows.
@logExceptions()
public update(options: VisualUpdateOptions) {
Break on exceptions
You can also set the browser to break on caught exceptions. Breaking stops code execution wherever an error happens, and allows you to debug from there.
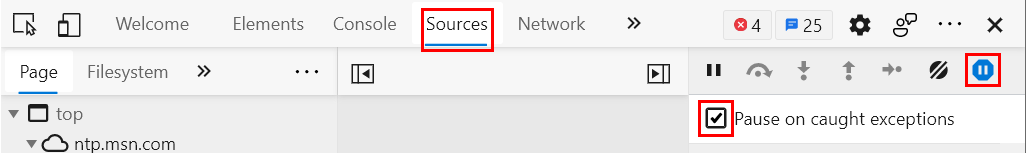
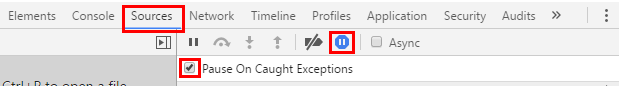
Open developer tools (F12).
Go to the Sources tab.
Select the Pause on exceptions icon (stop sign with a pause symbol).
Select Pause on caught exceptions.
Related content
More questions? Try the Power BI Community
Feedback
Coming soon: Throughout 2024 we will be phasing out GitHub Issues as the feedback mechanism for content and replacing it with a new feedback system. For more information see: https://aka.ms/ContentUserFeedback.
Submit and view feedback for