Run Site Checker
The Site Checker is a self-service diagnostic tool that can be used by administrators to identify common issues in their website. Site Checker helps to identify issues with a website by looking at various configuration parameters and provides suggestions on how to fix them.
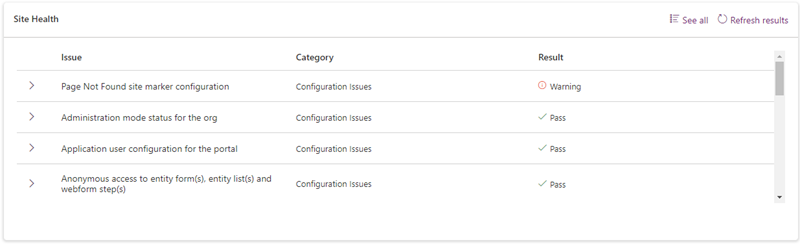
When you run Site Checker, the results are displayed in the Diagnostic Results section in a grid format. The results grid has the following columns:
- Issue: Displays the top-level issue faced by a customer; for example, performance issue.
- Category: Displays the top-level area where issues can be categorized; for example, provisioning or solution upgrade.
- Result: Displays the status of the issue; for example, error or warning.
By default, information in the grid is sorted by the Result column in this order: error, warning, and pass.
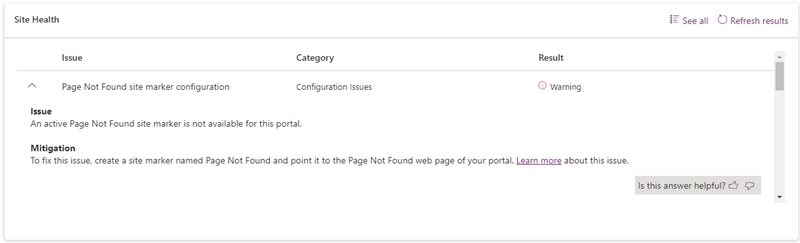
You can expand an issue to view detailed information and mitigation steps. If the mitigation requires any action, you'll see a button that will perform the action. You can also provide feedback on whether the mitigation was useful.
If required, you can rerun the diagnostic checks, which will refresh the results with updated data.
Note
If the website is turned off or IP address filtering is enabled, certain diagnostic checks will not be run on your website.
For a list of common issues diagnosed by the Site Checker, see Power Pages faq.
To run Site Checker:
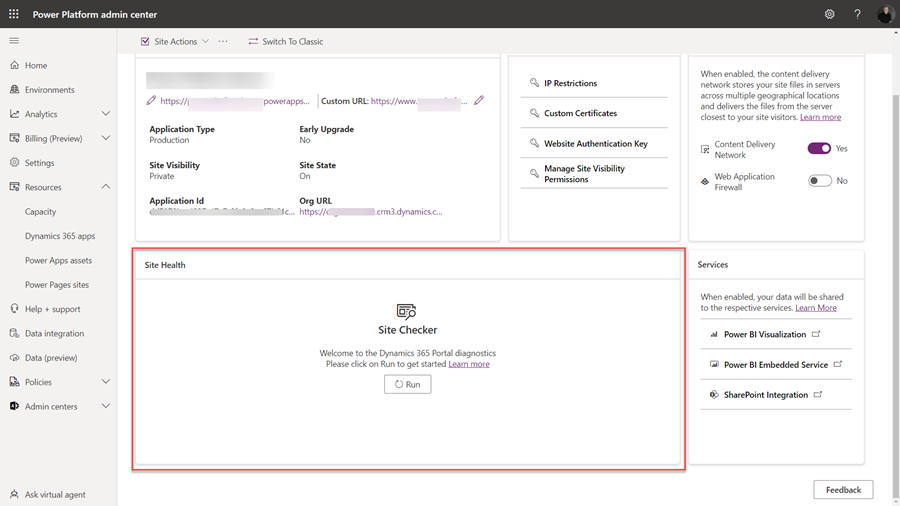
Open the Power Platform admin center.
Under the Resources section select Power Pages sites.
Select your website.
In the Site Health section, select Run in the Site Checker panel.
The diagnostic session will start and gather data about the customer issues. The results are displayed in the Diagnostic Results section.
To rerun the diagnostic checks, select Refresh results.
Identifying web pages listed in diagnostic results
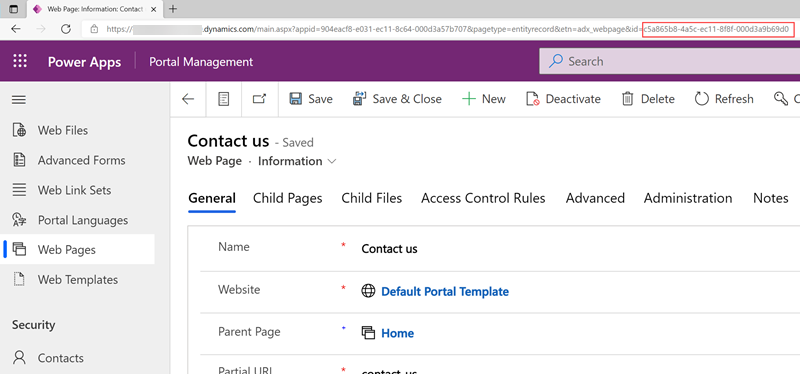
The site checker diagnostic results could list web pages that have the same name as other pages in the website. If there are multiple web pages with the same name, you can identify the specific page affected using the unique guid of the page.
Open the Portal Management app.
In the left pane, select Web Pages.
Open any web page.
Replace the ID in the URL with the guid specified in the portal checker diagnostic results.
Next steps
Analyze and resolve Site Checker diagnostics results:
Feedback
Coming soon: Throughout 2024 we will be phasing out GitHub Issues as the feedback mechanism for content and replacing it with a new feedback system. For more information see: https://aka.ms/ContentUserFeedback.
Submit and view feedback for