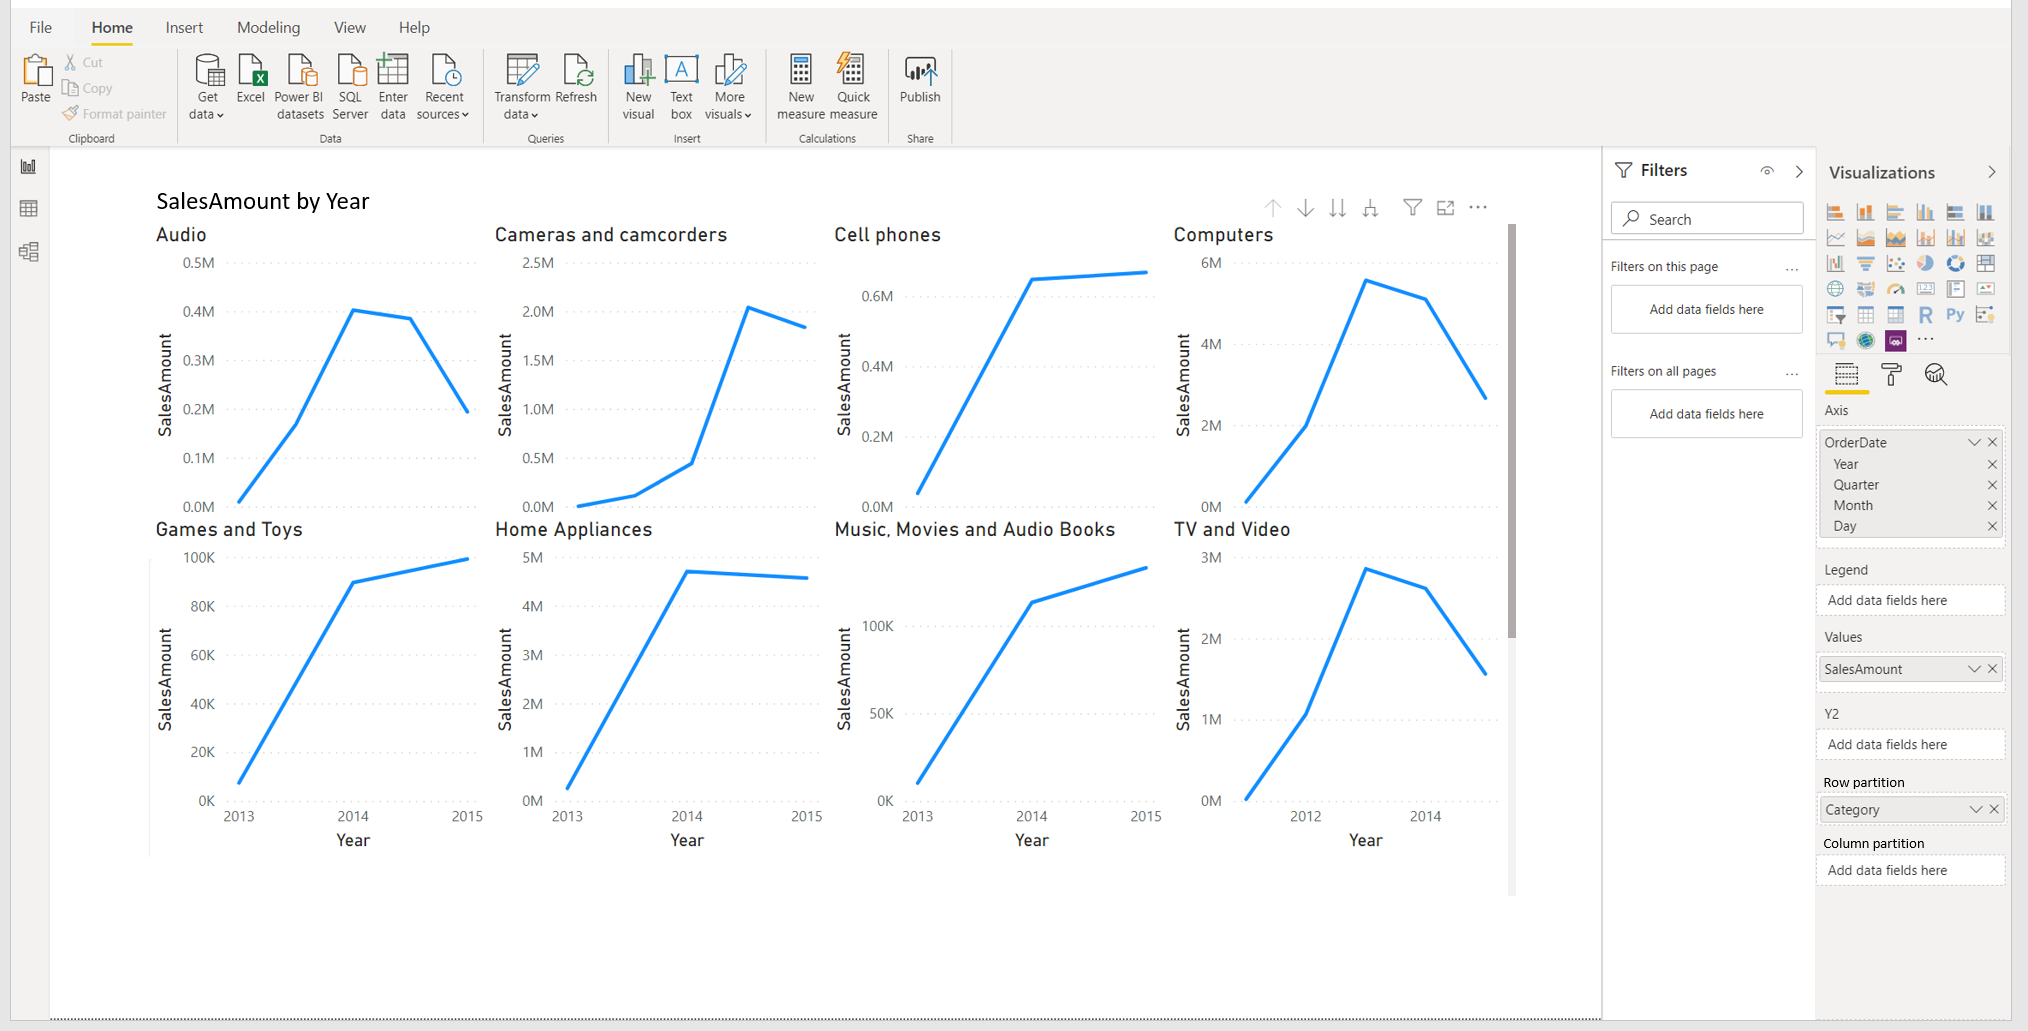
Small multiples visual
Important
This content is archived and is not being updated. For the latest documentation, see Microsoft Power Platform product documentation. For the latest release plans, see Dynamics 365 and Microsoft Power Platform release plans.
| Enabled for | Public preview | General availability |
|---|---|---|
| Users by admins, makers, or analysts |  Dec 15, 2020
 |
- |
Feature details
Small multiples, or trellising, splits a visual into multiple versions of itself, presented side-by-side. The visual's data is partitioned across these versions by a chosen dimension (for example, splitting a "sales over time" line chart by product lines or geo-regions). It is a staple of data visualization which eases comparison between different categories of a dataset.
