Average, Max, Min, StdevP, Sum, and VarP functions
Applies to: ![]() Canvas apps
Canvas apps ![]() Desktop flows
Desktop flows ![]() Dataverse formula columns
Dataverse formula columns ![]() Model-driven apps
Model-driven apps ![]() Power Platform CLI
Power Platform CLI
Aggregate functions that summarize a set of numbers.
Description
The Average function calculates the average, or arithmetic mean, of its arguments.
The Max function finds the maximum value.
The Min function finds the minimum value.
The Sum function calculates the sum of its arguments.
The StdevP function calculates the standard deviation of its arguments.
The VarP function calculates the variance of its arguments.
You can supply the values for these functions as:
- Separate arguments. For example, Sum( 1, 2, 3 ) returns 6.
- A table and a formula to operate over that table. The aggregate will be calculated on the values of the formula for each record.
Fields of the record currently being processed are available within the formula. Use the ThisRecord operator or simply reference fields by name as you would any other value. The As operator can also be used to name the record being processed which can help make your formula easier to understand and make nested records accessible. For more information, see the examples below and working with record scope.
These functions operate on numeric values only. Other types of values, such as strings or records, are ignored. Use the Value function to convert a string into a number.
The Average, Max, Min, and Sum functions can be delegated when used with a data source that supports delegation for these functions. However, StdevP and VarP can't be delegated for any data sources. If delegation is not supported, only the first portion of the data will be retrieved and then the function applied locally. The result may not represent the complete story. A delegation warning will appear at authoring time to remind you of this limitation and to suggest switching to delegable alternatives where possible. For more information, see the delegation overview.
Syntax
Average( NumericalFormula1, [ NumericalFormula2, ... ] )
Max( NumericalFormula1, [ NumericalFormula2, ... ] )
Min( NumericalFormula1, [ NumericalFormula2, ... ] )
Sum( NumericalFormula1, [ NumericalFormula2, ... ] )
StdevP( NumericalFormula1, [ NumericalFormula2, ... ] )
VarP( NumericalFormula1, [ NumericalFormula2, ... ] )
- NumericalFormula(s) - Required. Numeric values to operate on.
Average( Table, NumericalFormula )
Max( Table, NumericalFormula )
Min( Table, NumericalFormula )
Sum( Table, NumericalFormula )
StdevP( Table, NumericalFormula )
VarP( Table, NumericalFormula )
- Table - Required. Table to operate on.
- NumericalFormula - Required. Formula to evaluate for each record. The result of this formula is used for the aggregation. You can use columns of the table in the formula.
Examples
Step by step
Let's say that you had a data source named Sales that contained a CostPerUnit column and a UnitsSold column, and you set the Text property of a label to this function:
Sum(Sales, CostPerUnit * UnitsSold)
The label would show total sales by multiplying the values in those columns for each record and then adding the results from all records together: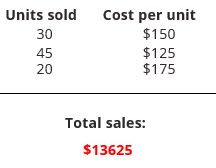
As a different example, let's say that you had sliders that were named Slider1, Slider2, and Slider3 and a label with its Text property set to this formula:
Sum(Slider1.Value, Slider2.Value, Slider3.Value): The label would show the sum of all values to which the sliders were set.
Average(Slider1.Value, Slider2.Value, Slider3.Value): The label would show the average of all values to which the sliders were set.
Max(Slider1.Value, Slider2.Value, Slider3.Value): The label would show the maximum of all values to which the sliders were set.
Min(Slider1.Value, Slider2.Value, Slider3.Value): The label would show the minimum of all values to which the sliders were set.
StdevP(Slider1.Value, Slider2.Value, Slider3.Value): The label would show the standard deviation of all values to which the sliders were set.
VarP(Slider1.Value, Slider2.Value, Slider3.Value): The label would show the variance of all values to which the sliders were set.
Feedback
Coming soon: Throughout 2024 we will be phasing out GitHub Issues as the feedback mechanism for content and replacing it with a new feedback system. For more information see: https://aka.ms/ContentUserFeedback.
Submit and view feedback for