Power BI quick reports in Power Apps enabled by default
Important
This content is archived and is not being updated. For the latest documentation, go to What's new in Power Apps?. For the latest release plans, go to Dynamics 365, Power Platform, and Cloud for Industry release plans.
| Enabled for | Public preview | Early access | General availability |
|---|---|---|---|
| Users, automatically | - |  Feb 6, 2023
 |
 Apr 1, 2023
 |
Business value
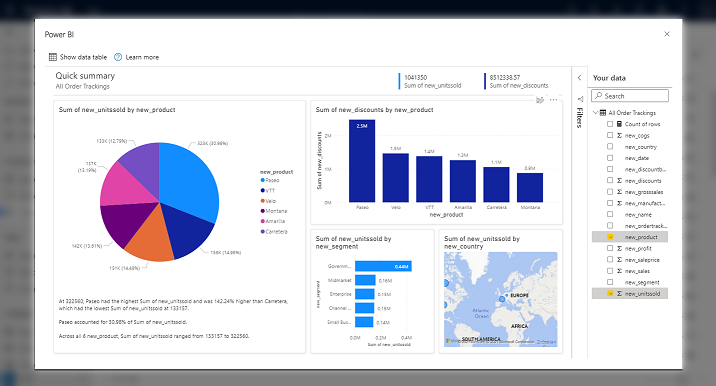
Create reports in the Power BI service starting with a view in a model-driven app. Power BI automatically generates the visuals for you, so you can start exploring the data with just a few clicks.
Feature details
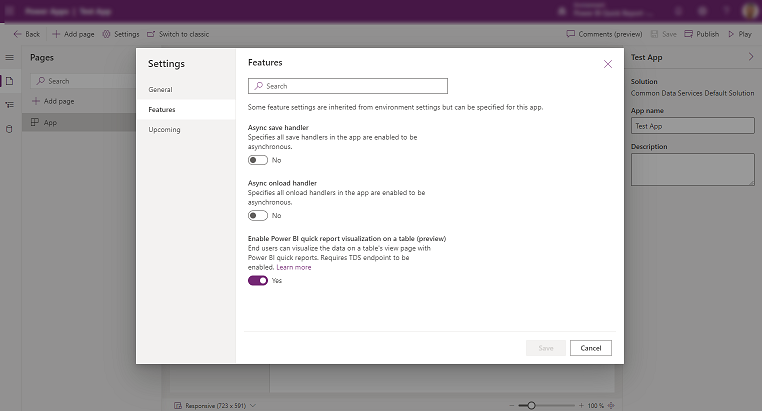
The capability to enable Power BI quick report visualization on a table is available on all grid pages. All apps have this capability enabled by default, with the app setting still available for makers to disable per app.
With the Visualize this view option on all grid pages, you can:
- Create a Power BI quick report, starting from a view with just a one button-click. The Power BI service generates visuals and a layout intelligently based on the underlying data.
- Make any necessary modifications to visuals, filters, or columns (or any combination of all three) using the display name of the columns on the quick report.
- Save the Power BI report to a workspace of your choice, so you can access it anytime and customize it for your needs.
All of these capabilities have already been generally available and enabled by default for new apps.


