System Center
Monitoring Windows Server 2008 with OpsMgr 2007
Pete Zerger
Some of the features discussed in this article are still in beta and are subject to change.
At a Glance:
- How OpsMgr works
- Built-in knowledge
- Diagnosing problems
- Reporting and auditing
How OpsMgr Works
Knowledge to Solve Real-World Problems
Service Availability and Visibility
Seeing the Distributed Enterprise
Service Level Reporting
Pairing Up in Security and Compliance Auditing
A Management Pack for Every Application
Getting Started
The much-anticipated release of Windows Server 2008 introduced significant changes to the OS, adding powerful functionality such as server core, server roles, read-only DCs, Hyper-V, Terminal Services Gateway, and enhancement support for Internet Protocol version 6 (IPv6). While these changes and new features are beneficial, they do somewhat alter how you use System Center to manage and monitor your Windows Server 2008 systems.
As organizations introduce Windows Server 2008 into their production environments, they'll need a way to manage and monitor the health, performance, and availability of these services. Fortunately, you can use existing System Center technologies. System Center Operations Manager 2007 (OpsMgr) recently added support for Windows Server 2008 through the availability of new management packs, and System Center Configuration Manager 2007 (ConfigMgr) added support for Windows Server 2008 with the release of ConfigMgr SP1.
How OpsMgr Works
OpsMgr 2007 monitors and measures the health of Windows Server 2008 and apps on your server using an agent that is installed on the server being monitored. The agent reports data, such as events, alerts, and performance data, to a central server called a management server. The management server then inserts this data into a central SQL Server database. This data can then be rendered in the Operations Console on any workstation (running Windows XP SP2 or a newer version of Windows) or through a Web Console. This architecture is illustrated in Figure 1.

Figure 1 Example Operations Manager 2007 management group topology (Click the image for a larger view)
Once an OpsMgr agent is installed and configured on your servers, discovery of applications and services installed on the servers is automatic. Special monitoring rules, called Object Discoveries, are sent down to the agent by the management server. These rules perform checks on the registry and file system as well as run scripts designed to discover exactly which components are installed. They also identify all the roles the Windows Server 2008 server may be configured for, such as domain controller, print server, Web server, or cluster server.
Object discoveries are configured by default to repeat at regular intervals on the local machine. By repeating these checks on a regular basis, OpsMgr can identify changes in applications and services configured on the server over time. Now I can delve into how OpsMgr 2007 provides visibility into the Windows Server 2008 infrastructure.
Knowledge to Solve Real-World Problems
As mentioned, management packs enable the core monitoring functionality by providing a collection of monitoring rules, tasks, and reports. But while the primary purpose of OpsMgr is to identify little issues before they become big problems, it goes further than just raising an alert when there's a sign of trouble. The management packs actually contain information on probable causes and recommended solutions for many issues the monitoring rules identify. This information is shown in context when you view alerts (see Figure 2), both in the Monitoring space and when viewing the health state of a system using the Health Explorer.
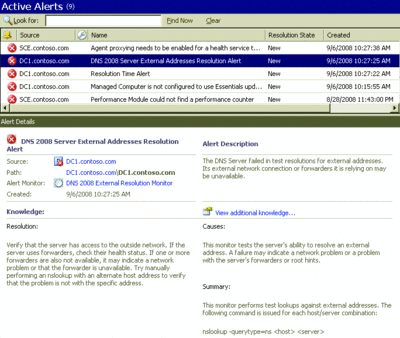
Figure 2 Product knowledge delivered in the Alert view of the operations console (Click the image for a larger view)
In addition to displaying the current health state of systems and apps, the Health Explorer tool also displays a history of changes in system and application health, along with a time stamp for each change. You can actually select the occurrence of any change in the health state and view details related to the change that triggered the condition.
Through special responses called Diagnostics and Recoveries, you can configure OpsMgr to automatically retrieve configuration or environmental data when an issue occurs. You can see in Figure 3 that when a state change event related to a slow response from a Windows 2008 DNS Server is highlighted, the bottom pane displays a list of running processes collected when the change occurred on the server. This data may be the key to figuring out which services were consuming excess resources at that time.
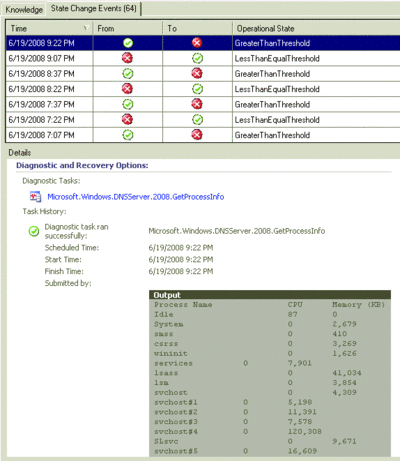
Figure 3 State change events in the OpsMgr Health Explorer (Click the image for a larger view)
Service Availability and Visibility
Windows Server 2008, of course, includes features such as Internet Information Services 7.0 (which can be used to deliver Microsoft .NET Framework-based applications and Web services), as well as features such as failover clustering and network load balancing, to make these services highly available. While clustering and network load balancing have gotten easier to implement and manage in Windows Server 2008, these technologies still add complexity to management tasks. Visibility into the health and performance of these components is vital to ensuring your infrastructure and applications are performing as expected.
OpsMgr addresses this complexity with management packs for the high-availability solutions built into Windows Server 2008. These management packs alone provide hundreds of monitoring rules to ensure the health of each of these components.
When it comes to service monitoring, what counts in the end is that business-critical apps are available from the customer's perspective. A critical Web app designed for your customers may be available on the server but inaccessible externally. OpsMgr offers such features as synthetic transaction and distributed app monitoring to provide service-level visibility into the transactional health and availability of distributed line-of-business apps from an end user perspective.
Using a simple wizard, you can create a synthetic URL monitor to test the availability, response time, and content returned by a Web application. OpsMgr can validate the transactional health of your applications using monitoring features available out of the box. But for true transactional monitoring of more complex Web applications, you can record a browse sequence of browser-based actions to include in the URL monitor, providing a more thorough and realistic test.
To ensure availability from an end user perspective, you can choose one or more computers in different locations on your network (called watcher nodes) to perform the URL test. This is done in the same wizard, as shown Figure 4. To act as a watcher node, the system needs an OpsMgr agent installed.
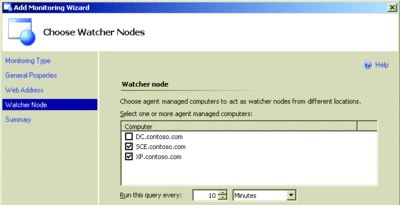
Figure 4 Choosing watcher nodes for synthetic URL monitoring (Click the image for a larger view)
Seeing the Distributed Enterprise
Using the Distributed Application Designer in OpsMgr 2007, administrators can create a model of their distributed application infrastructure (see Figure 5). The designer lets you drag and drop the components of an application into a single view and define dependencies to illustrate how the components relate to one another. It doesn't matter whether you have an IIS 7.0 site or a Windows Server 2008 system running Hyper-V and hosting virtual machines. All the monitored objects can be included in a diagram representing a true picture of your app.
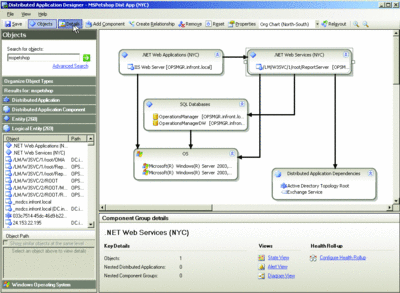
Figure 5 Distributed application modeling in OpsMgr 2007 (Click the image for a larger view)
You can even create custom health algorithms, allowing granular control over what constitutes healthy and unhealthy states in your apps. This feature is useful in configuring how OpsMgr calculates the health of load-balanced components that can sustain multiple failures (such as a Web farm).
Service Level Reporting
The Windows Server 2008 Operating System management pack includes a number of performance reports that can be used to gauge server performance. But that's just the tip of the reporting iceberg. OpsMgr 2007 includes global performance and availability reports (located in the Microsoft Generic Report Library). These allow users with report access to report on the availability of any monitored object in OpsMgr 2007.
This capability can be used to measure application and system performance against IT service delivery objectives. For example, you can use the generic Availability report, shown in Figure 6, to determine the availability of all your Windows Server 2008 instances, server roles, and OS components in your environment with just a couple of clicks. Or you can use the Business Hours feature in report headers to generate Availability reports that only cover the specific time periods during which your apps must be available.
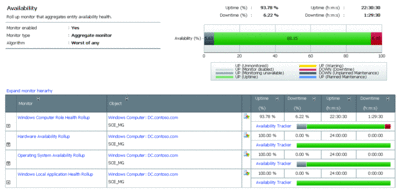
Figure 6 Windows OS availability reporting in OpsMgr 2007 (Click the image for a larger view)
The Service Level Dashboard is a feature that extends reporting functionality and, as a result, allows administrators to configure benchmarks for performance and availability service level agreements (SLAs). You then have the ability to compare this to actual distributed application availability to see how performance stands up to performance and availability goals. The information is displayed in a consolidated dashboard, which is shown in Figure 7.
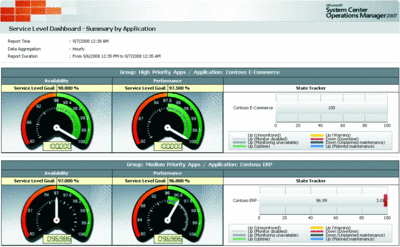
Figure 7 Service Level Dashboard in OpsMgr 2007 (Click the image for a larger view)
Pairing Up in Security and Compliance Auditing
As you surely know, problems with data privacy have led to a number of government-imposed regulations, such as Sarbanes-Oxley (SOX) and Health Insurance Portability and Accountability Act (HIPAA). Aligning corporate security policies with industry best practices is no longer just a good idea—it's the law! The ability to recount and explain what changes occurred on a system are a matter of critical importance, and the failure to do so can cost an organization millions of dollars in fines.
Security auditing in the last few versions of Windows Server was covered by 9 very broad security audit categories, frequently resulting in information overload. Windows Server 2008, however, provides more than 50 audit categories delivered through a new feature called Granular Audit Policy (GAP). This lets you perform security auditing with much greater control, filtering out non-critical information from the event log without losing visibility at the category level. For example, if on a particular system you want to monitor changes only to the Active Directory and not to local items, such as the registry, you can configure the Directory Service audit subcategory to report only these events. You can enable success and/or failure auditing of these changes at the command line like so:
Auditpol /set /subcategory:"Directory Service Changes"
/failure:enable
Even more filtering and reporting on this in a single interface is available in OpsMgr with Audit Collection Services (ACS). This automates collection and centralized archival of distributed Windows Security Event Logs in a single database repository.
The Audit Forwarding Service, which is loaded as part of the OpsMgr agent installation (but disabled by default), will send Security Event Log events to a central server. This central server, which is called an ACS Collector, then inserts the security events into a central audit database hosted on a server running SQL Server 2005. This architecture is illustrated in Figure 8. By forwarding events in nearly real time, the likelihood that local administrators can interfere with Security Log Events is minimized.
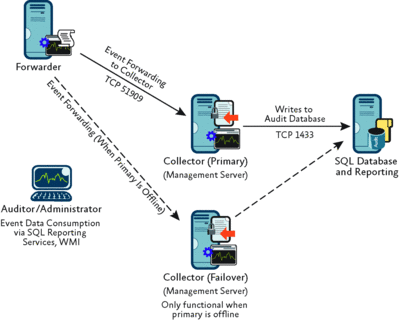
Figure 8 Audit Collection Services architecture (Click the image for a larger view)
Once these events haven been collected, auditors and administrators can then analyze them through nearly 20 reports included with Audit Collection Services (see Figure 9). ACS reports cover a variety of common audit categories, such as account management events, forensic reports targeting user activity, and reports revealing potential threats to your Windows 2008 Security Event Logs (such as attempts by administrators to clear the Security Event Log on a monitored Windows system).
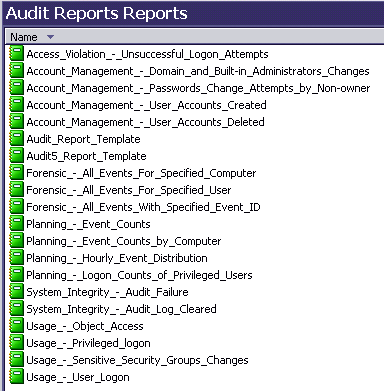
Figure 9 Audit Collection reports in Operations Manager 2007
A Management Pack for Every Application
As part of its commitment to the Dynamic Systems Initiative, Microsoft has vowed to deliver a management pack for every new server application. With so many services available in Windows Server, Microsoft has committed to deliver more than 20 management packs for the Windows Server 2008 platform alone. The list of Windows Server 2008 management packs for OpsMgr 2007 includes those shown in Figure 10.
| 2008 Windows Server Operating System (Base OS) |
|---|
| 2008 Microsoft Cluster Server (MSCS) |
| 2008 Domain Name Service (DNS) |
| 2008 Dynamic Host Configuration Protocol (DHCP) |
| 2008 Internet Information Services (IIS) |
| 2008 Windows Key Management Services (KMS) |
| 2008 Group Policy |
| 2008 Application Server |
| 2008 Print Server |
| 2008 Terminal Services (TS) |
| 2008 DFS-R (Replication) |
| 2008 DFS-N (Namespace) |
| 2008 Active Directory |
| 2008 Network Access Protection (NAP)* |
| 2008 Services for Unix |
| 2008 Network Load Balancing (NLB) |
| 2008 Windows Rights Management Services (RMS) |
| 2008 Windows Deployment Services |
| 2008 Streaming Media Services |
| 2008 Certificate Services |
| 2008 Active Directory Federation Services (ADFS) |
| 2008 AD Lightweight Directory Services (ADLDS) |
| 2008 Hyper-V |
| 2008 Fax Server |
Getting Started
As you can see, Windows Server 2008 and System Center Operations Manager 2007 deliver a solid, enterprise-ready infrastructure to support your most critical business services. With a host of features designed to deliver service-oriented monitoring with integration in all the right places, OpsMgr 2007 allows organizations to take advantage of existing investments in Active Directory, streamline administration, and reduce the total cost of ownership of Windows Server 2008 deployments.
I recommend that you download the 60-day trial version of Windows Server 2008, which is available at microsoft.com/windowsserver2008/en/us/trial-software.aspx. And you can also download a 180-day trial version of Operations Manager 2007 at microsoft.com/technet/opsmgr/2007/downloads/trials/privacy.mspx.
Pete Zerger is a consulting partner with AKOS Technology Services. With nine years of experience in the IT industry, Pete focuses on design and deployment of enterprise operations management, directory services, and messaging solutions.