PerfTips
Applies to: ![]() Visual Studio
Visual Studio ![]() Visual Studio for Mac
Visual Studio for Mac
Note
This article applies to Visual Studio 2017. If you're looking for the latest Visual Studio documentation, see Visual Studio documentation. We recommend upgrading to the latest version of Visual Studio. Download it here
Visual Studio debugger PerfTips and the debugger-integrated Diagnostic Tools help you to monitor and analyze the performance of your app while you are debugging.
Although the debugger-integrated diagnostic tools are a great way of becoming aware of performance issues while you are developing, the debugger can have a significant impact on the performance of your app. To collect more accurate performance data, consider using the tools in the Performance Profiler as an additional part of your performance investigations. See Run profiling tools with or without the debugger.
PerfTips
When the debugger stops execution at a breakpoint or stepping operation, the elapsed time between the break and the previous breakpoint appears as a tip in the editor window. For more information, see PerfTips: Performance Information at-a-glance while Debugging with Visual Studio.

Diagnostics Tools window
Breakpoints and associated timing data gets recorded in the Diagnostic Tools window.
The following illustration shows the Diagnostic Tools window.
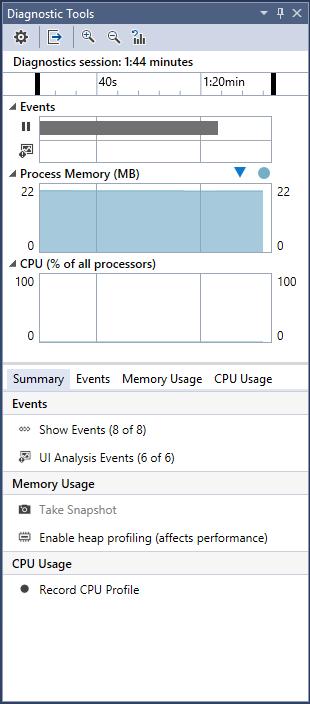
The Break Events timeline mark the breakpoints that were hit in the debugging session. Click on an event to select it the Debugger details list.
The CPU Utilization graph shows the change in CPU use across all processor cores in the debugging session.
The Events list of the Debugger details pane include items for each break event.
The Duration column of a break event displays the elapsed time between the event and the previous breakpoint.
Turn PerfTips on or off
To enable or disable PerfTips:
On the Debug menu, choose Options.
Check or clear Show elapsed PerfTip while debugging.
Turn the Diagnostic Tools window on or off
To enable or disable the Diagnostic Tools window:
On the Debug menu, choose Options.
Check or clear Enable Diagnostics Tools while debugging.