Azure Monitor Logs extension for Azure Data Studio (Preview)
The Azure Monitor Logs extension for Azure Data Studio enables you to connect and query a Log Analytics workspace.
This extension is currently in preview.
Prerequisites
If you don't have an Azure subscription, create a free Azure account before you begin.
The following prerequisites are also required:
Install the Azure Monitor Logs extension
To install the Azure Monitor Logs extension in Azure Data Studio, follow the steps below.
Open the extensions manager in Azure Data Studio. You can either select the extensions icon or select Extensions in the View menu.
Type in Monitor logs in the search bar.
Select the Azure Monitor Logs extension and view its details.
Select Install.
![]()
How to connect to a Log Analytics workspace
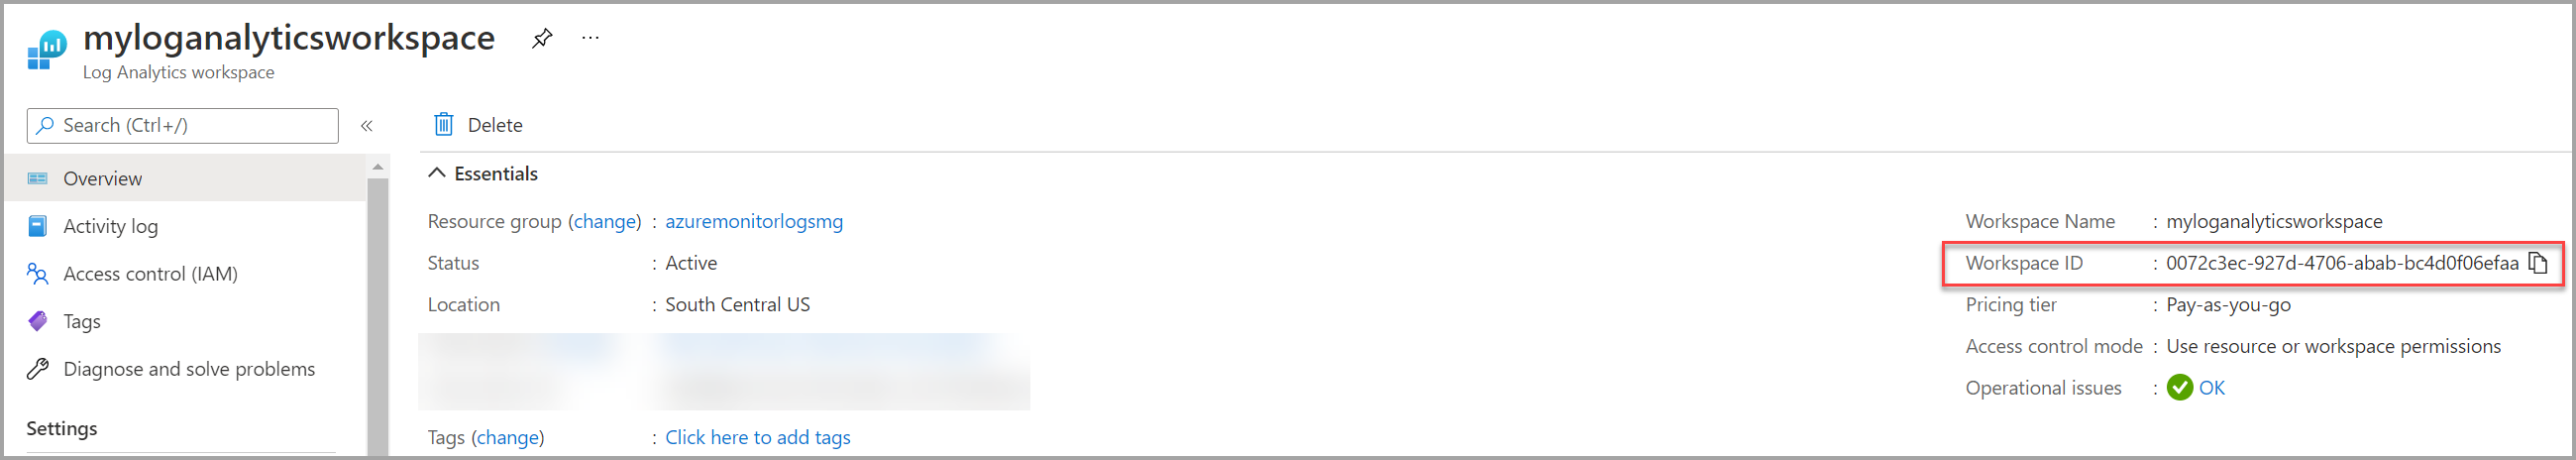
Find your Log Analytics workspace
Find your Log Analytics Workspace in the Azure portal, then find the Workspace ID.
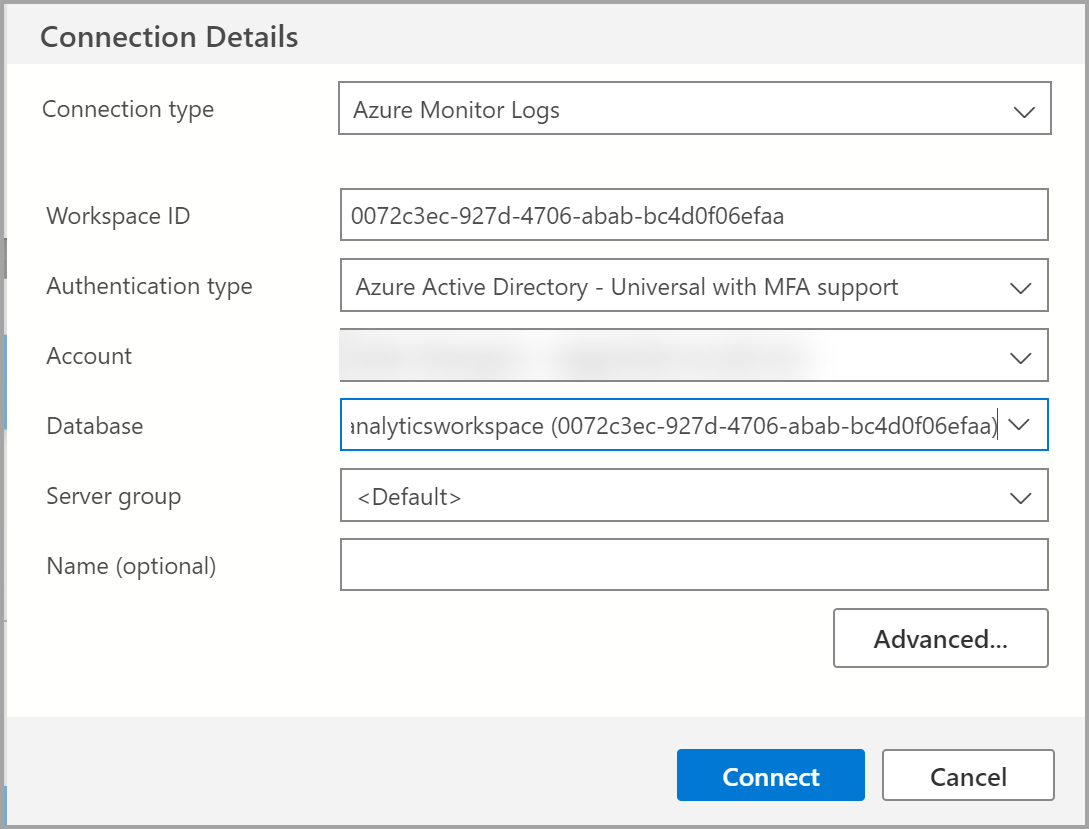
Connection details
To set up an Azure Monitor Log workspace, follow the steps below.
Select New connection from the Connections pane.
Fill in the Connection Details information.
- For Connection type, select Azure Monitor Logs.
- For Workspace ID, enter in your Log Analytics Workspace ID.
- For Authentication type, use the default - Azure Active Directory - Universal with MFA account.
- For Account, use your account information.
- For Database, select the same Workspace ID.
- For Server group, use Default.
- You can use this field to organize your servers in a specific group.
- For Name (optional), leave blank.
- You can use this field to give your server an alias.
How to query a Log Analytics Workspace in Azure Data Studio
Now that you have set up a connection to your Log analytics workspace, you can query the workspace using Kusto (KQL).
To create a new query tab, you can either select File > New Query, use Ctrl + N, or right-click the database and select New Query.
Once you have your new query tab open, then enter your Kusto query.
There are two main tables in Azure Log Analytics (Azure Monitor Logs) workspace that capture Azure SQL events for an Azure SQL database:
To execute the samples below, you must be logged in to an Azure SQL database.
Here are some samples of KQL queries:
AzureDiagnostics
| summarize count() by OperationName
AzureDiagnostics
| where LogicalServerName_s == "<servername>"
| summarize count() by Category
Note
Allow about 15 minutes before the log results appear.
For more information about writing Azure Monitor Logs, visit Azure Monitor documentation
Next steps
Feedback
Coming soon: Throughout 2024 we will be phasing out GitHub Issues as the feedback mechanism for content and replacing it with a new feedback system. For more information see: https://aka.ms/ContentUserFeedback.
Submit and view feedback for