Azure SQL Managed Instance dashboard for Azure Data Studio (Preview)
The Azure SQL Managed Instance extension provides a dashboard for working with an Azure SQL Managed Instance in Azure Data Studio. This extension provides the following features:
- Shows SQL Managed Instance properties, including vCores and used storage
- Monitors CPU and storage usage for previous two hours
- Displays configuration warnings and tuning recommendations
- Shows state of database replicas
- Displays filtered error logs
Install
You can install the official release of this extension. Follow the steps in the Azure Data Studio documentation. In the Extensions pane, search for "Managed Instance", and install it there. After it's installed, you'll get notified automatically about any future extension updates.
With the extension installed, you'll see a Managed Instance tab in Azure Data Studio. Here you can find information specific for your managed instance.
Properties
The extension displays technical characteristics and some resource usage of your managed instance.
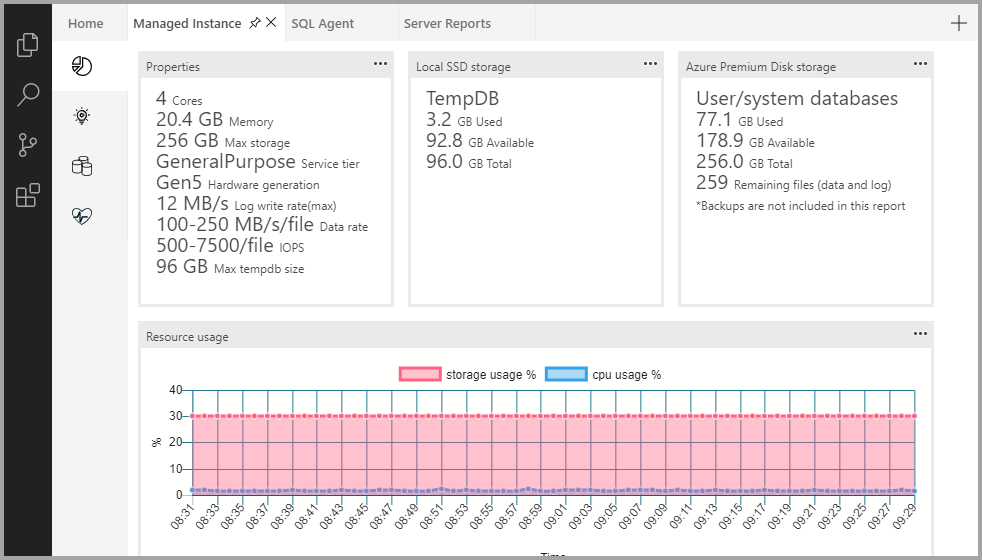
The top pane shows the following details:
- Properties. Get basic information about your managed instance, including available vCores, memory, and storage. Also find your current service tier, hardware generation, and IO characteristics such as instance log write throughput or file I/O throughput characteristics.
- Local SSD storage. On the general-purpose service tier, TempDB files are stored locally. On the business-critical service tier, all database files are placed on local SSD storage. In this section, you can see how much space on the local storage is used by your managed instance.
- Azure Premium Disk Storage. If you have the general-purpose service tier, both user and system database files are placed on Azure Premium storage. In this section, you can see the amount of data used, the number of files, and the available storage. On the business-critical service tier, this section is empty.
- Resource usage. View the percentage of storage and CPU that your managed instance used over the previous two hours. This way, you can increase the instance size if it's nearing the limit.
Recommendations
When you select the second pane in the Managed Instance tab, you get recommendations and alerts to help optimize your managed instance.
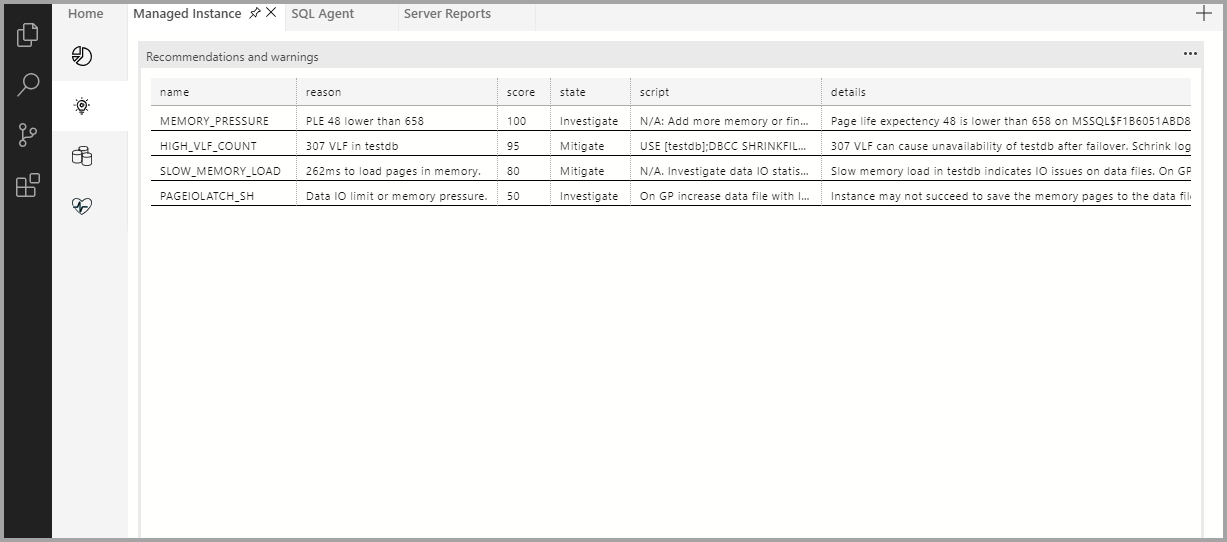
You might see some of the following recommendations:
- Reaching storage space limit. Either delete unnecessary data or increase instance storage size. Databases that reach storage limit might fail to process even read queries.
- Reaching instance throughput limit. Notifies you when you're loading near the limit of your service tier: 22 MB/s for general-purpose or 48 MB/s for business-critical. Be aware that your managed instance will limit your load to ensure that backups can be taken.
- Memory pressure. Low page life expectancy or numerous
PAGEIOLATCHwait statistics might indicate that your instance is evicting pages from the memory and constantly trying to load more pages from disk. - Log file limits. If your log files approach the file I/O limits on the general-purpose service tier, you might need to increase the log file size to get better performance.
- Data file limits. If your data files approach the file I/O limits on the general-purpose service tier, you might need to increase file size to get better performance. This issue might cause memory pressure and slow down backups.
- Availability issues. A high number of virtual log files can affect performance. If there's a process failure, such issues might result in longer database recovery on the general-purpose service tier.
Periodically review these recommendations, investigate the root causes, and take action to correct any issues. The SQL Managed Instance extension provides scripts you can run to mitigate some of the reported issues.
Replicas
The third pane in the Managed Instance tab shows you the state of database replicas in your managed instance.
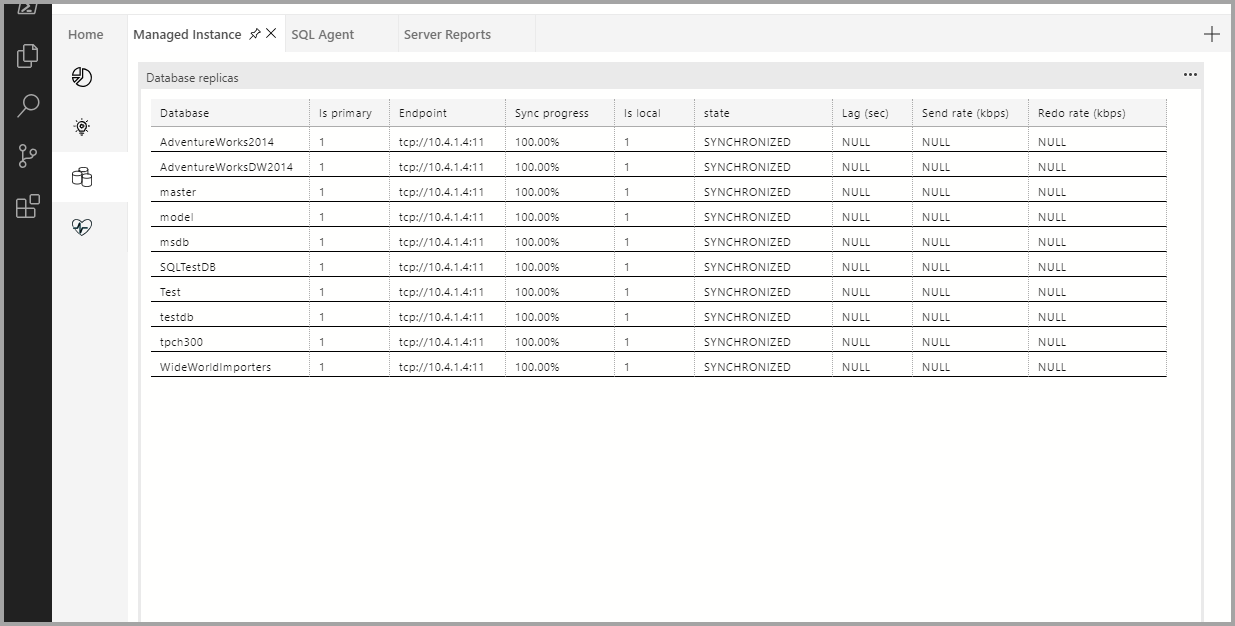
On the general-purpose service tier, every database has a single (primary) replica. On a business-critical tier instance, every database has one primary and three secondary replicas, one of which is used for read-only workloads. On the Replicas pane, you can monitor the synchronization process and verify that all secondary replicas are synchronized with the primary replica.
Logs
The fourth pane of Managed Instance shows the most recent and relevant SQL error log entries.
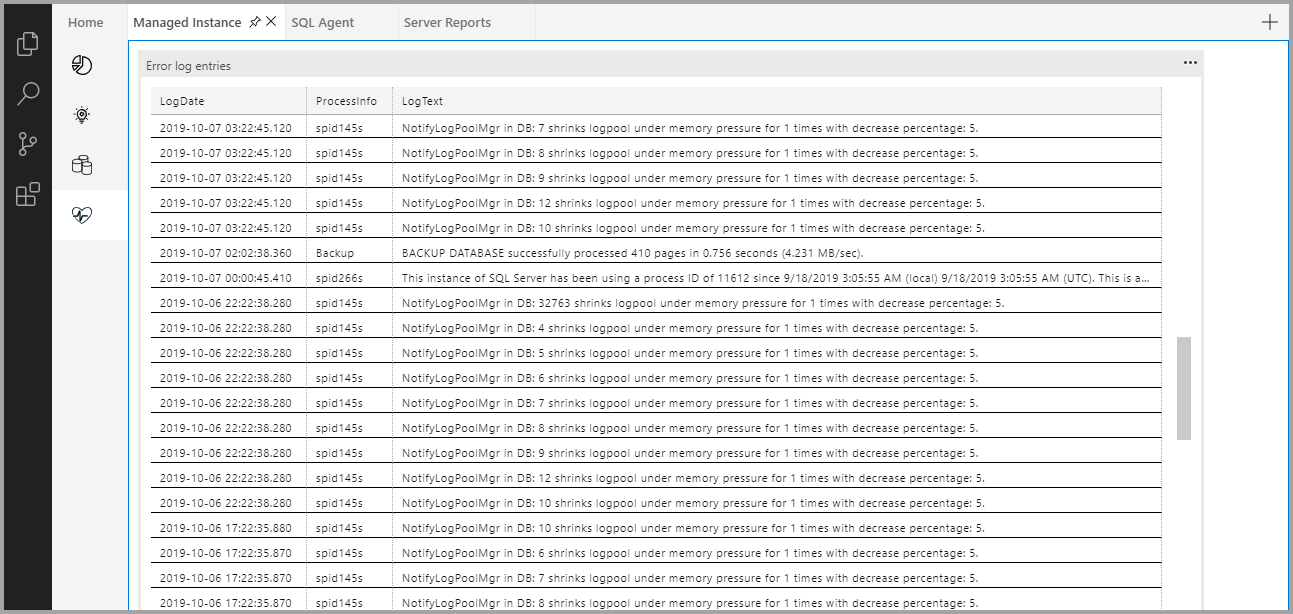
Although your managed instance generates a large number of log entries, most of them are internal/system information. Also, some log entries show physical database names (GUID values) instead of actual logical database names.
The SQL Managed Instance extension filters out unnecessary log entries based on the Dimitri Furman method. The extension also displays actual logical file names instead of physical names.
Reporting problems
If you experience any problems with the SQL Managed Instance extension, go to the Extension GitHub project and report your issue.
Code of conduct
This project has adopted the Microsoft Open Source Code of Conduct.
For more information, see the Code of Conduct FAQ or contact opencode@microsoft.com with any additional questions or comments.
Next steps
For more information, visit the GitHub project.
Feedback
Coming soon: Throughout 2024 we will be phasing out GitHub Issues as the feedback mechanism for content and replacing it with a new feedback system. For more information see: https://aka.ms/ContentUserFeedback.
Submit and view feedback for