Events
Mar 31, 11 PM - Apr 2, 11 PM
The biggest SQL, Fabric and Power BI learning event. March 31 – April 2. Use code FABINSIDER to save $400.
Register todayThis browser is no longer supported.
Upgrade to Microsoft Edge to take advantage of the latest features, security updates, and technical support.
Applies to:
SQL Server
Azure SQL Managed Instance
SQL Server Management Studio version 17.2 and later includes the Performance Dashboard. This dashboard was designed to visually provide fast insight into the performance state of SQL Server (Starting with SQL Server 2008 (10.0.x)) and Azure SQL Database Managed Instance.
The Performance Dashboard helps to quickly identify whether SQL Server or Azure SQL Database is experiencing a performance bottleneck. And if a bottleneck is found, easily capture additional diagnostic data that may be necessary to resolve the problem. Some common performance problems which the Performance Dashboard can help identify include:
The Performance Dashboard also helps to identify expensive queries that may have been executed before, and several metrics are available to define high cost: CPU, Logical Writes, Logical Reads, Duration, Physical Reads, and CLR Time.
The Performance dashboard is divided into the following sections and sub-reports:
Note
Internally, the Performance Dashboard uses Execution, Index, and I/O related Dynamic Management Views (DMVs) and Functions (DMFs).
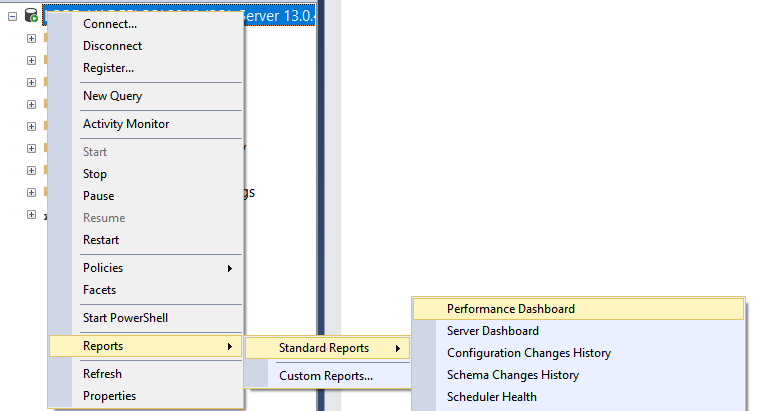
To view the Performance Dashboard, right-click on the SQL Server instance name in Object Explorer, select Reports, Standard Reports, and click on Performance Dashboard.

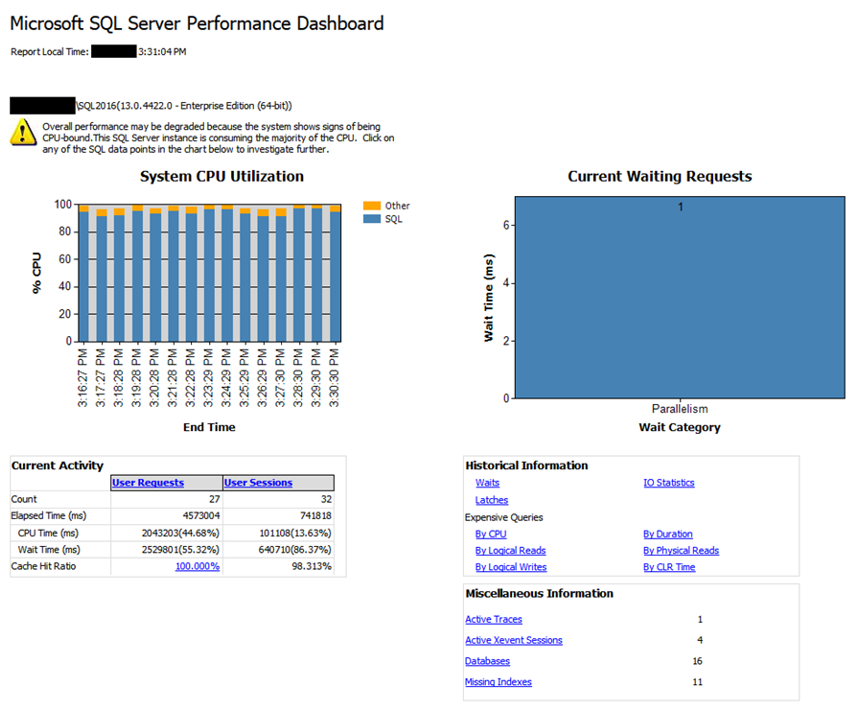
The Performance Dashboard will appear as a new tab. Below is an example where a CPU bottleneck is clearly present:

The Missing Indexes report shows potentially missing indexes that the Query Optimizer identified during query compilation. However, these recommendations should not be taken at face value. Microsoft recommends that indexes with a score greater than 100,000 should be evaluated for creation, as those have the highest anticipated improvement for user queries.
Tip
Always evaluate if a new index suggestion is comparable to an existing index in the same table, where the same practical results can be achieved simply by changing an existing index instead of creating a new index. For example, given a new suggested index on columns C1, C2 and C3, first evaluate if there is an existing index over columns C1 and C2. If so, then it may be preferable to simply add column C3 to the existing index (preserving the order of pre-existing columns) to avoid creating a new index. For more information, see the Index Architecture and Design Guide.
The Waits report filters out all idle and sleep waits. For more information about waits, see sys.dm_os_wait_stats (Transact-SQL) and SQL Server 2005 Performance Tuning Using Waits and Queues.
The Expensive Queries reports are reset when SQL Server restarts because the data in the underlying DMVs is cleared. Starting with SQL Server 2016 (13.x), detailed information about expensive queries can be found in the Query Store.
Note
While the SQL Server Management Studio report renderer does not support clipboard access to text contained in the reports, the text can be accessed via the standalone reports. Download the standlone reports if you need to copy query text from the reports.
On SQL Server, requires VIEW SERVER STATE and ALTER TRACE permissions.
On Azure SQL Database, requires the VIEW DATABASE STATE permission in the database.
Monitor and Tune for Performance
Performance Monitoring and Tuning Tools
Open Activity Monitor (SQL Server Management Studio)
Activity Monitor
Monitoring Performance By Using the Query Store
Events
Mar 31, 11 PM - Apr 2, 11 PM
The biggest SQL, Fabric and Power BI learning event. March 31 – April 2. Use code FABINSIDER to save $400.
Register todayTraining
Certification
Microsoft Certified: Azure Database Administrator Associate - Certifications
Administer an SQL Server database infrastructure for cloud, on-premises and hybrid relational databases using the Microsoft PaaS relational database offerings.