Tutorial: Add a parameter to your report (Report Builder)
In this tutorial, you add a parameter to a Reporting Services paginated report so report readers can filter report data for one or more values.
Report parameters are created automatically for each query parameter that you include in a dataset query. The parameter data type determines how it appears on the report view toolbar.
Note
In this tutorial, the steps for the wizard are consolidated into one procedure. For step-by-step instructions about how to browse to a report server, choose a data source, and create a dataset, see the first tutorial in this series: Tutorial: Create a basic table report (Report Builder).
Estimated time to complete this tutorial: 25 minutes.
Requirements
For information about requirements, see Prerequisites for tutorials (Report Builder).
1. Create a matrix report and dataset in the table or Matrix Wizard
Create a matrix report, a data source, and a dataset.
Note
In this tutorial, the query contains the data values, so that it doesn't need an external data source. This makes the query quite long. In a business environment, a query wouldn't contain the data. This is for learning purposes only.
Create a new matrix report
Start Report Builder either from your computer, the Reporting Services web portal, or SharePoint integrated mode.
The New Report or Dataset dialog box opens.
If you don't see the New Report or Dataset dialog box, on the File menu > New.
In the left pane, make sure New Report is selected.
In the right pane, select Table or Matrix Wizard.
On the Choose a dataset page, select Create a dataset > Next.
On the Choose a connection to a data source page, select a data source from the list, or browse to the report server to select one. Select any data source that is type SQL Server.
Select Next.
You might need to enter your credentials.
On the Design a query page, select Edit as Text.
Paste the following query into the empty pane at the top:
;WITH CTE (StoreID, Subcategory, Quantity)
AS (
SELECT 200 AS StoreID, 'Digital SLR Cameras' AS Subcategory, 2002 AS Quantity
UNION SELECT  200 AS StoreID, 'Camcorders' AS Subcategory, 1954 AS Quantity
UNION SELECT  200 AS StoreID, 'Accessories' AS Subcategory, 1895 AS Quantity
UNION SELECT  199 AS StoreID, 'Digital Cameras' AS Subcategory, 1849 AS Quantity
UNION SELECT  306 AS StoreID, 'Digital SLR Cameras' AS Subcategory, 1579 AS Quantity
UNION SELECT  306 AS StoreID, 'Camcorders' AS Subcategory, 1561 AS Quantity
UNION SELECT  306 AS StoreID, 'Digital Cameras' AS Subcategory, 1553 AS Quantity
UNION SELECT  306 AS StoreID, 'Accessories' AS Subcategory, 1534 AS Quantity
UNION SELECT 307 AS StoreID, 'Accessories' AS Subcategory, 1755 AS Quantity
UNION SELECT 307 AS StoreID, 'Camcorders' AS Subcategory, 1631 AS Quantity
UNION SELECT 307 AS StoreID, 'Digital SLR Cameras' AS Subcategory, 1772 AS Quantity)
SELECT StoreID, Subcategory, Quantity
FROM CTE
This query combines the results of several Transact-SQL SELECT statements inside a common table expression to specify values that are based on simplified sales data for cameras from the Contoso sample database. The subcategories are digital cameras, digital single lens reflex (SLR) cameras, camcorders, and accessories.
On the query designer toolbar, select Run (!) to see the data.
The result set consists of 11 rows of data that show the quantity of items sold for each subcategory for four stores, in the following columns: StoreID, Subcategory, Quantity. The store name isn't part of the result set. Later in this tutorial, you look up the name of the store that corresponds to the store identifier from a separate dataset.
This query doesn't contain query parameters. You add query parameters later in this tutorial.
Select Next.
2. Organize data and choose layout in the wizard
The wizard provides a starting design for displaying data. The preview pane in the wizard helps you to visualize the result of grouping data before you complete the table or matrix design.
Organize data into groups
On the Arrange fields page, drag Subcategory to Row groups.
Drag StoreID to Column groups.
Drag Quantity to Values.
You organized the quantity sold values in rows grouped by subcategory, with one column for each store.
Select Next.
On the Choose the Layout page, under Options, make sure Show subtotals and grand totals is selected.
When you run the report, the last column shows the total quantity of each subcategory for all stores, and the last row shows the total quantity for all subcategories for each store.
Select Next.
Select Finish.
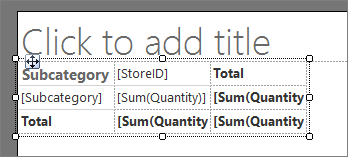
The matrix is added to the design surface. The matrix displays three columns and three rows. The contents of the cells in the first row are Subcategory, [StoreID], and Total. The contents of the cells in the second row contain expressions that represent the subcategory, the quantity of items sold for each store, and the total quantity for each subcategory for all stores. The cells in the final row display the grand total for each store.
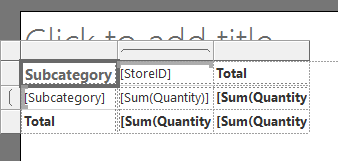
Select in the matrix, hover over the edge of the first column, grab the handle, and expand the column width.
Select Run to preview the report.
The report runs on the report server and displays the title and the time the report processing occurred.
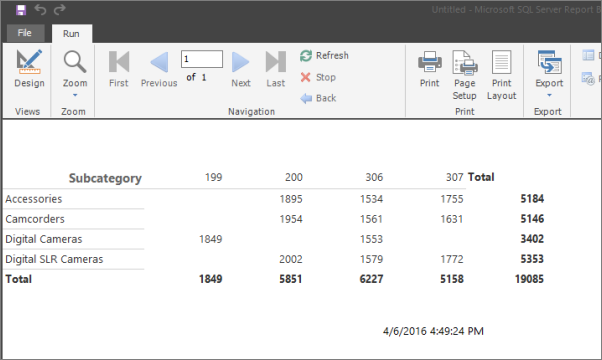
So far the column headings display the store identifier but not the store name. Later, you add an expression to look up the store name in a dataset that contains store identifier/store name pairs.
3. Add a query parameter to create a report parameter
When you add a query parameter to a query, Report Builder automatically creates a single-valued report parameter with default properties for name, prompt, and data type.
Add a query parameter
Select Design to switch back to Design view.
In the Report Data pane, expand the Datasets folder, right-click DataSet1, and then select Query.
Add the following Transact-SQL WHERE clause as the last line in the query:
WHERE StoreID = (@StoreID)The WHERE clause limits the retrieved data to the store identifier that is specified by the query parameter @StoreID.
On the query designer toolbar, select Run (!). The Define Query Parameters dialog box opens and prompts for a value for the query parameter @StoreID.
In Parameter Value, enter 200.
Select OK.
The result set displays the quantities sold for Accessories, Camcorders, and Digital SLR Cameras for the store identifier 200.
Select OK.
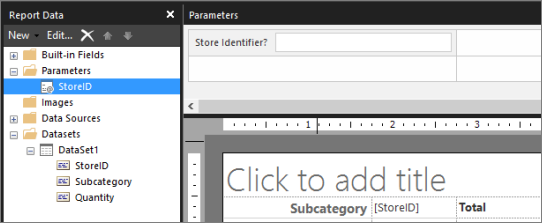
In the Report Data pane, expand the Parameters folder.
There's now a report parameter named @StoreID, and a Parameters pane where you can lay out the report parameters.
Don't see a Parameters pane? On the View menu, select Parameters.
4. Change default data type and other properties for a report parameter
After you create a report parameter, you can adjust the default values for properties.
Change the default data type for a report parameter
By default, the parameter you created has the data type Text. Because the store identifier is an integer, you can change the data type to Integer.
In the Report Data pane under the Parameters node, right-click @StoreID, then select Parameter Properties.
In Prompt, enter Store identifier? This text appears on the report viewer toolbar when you run the report.
In Data type, from the drop-down list, select Integer.
Accept the remaining default values in the dialog box.
Select OK.
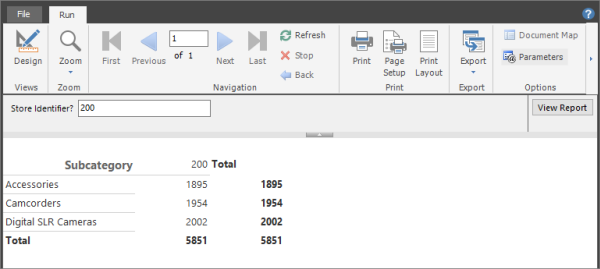
Select Run to preview the report. The report viewer displays the prompt Store Identifier? for @StoreID.
On the report viewer toolbar, next to Store ID, enter 200, and then select View Report.
4a. Add a dataset to provide available values and display names
To make sure your report readers type only valid values for a parameter, you can create a drop-down list of values to choose from. The values can come from a dataset or from a list that you specify. Available values must be supplied from a dataset with a query that doesn't contain a reference to the parameter.
Create a dataset for valid values for a parameter
Select Design to switch to Design view.
In the Report Data pane, right-click the Datasets folder, and then select Add Dataset.
In Name, enter Stores.
Select Use a dataset embedded in my report.
In Data source, from the drop-down list, choose the data source you used in the first procedure.
In Query type, verify that Text is selected.
In Query, paste the following text:
SELECT 200 AS StoreID, 'Contoso Catalog Store' as StoreName
UNION SELECT 199 AS StoreID, 'Contoso North America Online Store' as StoreName
UNION SELECT 307 AS StoreID, 'Contoso Asia Online Store' as StoreName
UNION SELECT 306 AS StoreID, 'Contoso Europe Online Store' as StoreName
Select OK.
The Report Data pane displays the fields StoreID and StoreName under the Stores dataset node.
4b. Specify available values to show in a list
After you create a dataset to provide available values, you change the report properties to specify which dataset and which field to use to populate the drop-down list of valid values on the Report Viewer toolbar.
Provide available values for a parameter from a dataset
In the Report Data pane, right-click the parameter @StoreID, then select Parameter Properties.
Select Available Values, and then choose Get values from a query.
In Dataset, from the drop-down list, select Stores.
In Value field, from the drop-down list, select StoreID.
In Label field, from the drop-down list, select StoreName. The label field specifies the display name for the value.
Select General.
In Prompt, change Store Identifier? to Store name?
Report readers now select from a list of store names instead of store identifiers. The parameter data type remains Integer because the parameter is based on the store identifier, not the store name.
Select OK.
Preview the report.
In the report viewer toolbar, the parameter text box is now a drop-down list that displays Select a Value.
From the drop-down list, select Contoso Catalog Store, then choose View Report.
The report displays the quantity sold for Accessories, Camcorders, and Digital SLR Cameras for the store identifier 200.
4c. Specify a default value
You can specify a default value for each parameter so the report runs automatically.
Specify a default value from a dataset
Switch to Design view.
In the Report Data pane, right-click @StoreID, then select Parameter Properties.
Select Default Values, then choose Get values from a query.
In Dataset, from the drop-down list, select Stores.
In Value field, from the drop-down list, select StoreID.
Select OK.
Preview the report.
For @StoreID, the report viewer displays the value "Contoso North America Online Store" because it's the first value from the result set for the dataset Stores. The report displays the quantity sold for Digital Cameras for store identifier 199.
Specify a custom default value
Switch to Design view.
In the Report Data pane, right-click @StoreID, and then select Parameter Properties.
Select Default Values > Specify values > Add. A new value row is added.
In Value, enter 200.
Select OK.
Preview the report.
For @StoreID, the report viewer displays "Contoso Catalog Store" because it's the display name for store identifier 200. The report displays the quantity sold for Accessories, Camcorders, and Digital SLR Cameras for the store identifier 200.
4d. Look up a name/value pair
A dataset might contain both the identifier and the corresponding name field. When you only have an identifier, you can look up the corresponding name in a dataset that you created that includes name/value pairs.
Look up a value from a dataset
Switch to Design view.
On the design surface, in the matrix, in the first row column header, right-click
[StoreID]and then select Expression.In the expression pane, delete all text except the beginning equals sign (=).
In Category, expand Common Functions, and select Miscellaneous. The Item pane displays a set of functions.
In Item, double-click Lookup. The expression pane displays
=Lookup(. The Example pane displays an example of Lookup syntax.Enter the following expression:
=Lookup(Fields!StoreID.Value,Fields!StoreID.Value,Fields!StoreName.Value,"Stores")The Lookup function takes the value for StoreID, looks it up in the "Stores" dataset, and returns the StoreName value.
Select OK.
The store column header contains the display text for a complex expression: Expr.
Preview the report.
The column header at the top of each column displays the store name instead of the store identifier.
5. Display the selected parameter value in the report
When your report readers have questions about a report, it helps to know which parameter values they chose. You can preserve user-selected values for each parameter in the report. One way is to display the parameters in a text box in the page footer.
Display the selected parameter value and label on a page footer
Switch to Design view.
Right-click the page footer > Insert > Text Box. Drag the text box next to the text box with the time stamp. Grab the side handle of the text box and expand the width.
From the Report Data pane, drag the parameter @StoreID to the text box. The text box displays
[@StoreID].To display the parameter label, select in the text box until the insert cursor appears after the existing expression. Enter a space, and then drag another copy of the parameter from the Report Data pane to the text box. The text box displays
[@StoreID] [@StoreID].Right-click the first
[@StoreID]and select Expression. The Expression dialog box opens. Replace the textValuewithLabel.Select OK.
The text displays:
[@StoreID.Label] [@StoreID].Preview the report.
6. Use the report parameter in a filter
Filters help control which data to use in a report after it comes from an external data source. To let report readers control the data they want to see, you can include the report parameter in a filter for the matrix.
Specify a parameter in a matrix filter
Switch to Design view.
Right-click a row or column header handle on the matrix, and then select Tablix Properties.
Select Filters, and then choose Add. A new filter row appears.
In Expression, from the drop-down list, select the dataset field StoreID. The data type displays Integer. When the expression value is a dataset field, the data type is set automatically.
In Operator, verify that the equals sign (=) is selected.
In Value, enter
[@StoreID].[@StoreID]is the simple expression syntax that represents=Parameters!StoreID.Value.Select OK.
Preview the report.
The matrix displays data only for "Contoso Catalog Store".
On the report viewer toolbar, for Store name?, select Contoso Asia Online Store, and then choose View Report.
The matrix displays data that corresponds to the store that you selected.
7. Change the report parameter to accept multiple values
To change a parameter from single to multivalued, you must change the query and all expressions that contain a reference to the parameter, including filters. A multivalued parameter is an array of values. In a dataset query, query syntax must test for inclusion of one value in a set of values. In a report expression, expression syntax must access an array of values instead of an individual value.
Change a parameter from single to multivalued
Switch to Design view.
In the Report Data pane, right-click @StoreID, and then select Parameter Properties.
Select Allow multiple values.
Select OK.
In the Report Data pane, expand the Datasets folder, right-click DataSet1, and then select Query.
Change the equals sign (=) to IN in the Transact-SQL WHERE clause in the last line in the query:
WHERE StoreID IN (@StoreID)The IN operator tests a value for inclusion in a set of values.
Select OK.
Right-click a row or column header handle on the matrix, and then select Tablix Properties.
Select Filters.
In Operator, select In.
Select OK.
In the text box that displays the parameter in the page footer, delete all text.
Right-click the text box, and then select Expression. Enter the following expression:
=Join(Parameters!StoreID.Label, ", ")This expression concatenates all store names that the user selected, separated by a comma and a space.
Select OK.
Select in the text box in front of the expression that you created, and then enter the following text:
Parameter Values Selected:
Preview the report.
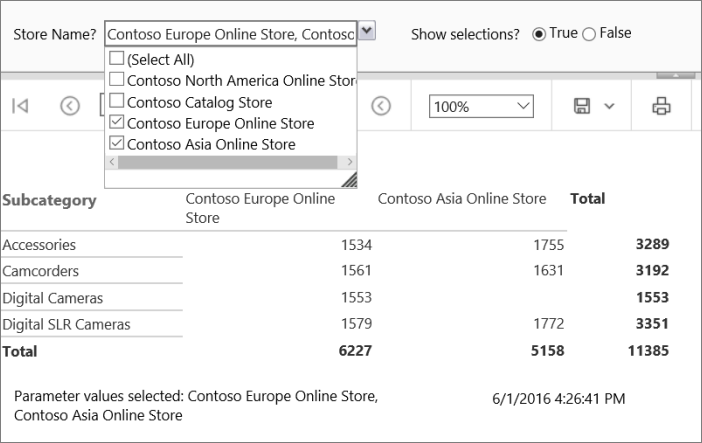
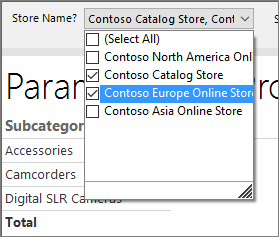
Select the drop-down list next to Store Name?
Each valid value appears next to a check box.
Select Select All, and then choose View Report.
The report displays the quantity sold for all subcategories for all stores.
From the drop-down list, select Select All to clear the list, choose "Contoso Catalog Store" and "Contoso Asia Online Store", and then choose View Report.
8. Add a Boolean parameter for conditional visibility
Add a Boolean parameter
On the design surface, in the Report Data pane, right-click Parameters, and select Add Parameter.
In Name, enter ShowSelections.
In Prompt, enter Show selections?
In Data type, select Boolean.
Select Default Values.
Select Specify value, and then choose Add.
In Value, enter False.
Select OK.
Set visibility based on a Boolean parameter
On the design surface, right-click the text box in the page footer that displays the parameter values, and then select Text Box Properties.
Select Visibility.
Select the option Show or hide based on an expression, and then select the expression button Fx.
Enter the following expression:
=Not Parameters!ShowSelections.ValueThe property Hidden controls the text box Visibility option. Apply the Not operator so that when the parameter is selected, the Hidden property is false, and the text box displays.
Select OK.
Select OK.
Preview the report.
The text box that displays the parameter choices in the footer doesn't appear.
In the report viewer toolbar, next to Show selections, select True > View Report.
The text box in the page footer appears, showing all the store names you selected.
9. Add a report title
Add a report title
Switch to Design view.
On the design surface, select Click to add title.
Enter Parameterized Product Sales, and then select outside the text box.
10. Save the report
Save the report on a report server
From the Report Builder button, select Save As.
Select Recent Sites and Servers.
Select or enter the name of the report server where you have permission to save reports.
The message Connecting to report server appears. When the connection is complete, you see the contents of the report folder that the report server administrator specified as the default location for reports.
In Name, replace the default name with Parameterized Sales Report.
Select Save.
The report is saved to the report server. The report server that you're connected to appears in the status bar at the bottom of the window.
Next step
You finished the tutorial for how to add a parameter to your report. For more information about parameters, see Paginated report parameters (Report Builder).
Related content
Feedback
Coming soon: Throughout 2024 we will be phasing out GitHub Issues as the feedback mechanism for content and replacing it with a new feedback system. For more information see: https://aka.ms/ContentUserFeedback.
Submit and view feedback for