Work with KPIs in Reporting Services
Applies to: ✅ SQL Server 2016 (13.x) Reporting Services and later ✅ Power BI Report Server
A Key Performance Indicator (KPI) is a visual cue that communicates the amount of progress made toward a goal. Key Performance Indicators are valuable for teams, managers, and businesses to evaluate quickly the progress made against measurable goals.
By using KPIs in Power BI Report Server or SQL Server Reporting Services, you can easily visualize answers to the following questions:
- What am I ahead or behind on?
- How far ahead or behind am I?
- What minimum amounts did I complete?
Note
KPIs are only accessible in Power BI Report Server and the Enterprise (Developer) editions of the Reporting Services portal.
Create a dataset
A KPI only uses the first row of data from a shared dataset. Make sure that the data you want to use is located on that first row. To create a shared dataset, you can use either Report Builder or SQL Server Data Tools.
Note: The Dataset does not need to be in the same folder as the KPI.
Placement of KPIs
KPIs can be created in any folder in your report server. Before you create a KPI, you want to think about where is the right location to place it in. You can place it in a folder that is visible to the users, at the same time being relevant to other reports, and KPIs, around it.
Add a KPI
After you determine the location of your KPI, go to that folder and select New > KPI from the top menu.
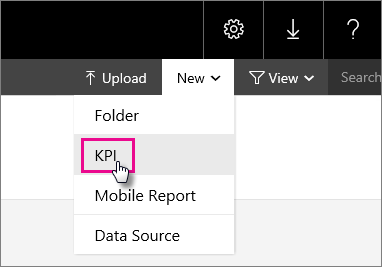
The New KPI screen opens.

You can either assign static values, or use data from a shared dataset. When you create a new KPI, it's populated with a random set of manual data.
| Field | Description |
|---|---|
| Value format | Used to change the format of the value being displayed. |
| Value | The value to display for the KPI. |
| Goal | Used as a comparison to a numeric value and shown as a percent difference. |
| Status | Numerical value used to determine the KPI Tile color. Valid values are 1 (green), 0 (amber) and -1 (red). |
| Trend set | Comma-separated numeric values used for chart visualization. It can also be set to a column of a dataset with values that represent the trend. |
| Related content | The ability to set a drill-through link. This link can either be a mobile report published on the portal or a custom URL. |
Warning: While you can use the word value for the Status field at design time, you should use the number value if refreshing a dataset. If you refresh a dataset with the word value, instead of the number, it could corrupt the KPIs on your server.
Note: The Value, Goal and Status fields can only choose a value from the first row of a dataset's result. The Trend set field, however, can choose which column reflects the trend.
To use data from a shared dataset, you can do the following steps.
Change the fields drop down box from Set manually, or Not set, to Dataset field.
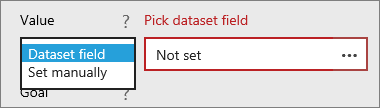
Select More options (...) in the data box to open the Pick a Dataset screen.
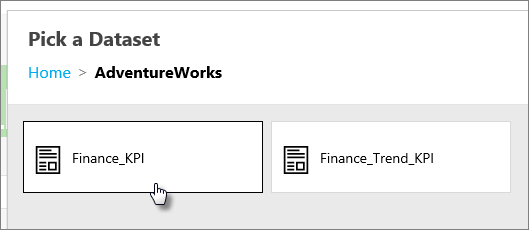
Select the dataset that has the data you want to display.
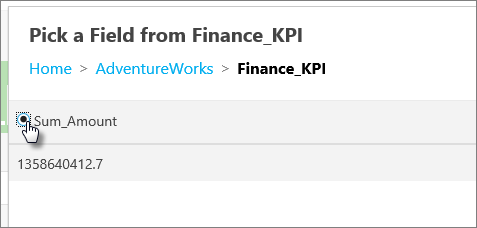
Choose the field you want to use. Select OK.
Change Value format to match the format of your value. In this example, the value is a currency.
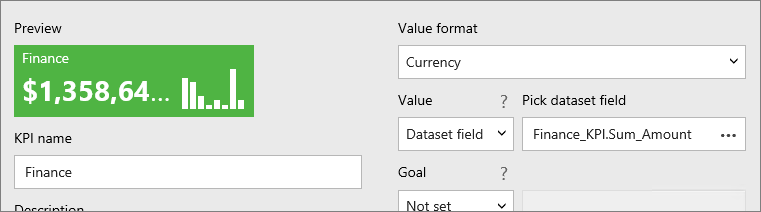
Select Apply.
Configure related content
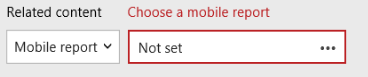
When you choose Mobile Report, you can choose the destination in a dialog.
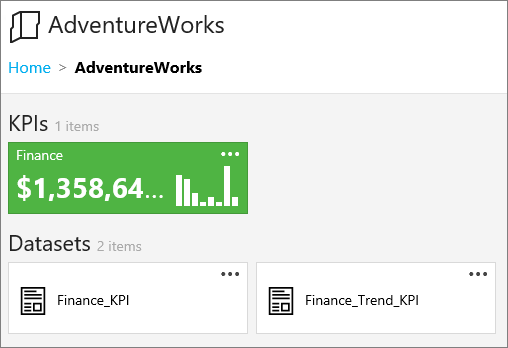
When you now select the KPI in the portal, a thumbnail of the mobile report shows under the related content dropdown. Selecting this thumbnail can directly navigate you to this report.
You can also specify a custom URL. This task can be anything: a website, a SharePoint site, a URL to an SSRS report (which would allow you to pass along hardcoded parameters).
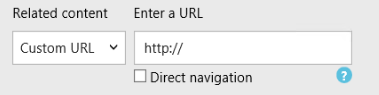
When you now select the KPI, the URL shows under related content.
It's only possible to add one mobile report or one custom URL.
Set up a cache refresh plan for a KPI
You need to set up a cache refresh plan for the shared dataset that your KPI is based on. Otherwise, the KPI data doesn't refresh. The Caching section of the Work with Shared Datasets article explains how to set up cache refresh plans.
Remove a KPI
To remove a KPI, you can do the following steps.
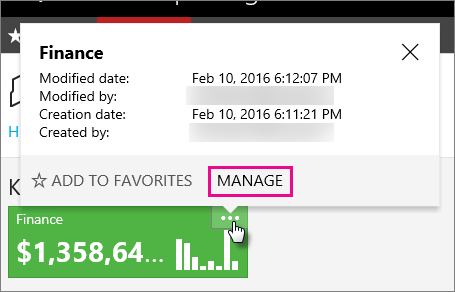
Select the ellipsis (...) of the KPI you want to remove. Choose Manage.
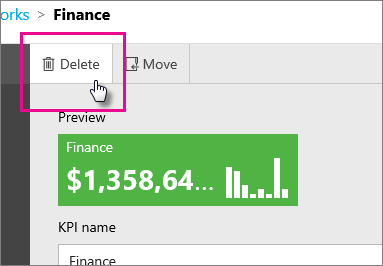
Select Delete. Choose Delete again on the confirmation dialog.
Related content
More questions? Try asking the Reporting Services forum.
Feedback
Coming soon: Throughout 2024 we will be phasing out GitHub Issues as the feedback mechanism for content and replacing it with a new feedback system. For more information see: https://aka.ms/ContentUserFeedback.
Submit and view feedback for