Viewing active alerts and details
Important
This version of Operations Manager has reached the end of support. We recommend you to upgrade to Operations Manager 2022.
In the Operations Manager console, alerts matching a specific criteria and related to an object or group of objects are presented in an alerts view. From this view, you can review alerts that have been generated by rules and monitors which are still active and haven't been closed automatically or manually by an operator.
Viewing active alerts
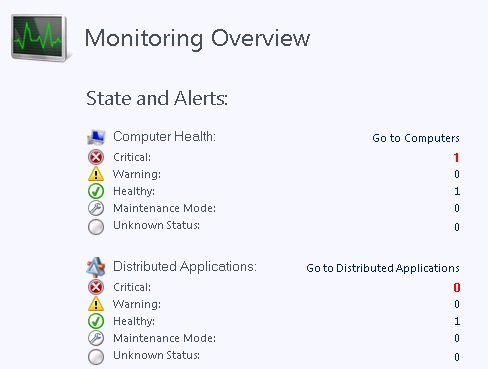
To view active alerts, open the Operations console and select Monitoring. The Monitoring Overview displays a summary of health states and alerts:
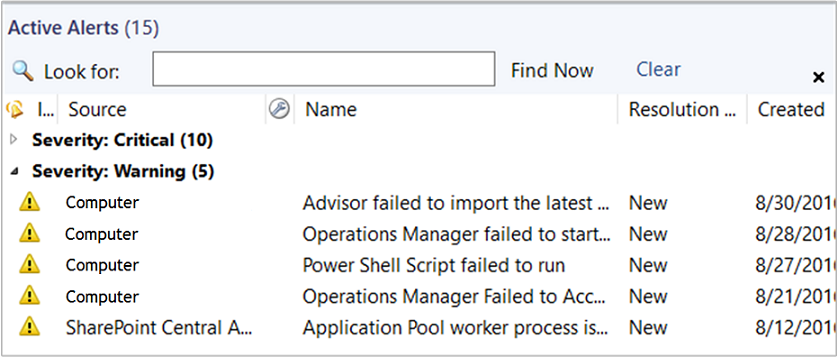
To view the actual alerts, select Active Alerts in the navigation pane.
Tip
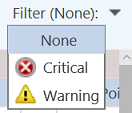
If you're using the web console, you can filter the view of alerts by severity:
The list of alerts in the Results pane includes the severity, source, maintenance mode status, name, resolution state, and when the alert was created:
The list of alerts in the Results pane includes the severity, source, maintenance mode status, name, resolution state, Alert source, and when the alert was created:
With Operations Manager 2022, you can view the source of the alert if you had selected the view source option while creating the alert.
You can also sort and group the alerts by Monitor/Rule.
The following folders in the Monitoring workspace include a standard Active Alerts view scoped to the objects for that folder.
Data Warehouse
Network Monitoring
Operations Manager
Operations Manager\Agent Details
Operations Manager\APM Agent Details
Management Server
Notification
UNIX/Linux Servers
Web Application Availability Monitoring
Management packs that you import typically include a standard Active Alerts view in its folder or within a dashboard included.
Viewing alert details
Alerts in System Center - Operations Manager include information to help you investigate and resolve the issues affecting your IT services that caused the alerts.
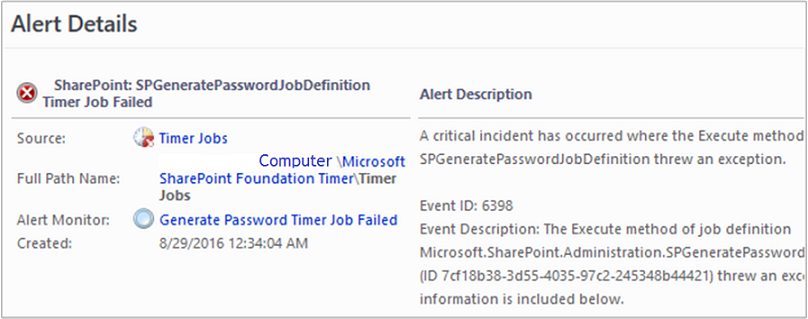
To view the details for an alert, in the Monitoring workspace, select Active Alerts, and select an alert in the results pane.
Tips
Locate and investigate monitors in the Warning and Error states in the Health Explorer of the computer that was the source of the alert. (To open Health Explorer, right-click the alert, point to Open, and select Health Explorer.) If there are unhealthy monitors, they may correlate with the alert you're researching. Check out the Context pane of the State Change Events tab for possible additional clues to the root cause.
Read all text in the alert properties. (Right-click the alert, and select Properties.) In particular, carefully review the Alert Description field on the General tab and the Description field on the Alert Context tab.
Right-click the alert, and open the Event view. Sort the events by the Level column, and then locate the events with the Error and Warning event levels. Events may correlate with the alert you're investigating and provide insight to its resolution.
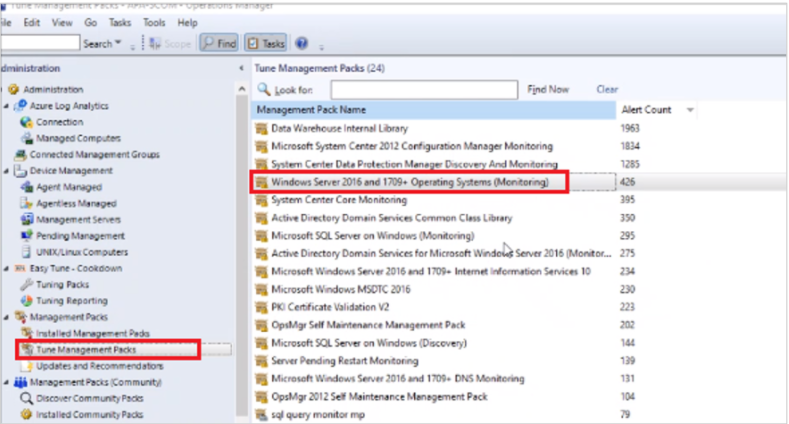
View source FQDN for alerts
With Operations Manager 2022, you can view source (FQDN) for the alerts when you try to tune a management pack.
Next steps
Before changing the number of missed heartbeats allowed, first review How Heartbeats Work in Operations Manager.
To understand how alerts are generated for monitored objects in your management group, see How an Alert is Produced.
To understand the behavior of alerts generated by monitors and how to approach managing alerts from them, review How to Close an Alert Generated by a Monitor.
After investigating and resolving the issue detected by one or more monitors, review How to Reset Health to manually reset health if the monitor isn't configured to auto-resolve or you don't want to wait for the monitor to detect health state.
Feedback
Coming soon: Throughout 2024 we will be phasing out GitHub Issues as the feedback mechanism for content and replacing it with a new feedback system. For more information see: https://aka.ms/ContentUserFeedback.
Submit and view feedback for