Search tools
The first step in effective reporting and data analysis is often finding data. If the correct data isn't shown, charts and reports don't really provide any value. Out of the box, Microsoft Dynamics 365 includes multiple views that can be used for quick filtering and analysis of data. Organizations can use these views to easily get a big picture overview of what's going on.
Let's look at a couple of examples:
- A sales manager uses the Leads Opened this Week view to see all the new leads that were generated during the current week. From the view, the sales manager can filter the leads by criteria like territory. The sales manager can assign the leads in specific territories to sales staff who are associated with those territories.
- An account executive exports the records that are shown in the My Closed Opportunities in Current Fiscal Year view to Microsoft Excel and creates a PivotTable to dive deeper into the numbers.
There are many different out-of-box views that show data in many ways. But organizations might have to find specific data that isn't shown in any out-of-box view. One way to find and present that data is to use the Advanced Find feature in Dynamics 365.
Advanced find
Advanced Find is an excellent way to extract data from Microsoft Dynamics 365 Sales. It uses user-defined filters to show the desired data. For example, a sales representative wants to see all their accounts that have ordered a specific product during the past six months. With Advanced Find, they can filter on data that's included not only in account records but also in related records, like the line items on orders that an account has placed. Advanced Find can also help prepare data for export to Excel for reporting purposes. To access this feature, select the Advanced Find button (looks like a filter) on the navigation bar. This opens the Advanced Find panel.
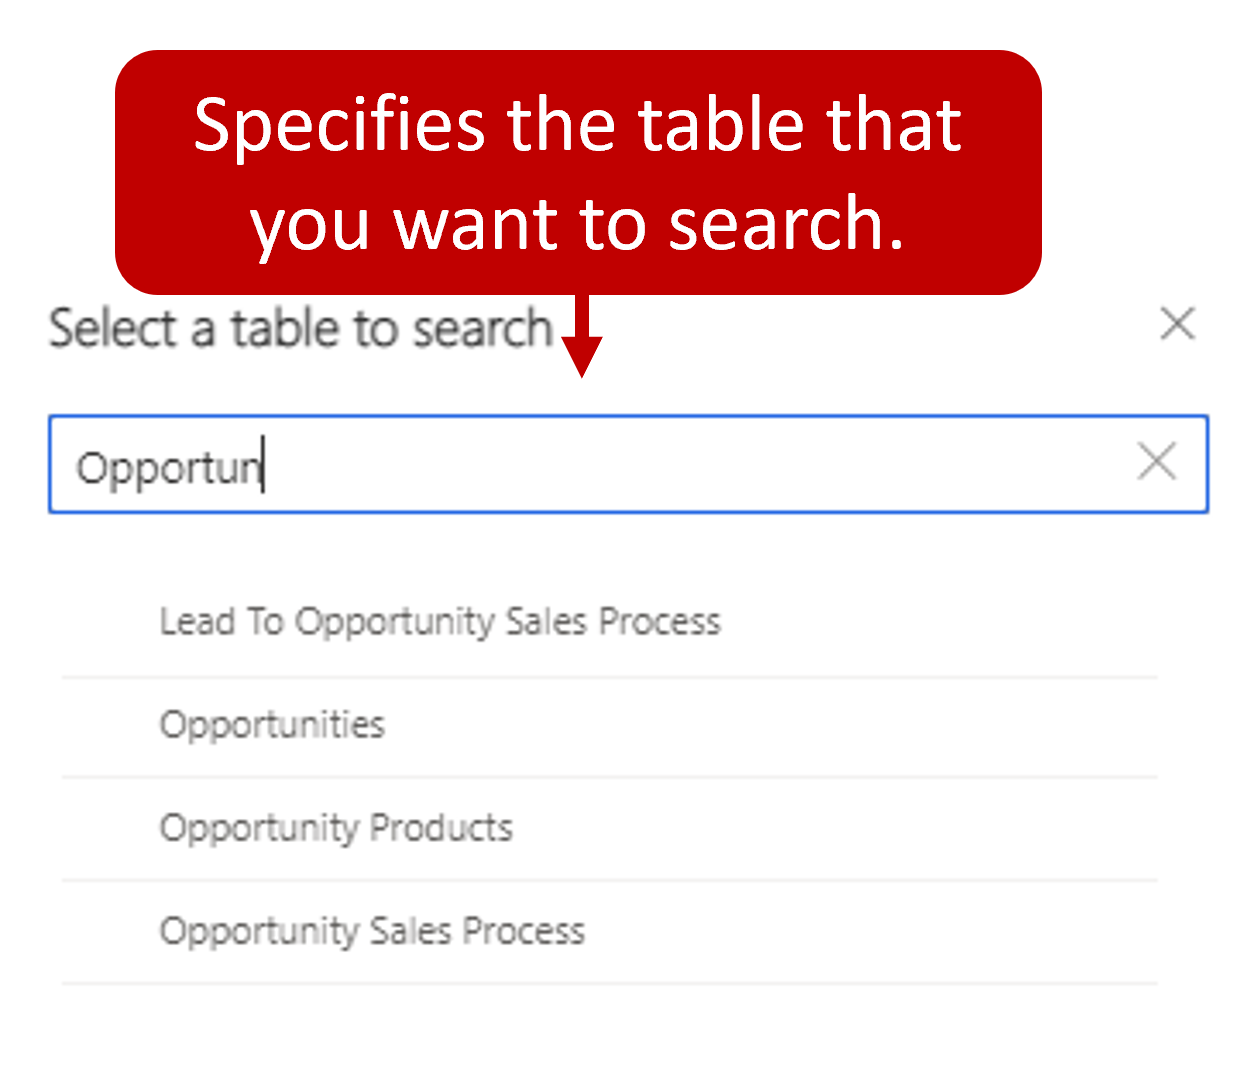
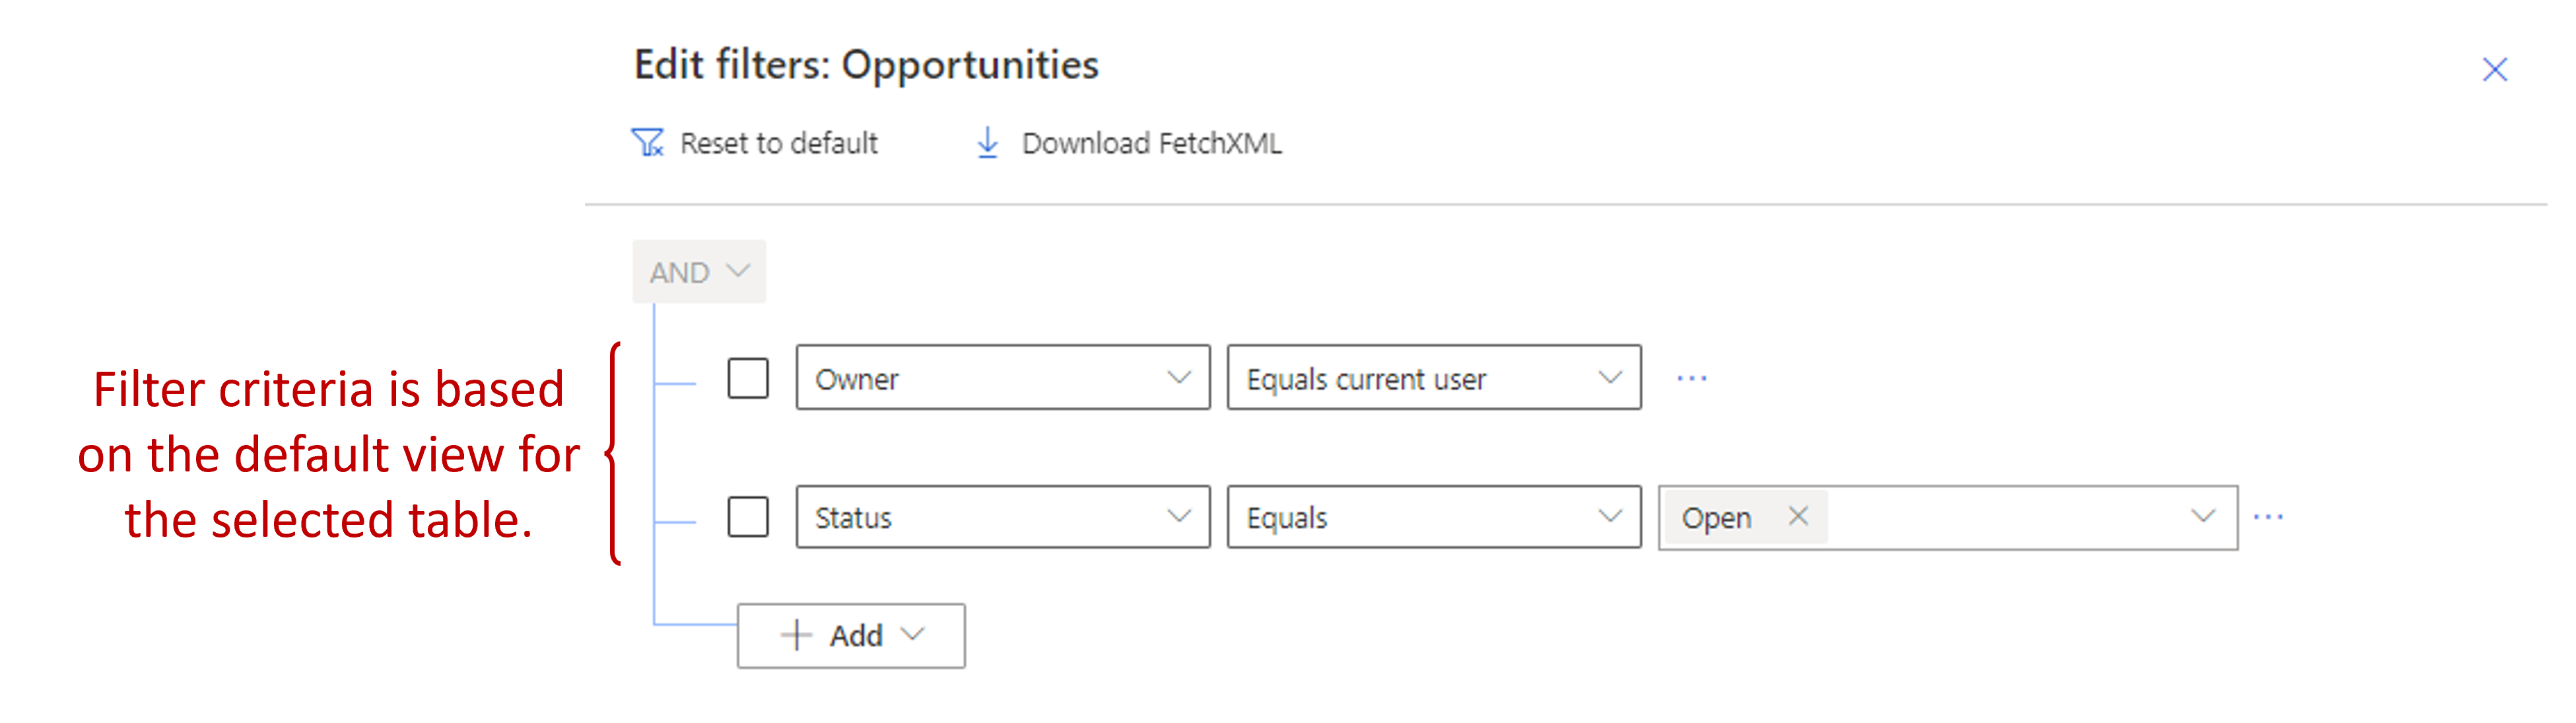
When Advanced Find is first loaded, you'll need to specify which table you want to search, such as Opportunities. After you select the table you want to use, it will open to the filter screen. The filter screen will be prefiltered based on the default view for the table you're working with. For example, the default view for Opportunities is My Open Opportunities. When the Advanced find filter opens two filters will already be applied.
Owner equals current user
Status equals open
This view will display all the open opportunities for the user who is currently logged in.
The following image shows what Advanced Find looks like for this example.
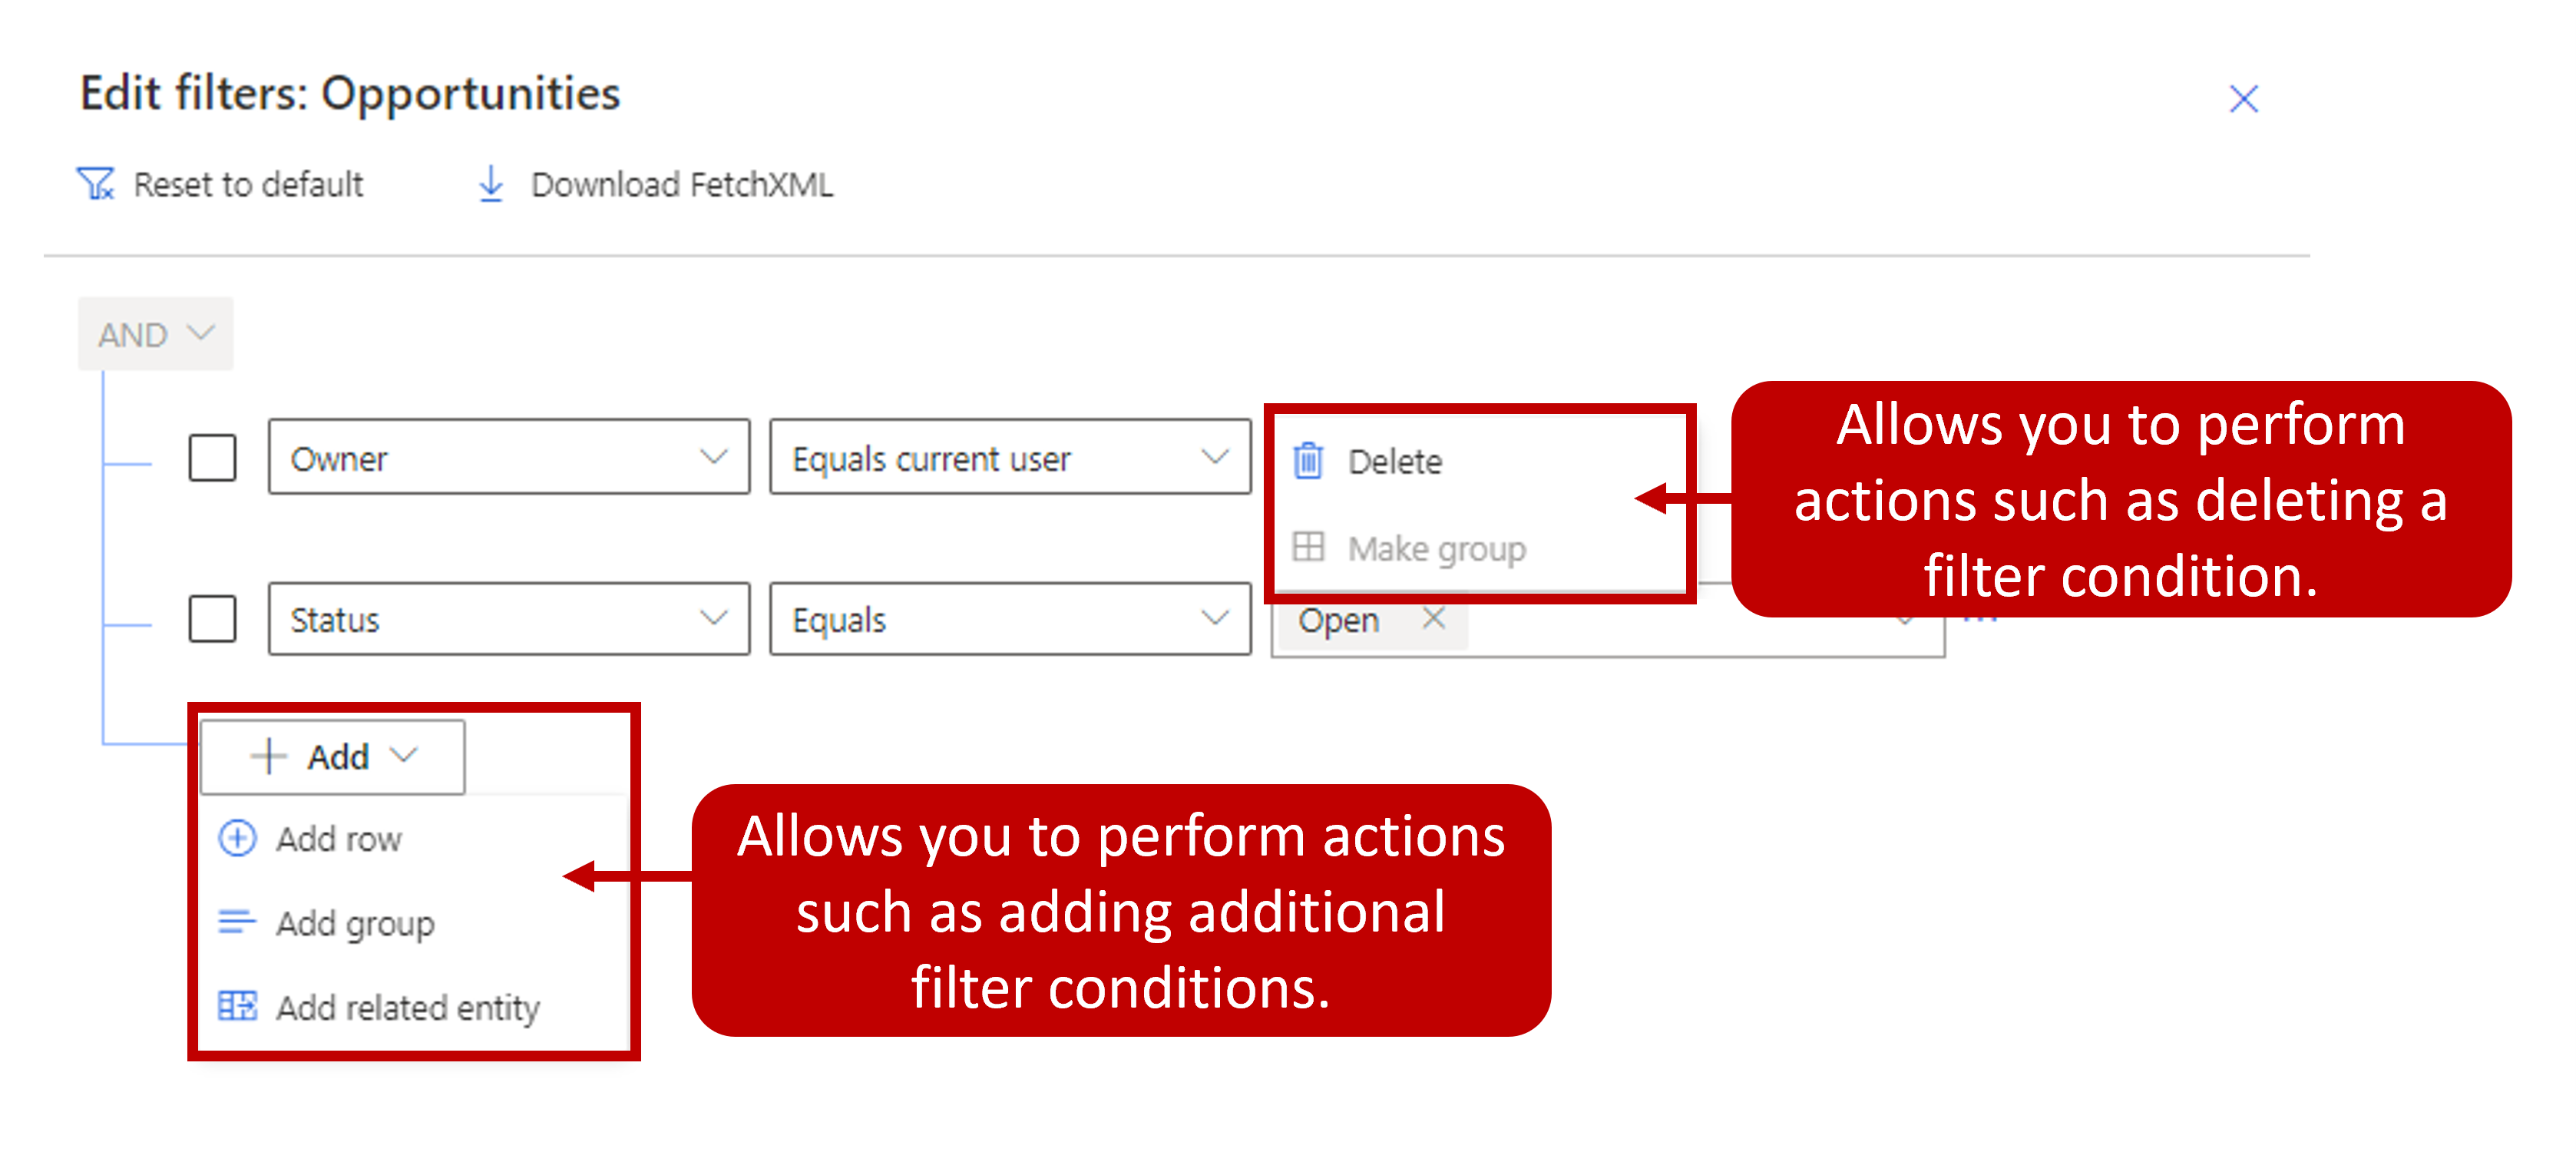
You can add, edit, or delete individual filter criteria as you require.
An Advanced Find search can return only a single record type in the list of results. It can't return, for example, both accounts and opportunities in one list. But it can use data in other tables to control which records are shown for a specific record type. For example, the filter criteria in the following image return account records that have open opportunities that have an estimated revenue of less than $100,000.00.
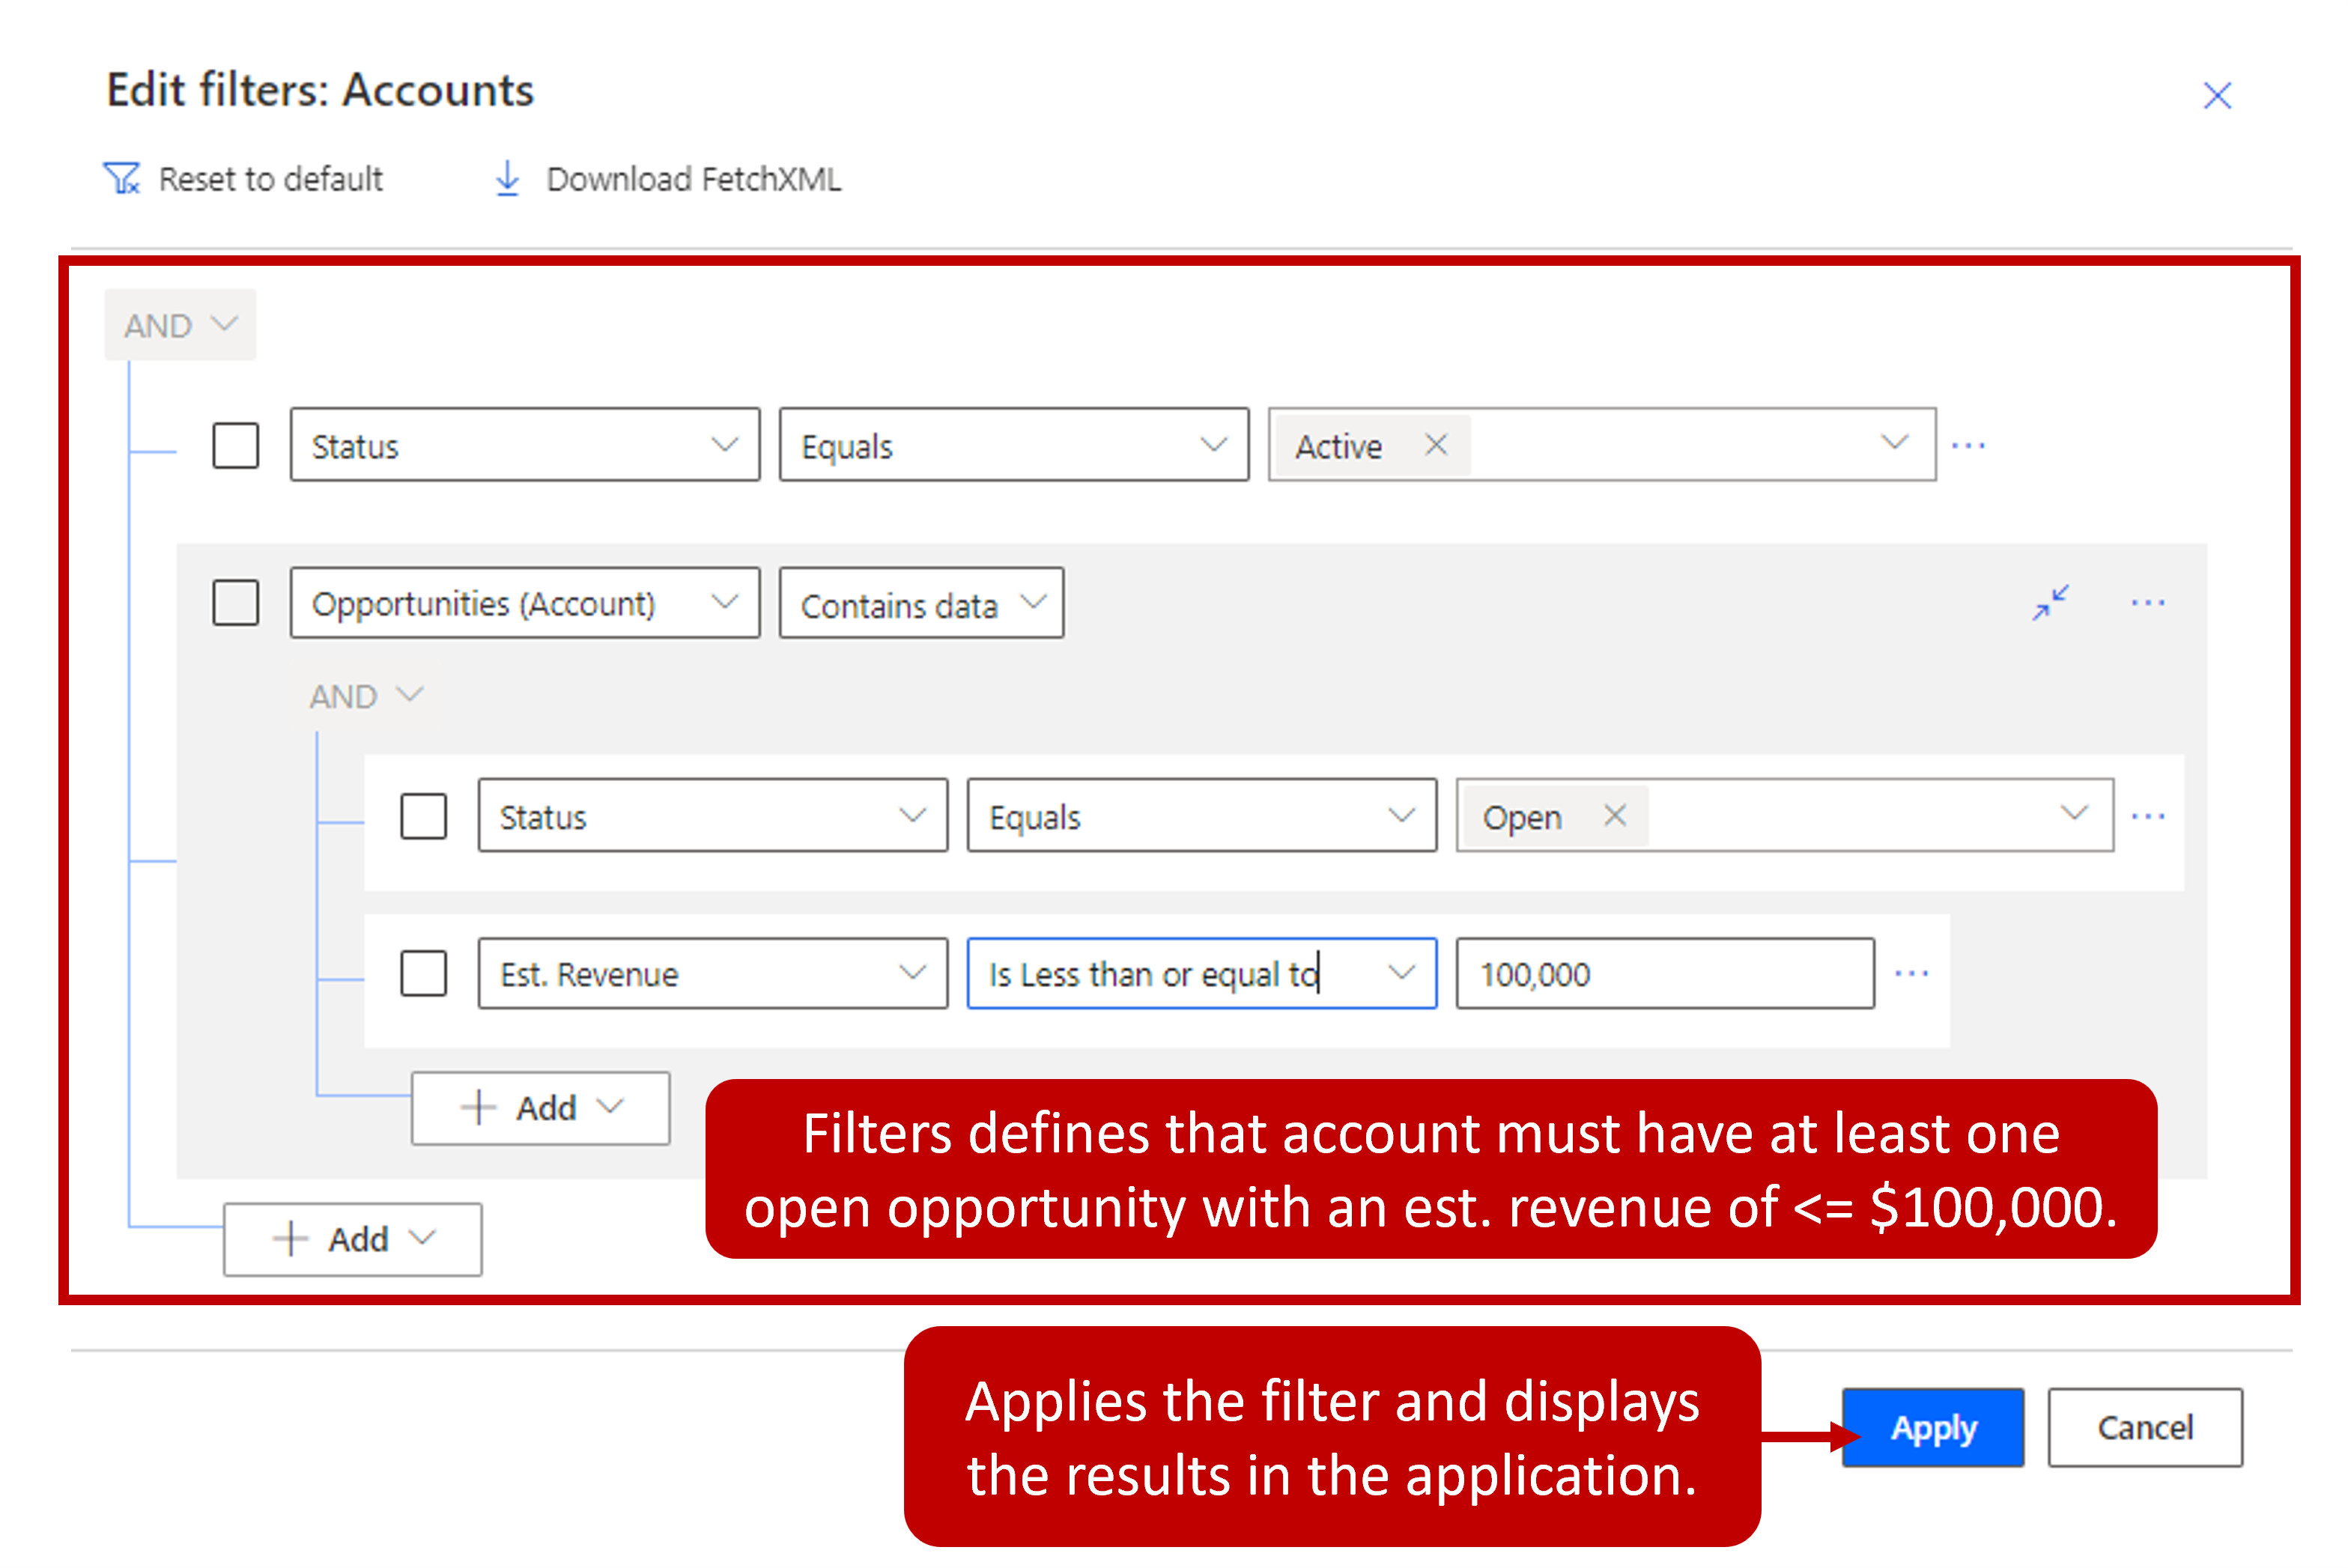
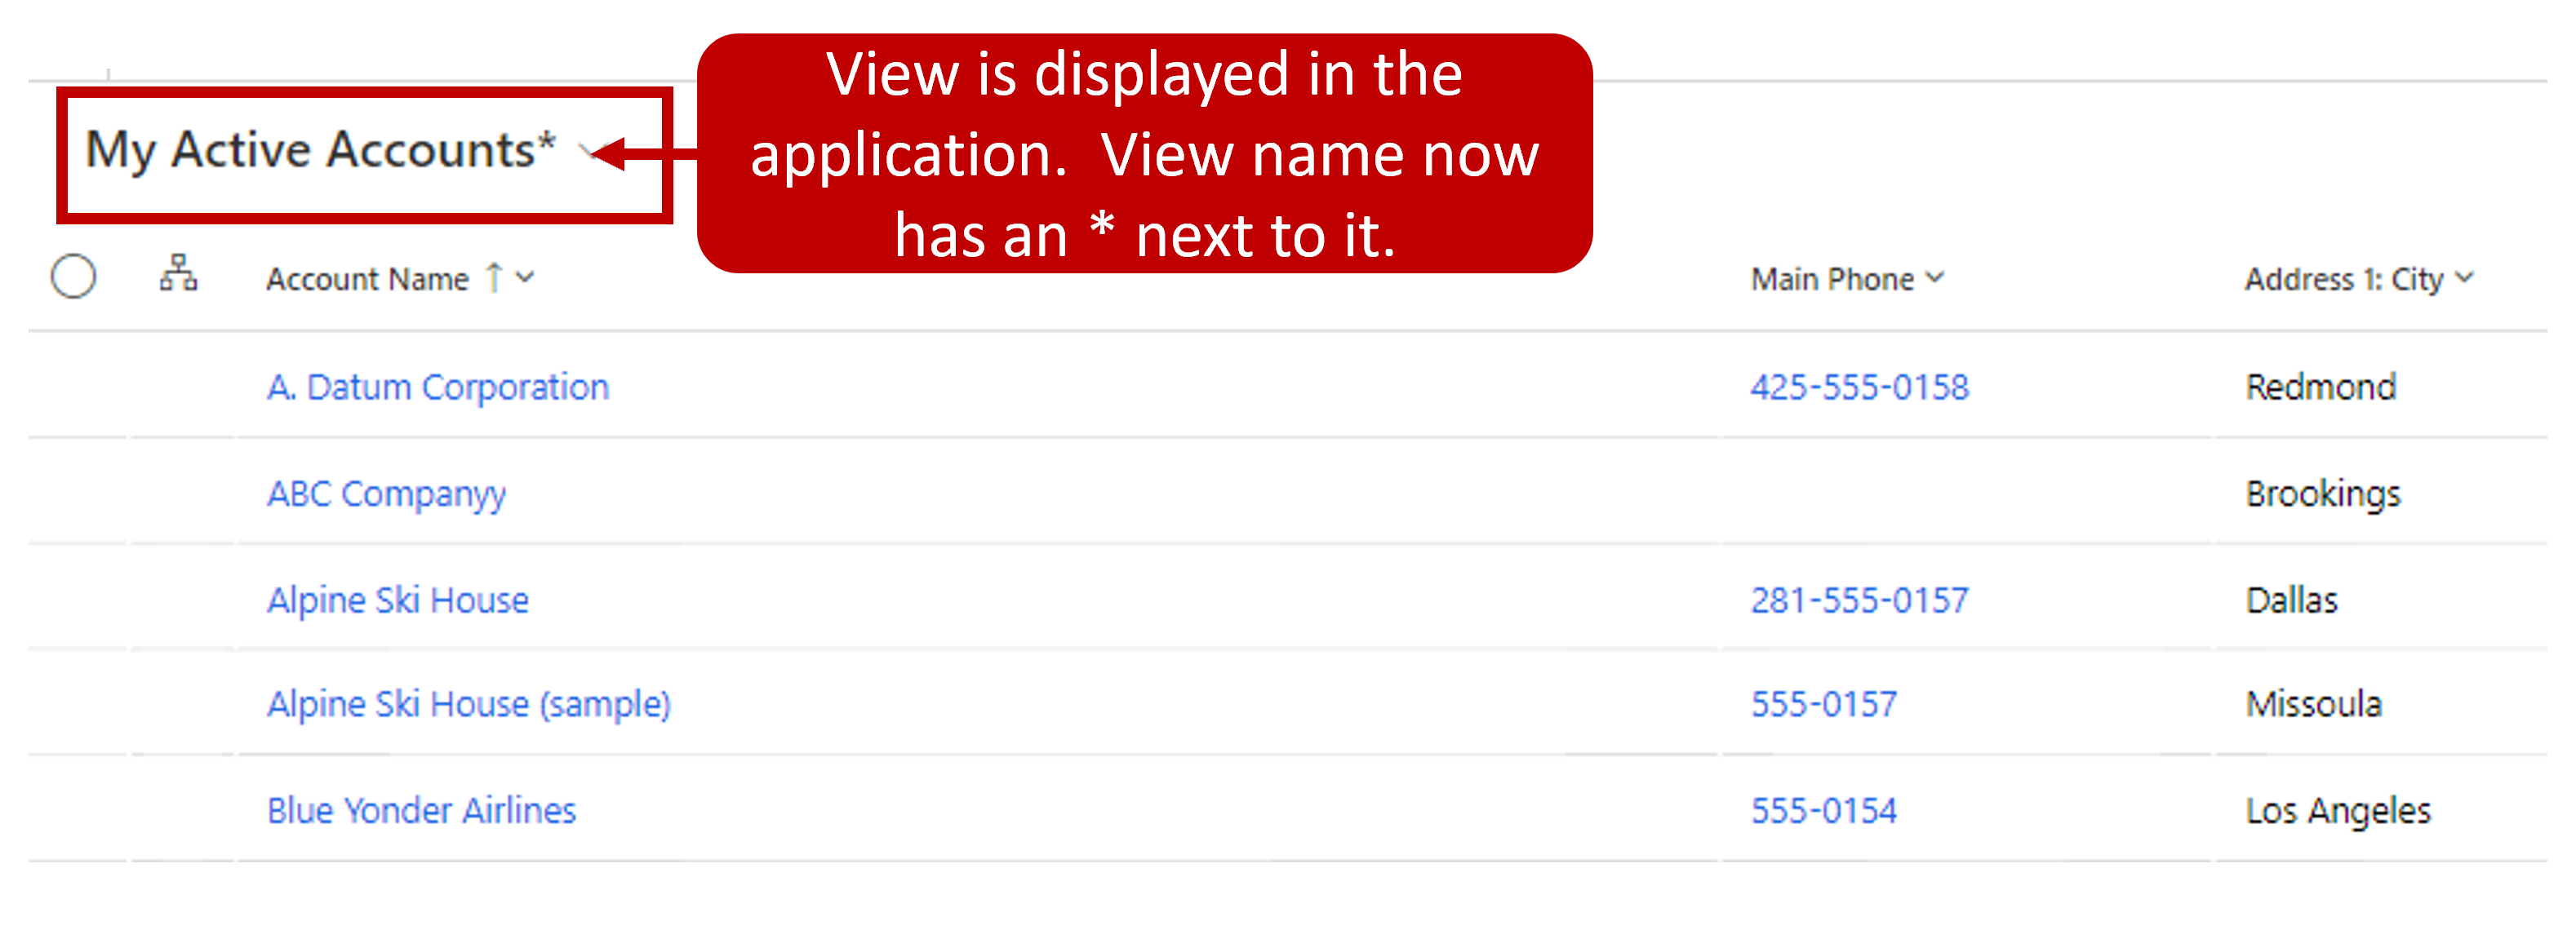
After you've finished defining the filter criteria, you can display the results in the application using the Apply button. Your filter will be displayed just as any other view would be displayed except the view will have an asterisk next to it.
If you want to save the Advanced Find filter so that it can be used as a view at any time, select the down arrow next to the view name. At the bottom of the menu that appears, you'll see an option to Save as a new view.
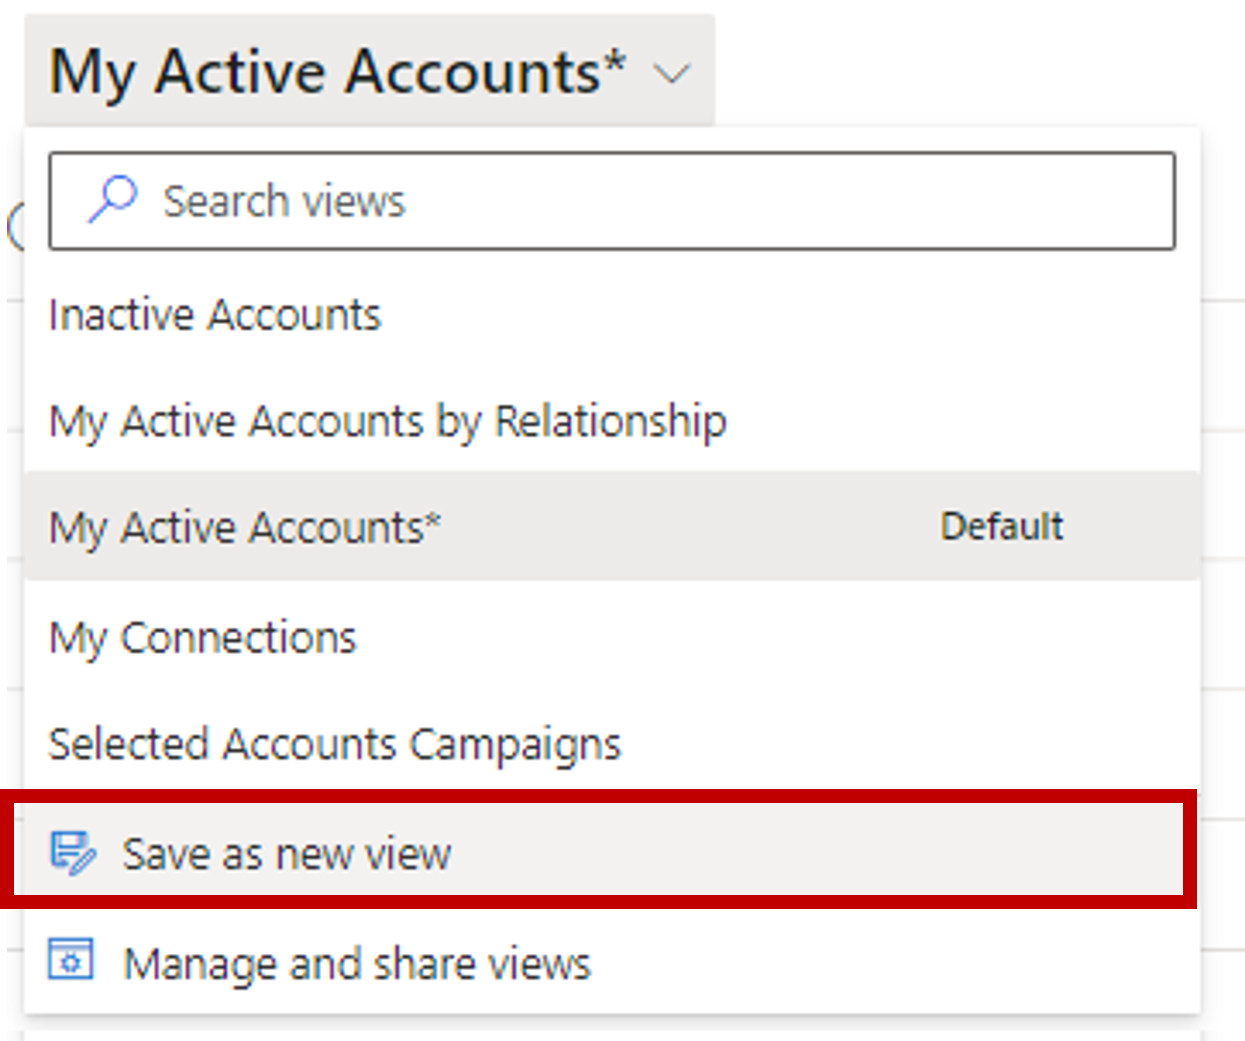
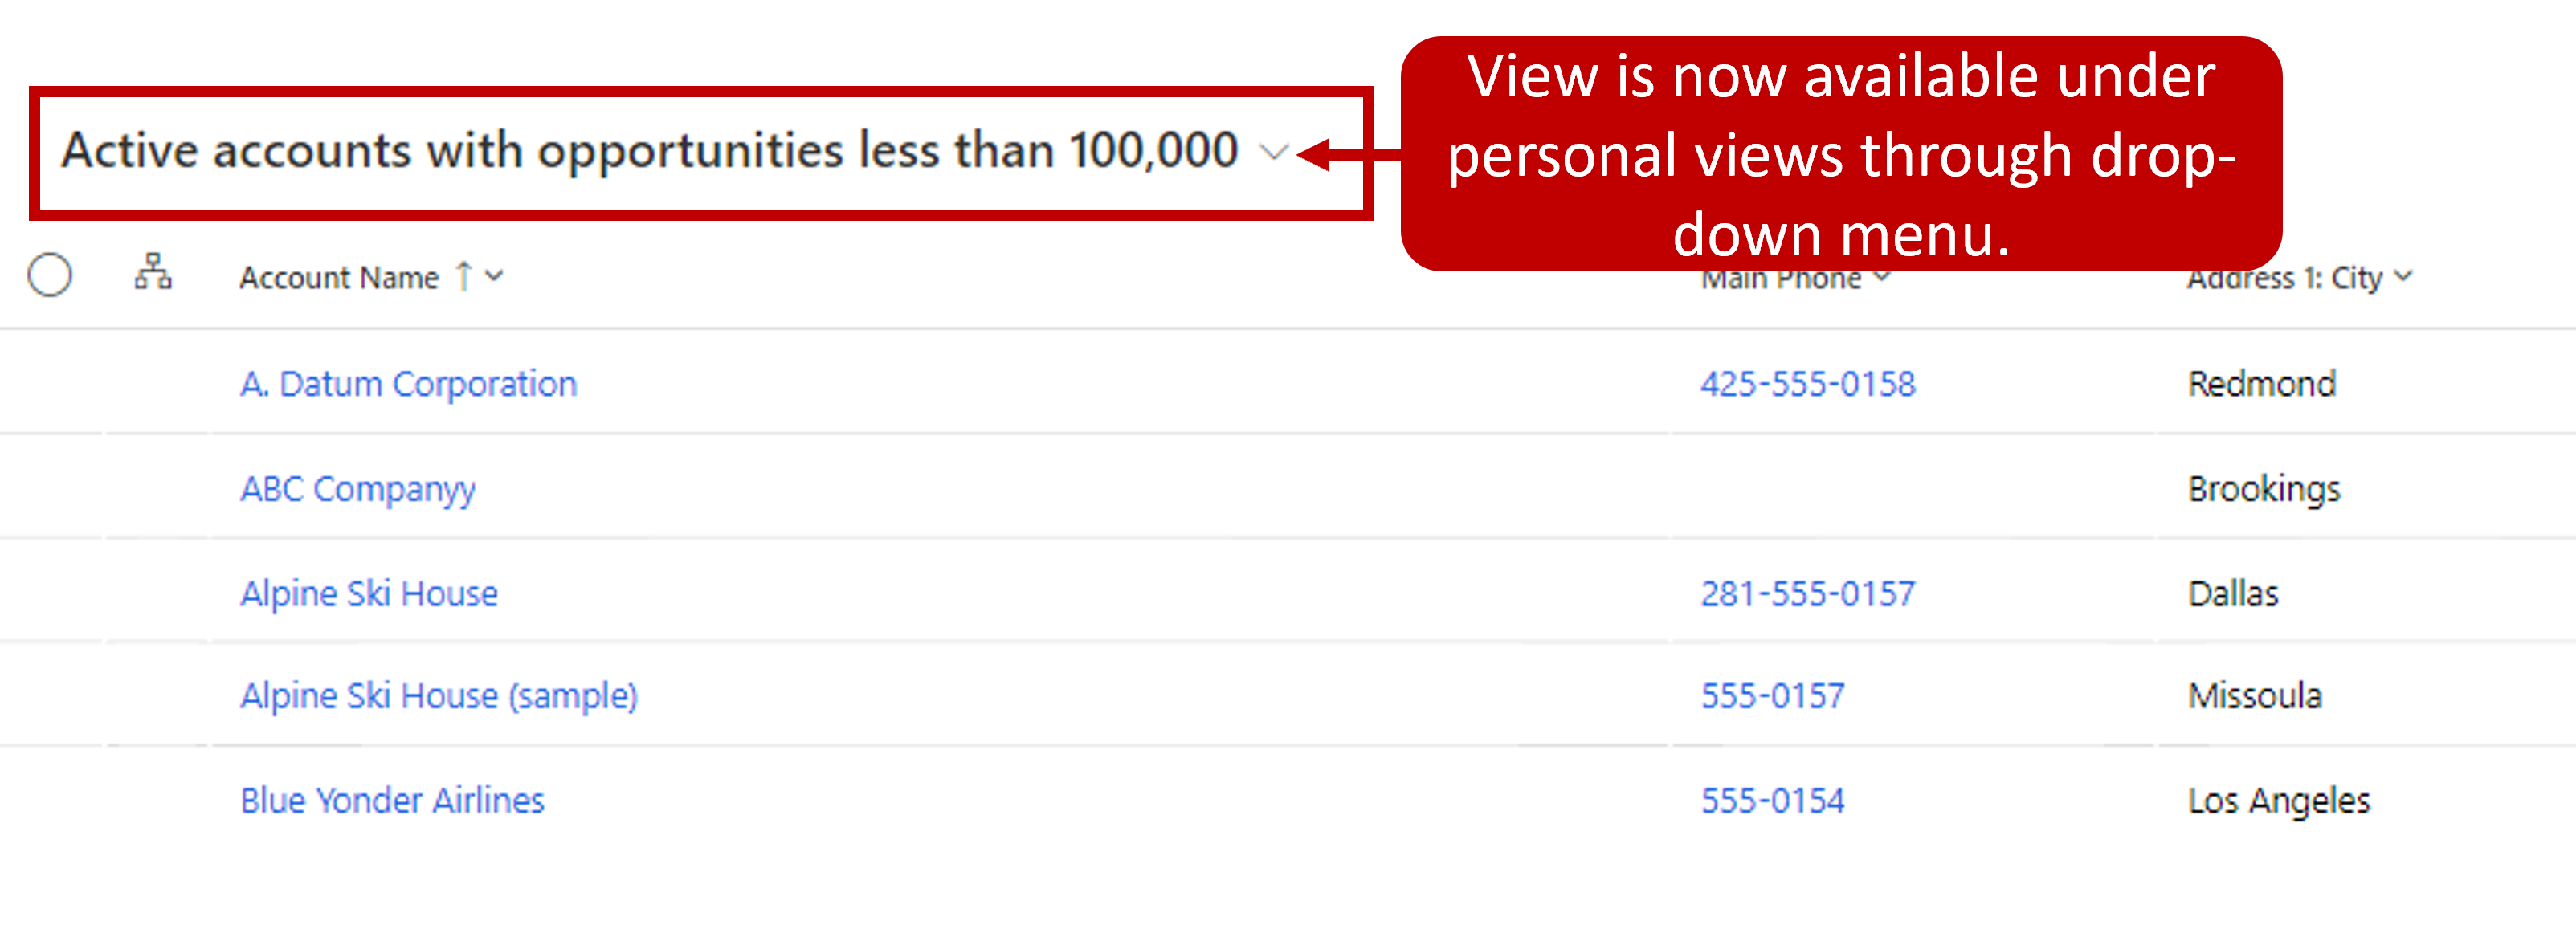
After you specify a name and save it, the view displays in the list of views for the table it was based on.
Excel integration
Many users are familiar and comfortable with the data analysis tools that are available in Excel. Therefore, many users prefer to export Dynamics 365 data to Excel and do data analysis from there.
Dynamics 365 provides several options that let users manage and analyze Dynamics 365 data by using the tools in Excel that they're familiar with.
Static Excel data exports:
- Users can export a snapshot of a selected view.
- Users can export all the records that are shown in a view.
Dynamic workbooks:
- The export creates workbooks that have a connection to the Dynamics 365 Sales database.
- The workbooks are dynamically updated from within Excel.
Dynamic PivotTables:
- These PivotTables resemble dynamic workbooks, but users must design the PivotTable columns and rows that they want to interact with.
Microsoft Excel Online:
- You can edit Dynamics 365 data by using Excel inside Dynamics 365.
- Data can be saved back to Dynamics 365.
Work with inline Excel
Sometimes, you might want to do bulk edits or do quick analysis of Dynamics 365 data by using the tools that are available in Excel. But you don't need to do a full export of the data. Dynamics 365 lets you do quick ad-hoc analysis by using Excel Online inside Dynamics 365. For example, if you're a sales manager, you might want to analyze the opportunities that your team owns to see how you can help your team members. You might also want to review key performance indicators (KPIs). If you're a sales representative, you can open your opportunities in Excel and do what-if analysis for different incentive scenarios. Finally, you might want to quickly open the data in Excel Online so that you can copy it somewhere else, like into an email.
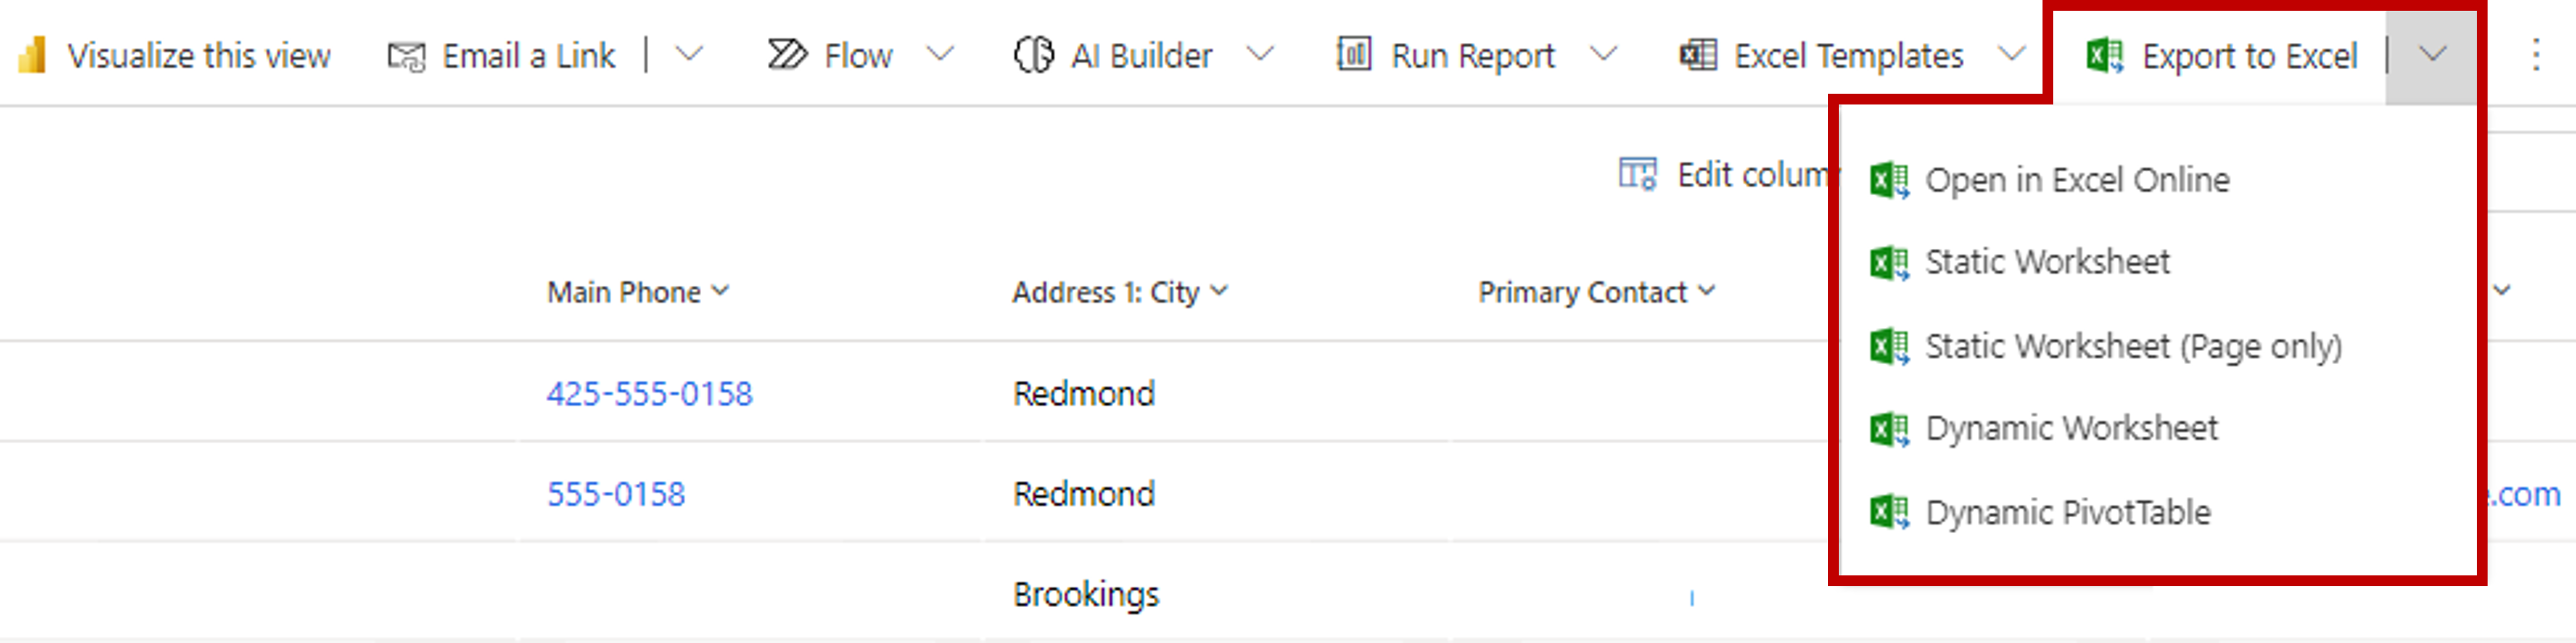
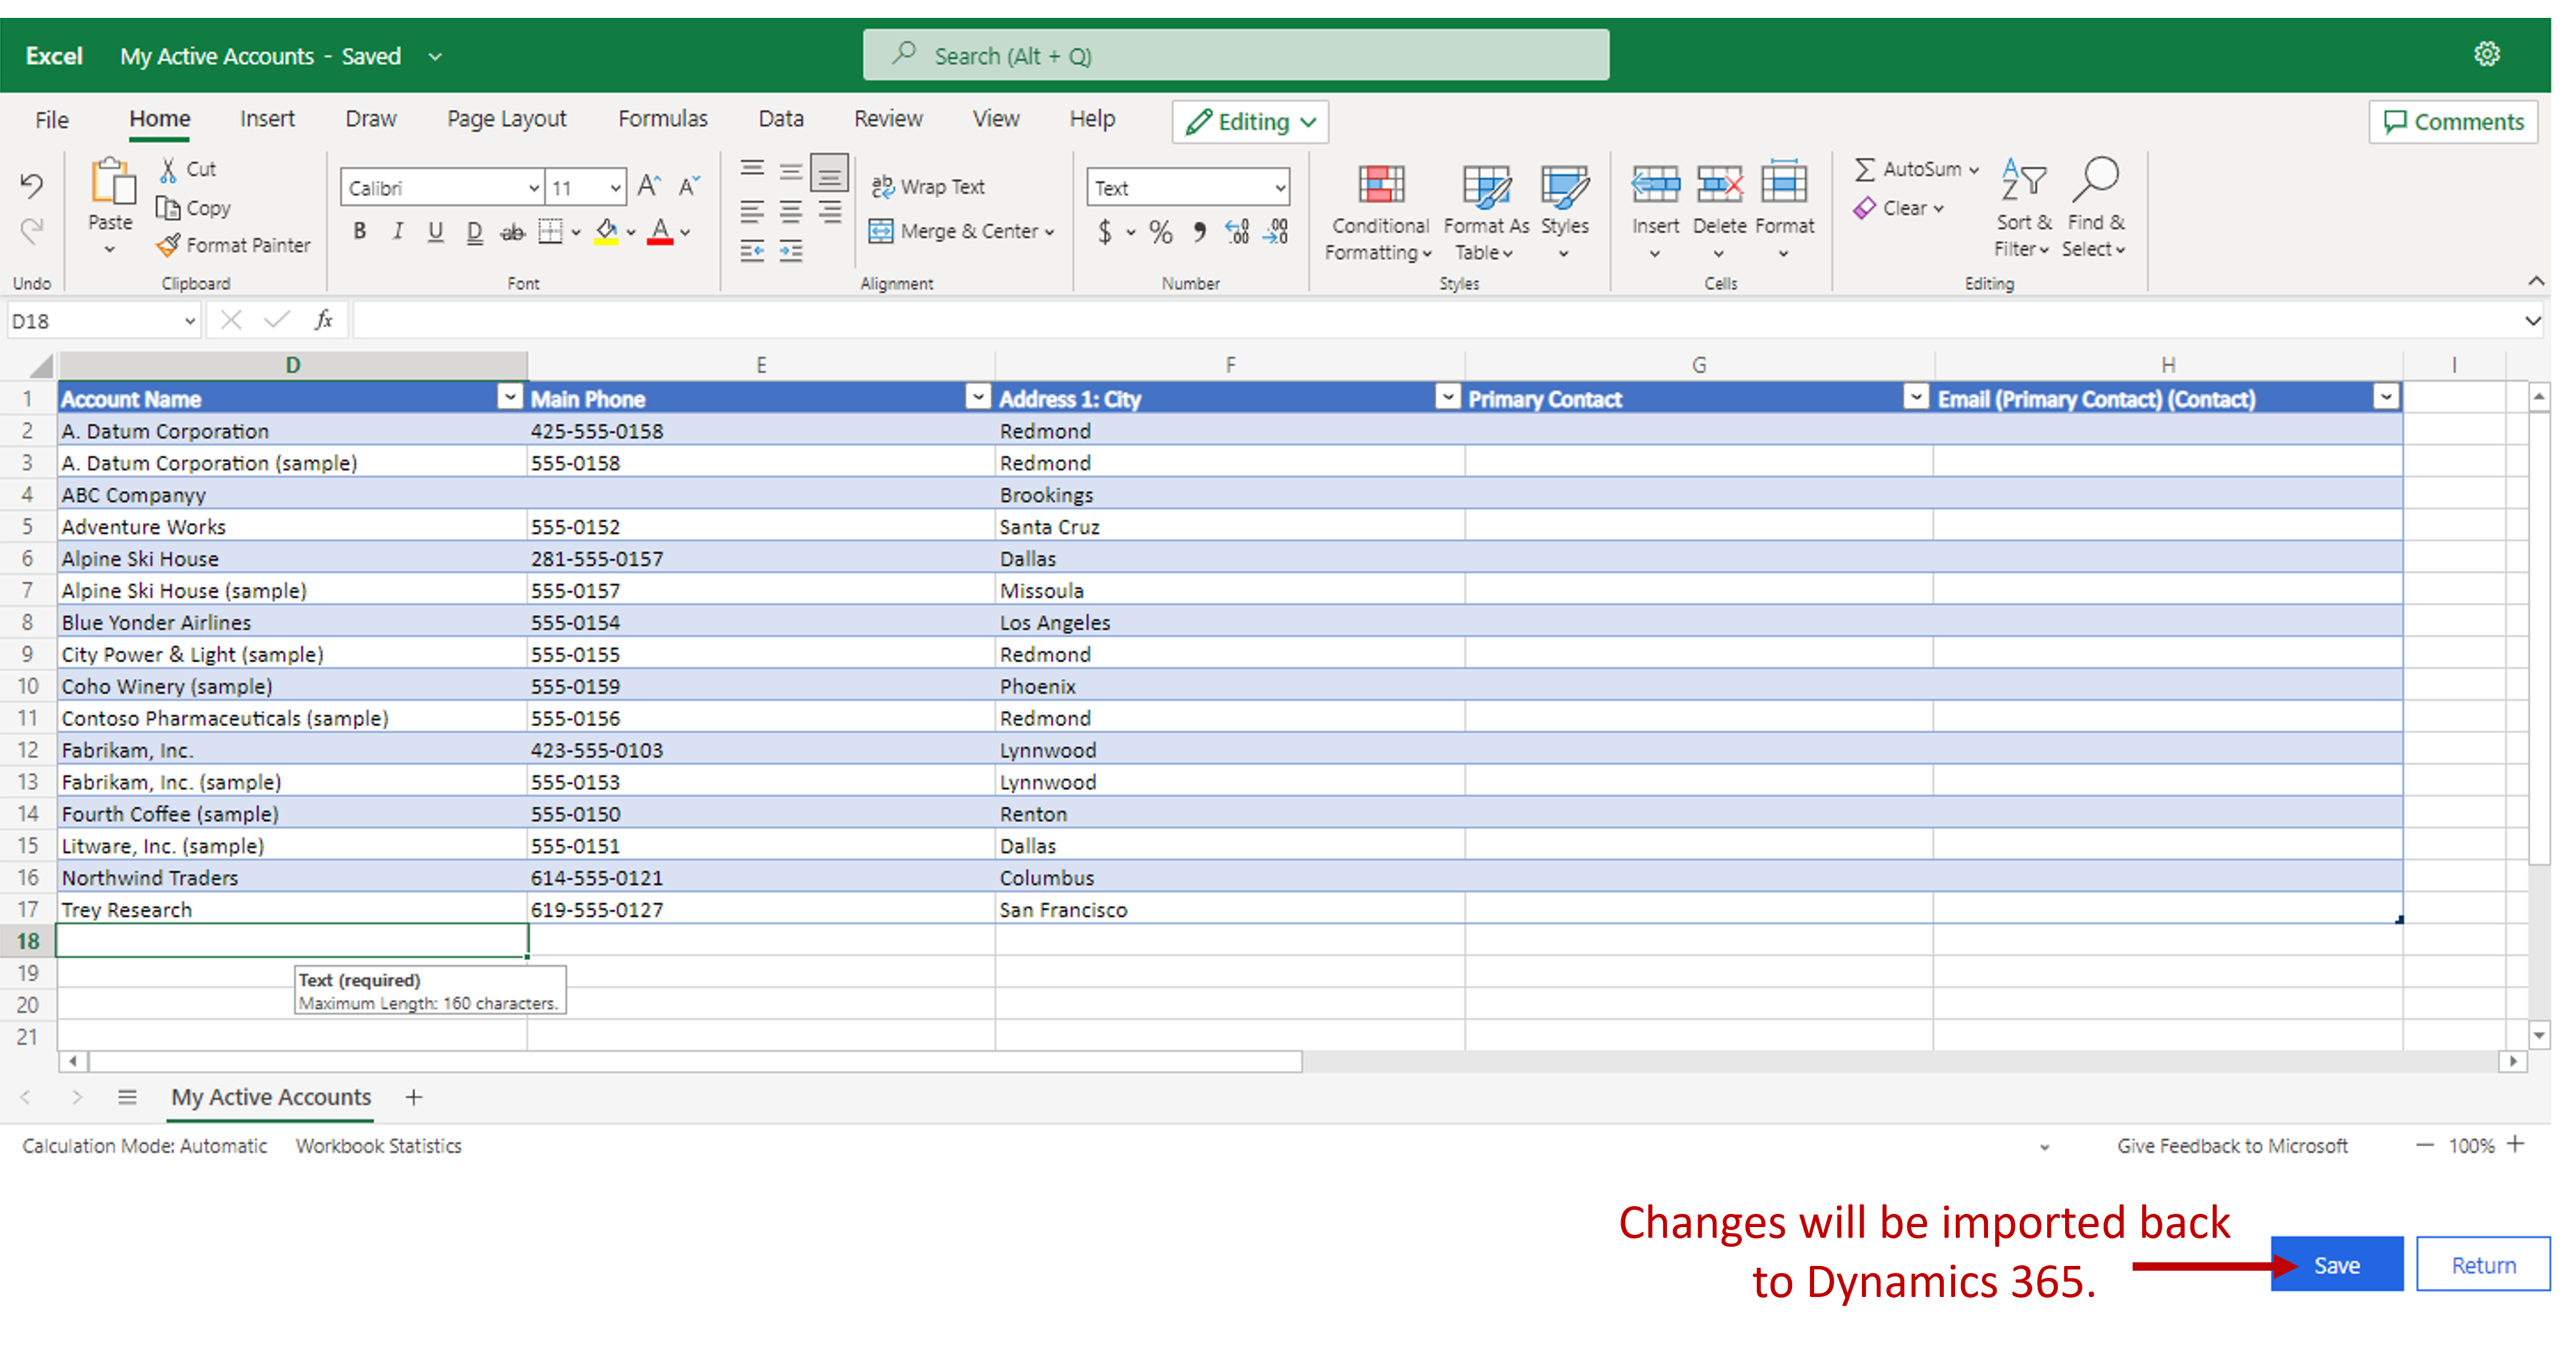
Any view that's currently shown in Dynamics 365 can be opened in Excel Online. Just select the Export to Excel button on the command bar, and then select Open in Excel Online on the menu that appears.
After you've finished editing your data in Excel Online, you can save the updated information back to Dynamics 365 by selecting the Save button. Remember to keep the existing format of the Excel cells, to prevent issues during import. Any additional information that you add to the workbook, like charts or colors, won't be saved.
Export Dynamics 365 information to Excel
If you need to take advantage of the more advanced analysis tools that are available in Excel, you can export Dynamics 365 data as either static workbooks or dynamic workbooks.
You can import both types of workbook back into Dynamics 365. If you need more advanced functions, you can export a dynamic PivotTable. PivotTables make it easy to organize and summarize data.
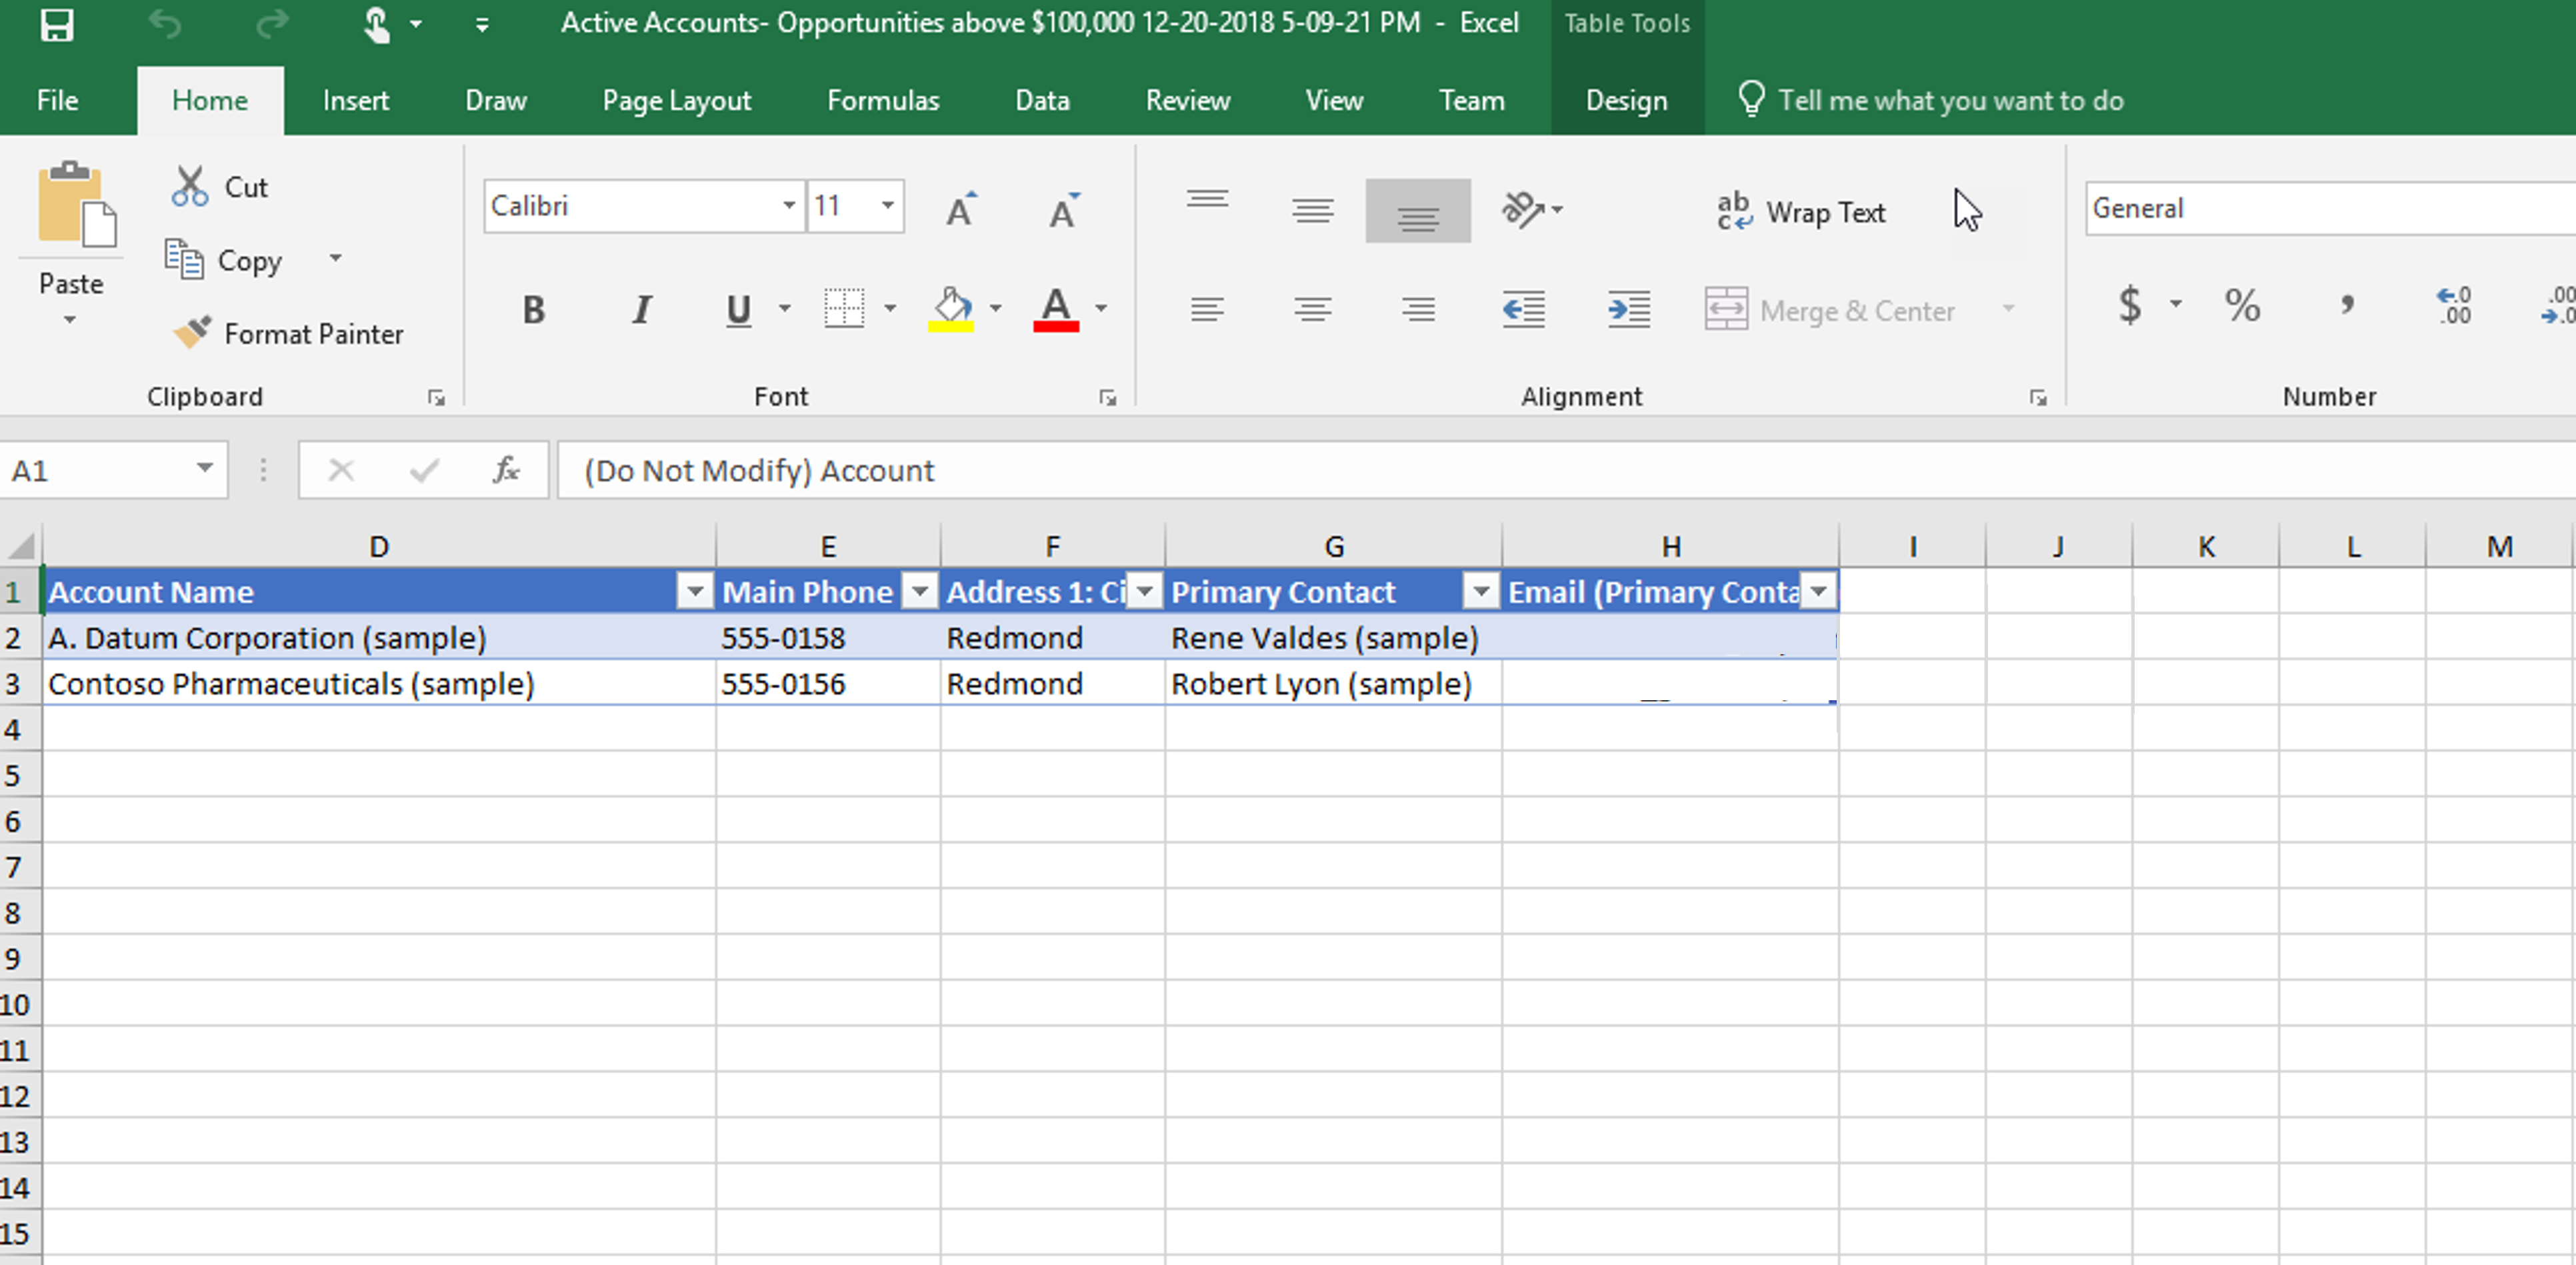
The Dynamics 365 data is exported to a standard Excel file that you can then use on any device, like your phone, tablet, or desktop computer. It's exported in the same format that you see in Dynamics 365. Therefore, text remains text, numbers remain numbers, and dates remain dates. But some cell formatting might change.