Overview of Azure Monitor on Azure Stack Hub
Like Azure Monitor on Azure, Azure Monitor on Azure Stack Hub provides base-level infrastructure metrics and logs for most services.
Azure Monitor sources: compute subset
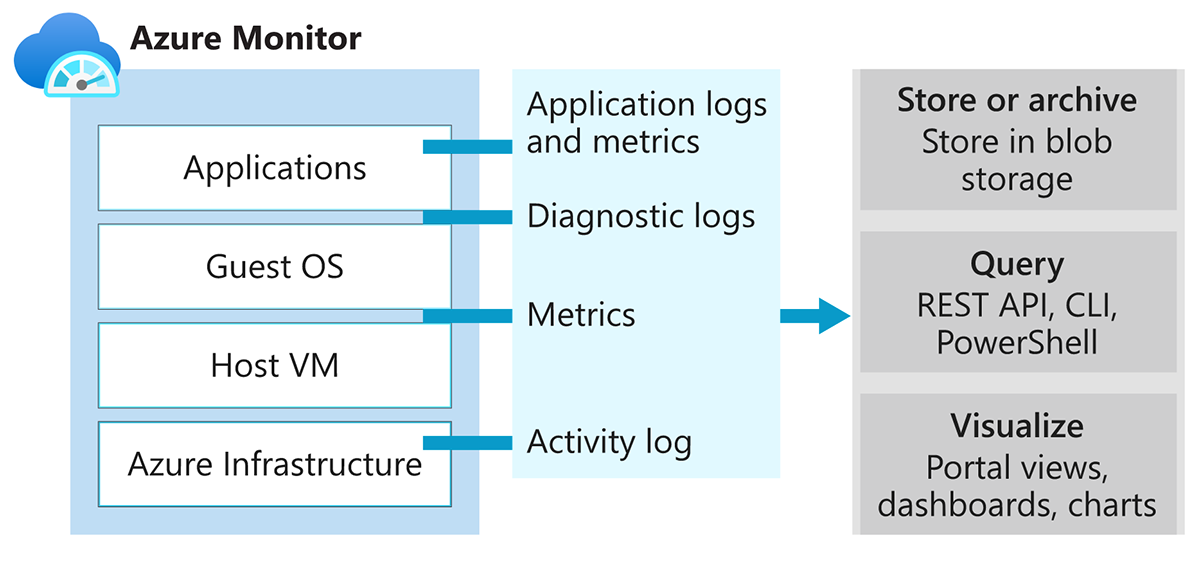
The Microsoft.Compute resource provider in Azure Stack Hub includes:
- Virtual machines
- Virtual machine scale sets
Application - diagnostics logs, app logs, and metrics
Apps can run in the OS of a virtual machine running with the Microsoft.Compute resource provider. These apps and virtual machines emit their own set of logs and metrics. Azure Monitor relies on the Azure diagnostics extension (Windows or Linux) to collect most app-level metrics and logs.
The types of measures include:
- Performance counters
- App logs
- Windows event logs
- .NET event source
- IIS logs
- Manifest-based ETW
- Crash dumps
- Customer error logs
Host and Guest virtual machine metrics
The previously listed compute resources have a dedicated host virtual machine and guest OS. The host virtual machine and guest OS are the equivalent of root virtual machine and guest virtual machine in Hyper-V hypervisor. You can collect metrics for both the host virtual machine and the guest OS. You can also collect diagnostics logs for the guest OS.
Activity log
You can search the activity logs for information about your compute resources as seen by the Azure Stack Hub infrastructure. The log contains information such as times when resources are created or destroyed. The activity logs on Azure Stack Hub are consistent with Azure.
Azure monitor sources: everything else
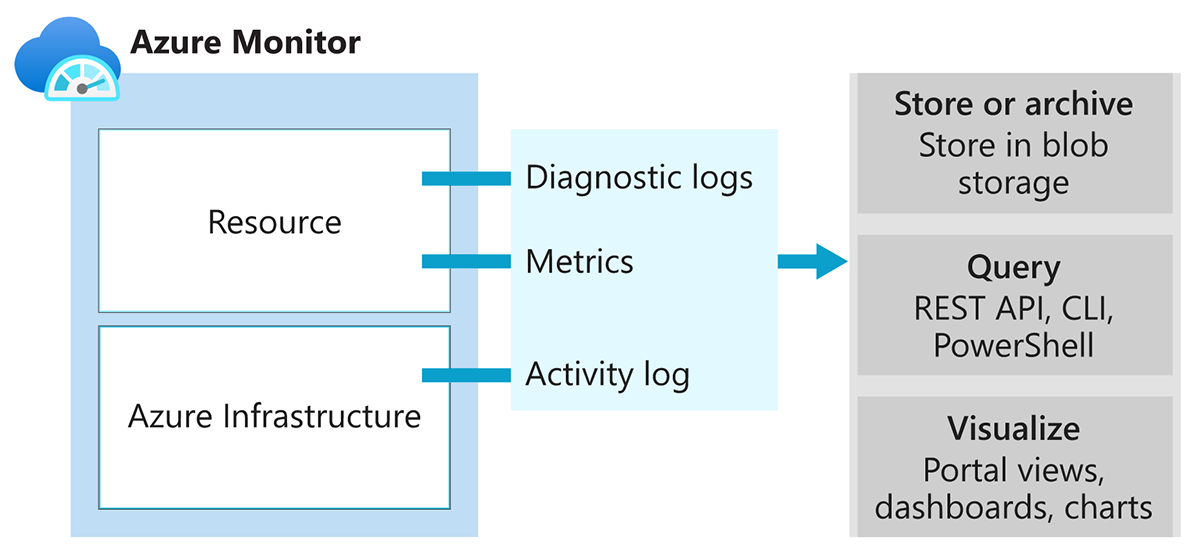
Resources - metrics and diagnostics logs
Collectible metrics and diagnostics logs vary based on the resource type. A list of collectible metrics for each resource on Azure Stack Hub is available at supported metrics.
Activity log
The activity log is the same for compute resources.
Uses for monitoring data
Store and Archive
Some monitoring data is already stored and available in Azure Monitor for a set amount of time.
- Metrics are stored for 90 days.
- Activity log entries are stored for 90 days.
- Diagnostics logs aren't stored.
- Archive the data to a storage account for longer retention.
Query
You can use the Azure Monitor REST API, cross-platform Command-Line Interface (CLI) commands, PowerShell cmdlets, or the .NET SDK to access the data in the system or Azure storage.
Visualization
Visualizing your monitoring data in graphics and charts helps you find trends quicker than looking through the data itself.
A few visualization methods include:
- Use the Azure Stack Hub user and administrator portal.
- Route data to Microsoft Power BI.
- Route the data to a third-party visualization tool using either live streaming or by having the tool read from an archive in Azure storage.