Describe Azure Monitor components
Monitoring is the act of collecting and analyzing data. The data can be used to determine the performance, health, and availability of your business applications and the resources they depend on.
An effective monitoring strategy helps you understand the detailed operation of the components of your applications. Monitoring also helps you increase your uptime by proactively notifying you of critical issues. You can then resolve the issues before they become severe.
Azure includes multiple services that individually perform a specific role or task in the monitoring space. Together, these services deliver a comprehensive solution for collecting, analyzing, and acting on data from your applications and the Azure resources that support them. The services also work to monitor critical on-premises resources to provide a hybrid monitoring environment. Understanding the tools and data that are available is the first step in developing a complete monitoring strategy for your application.
Things to know about monitoring with Azure
Let's take a look at the various Azure components that support Azure Monitor capabilities. The following diagram provides a high-level view of how Azure and Azure Monitor work together to provide you with a robust monitoring and diagnostics solution.
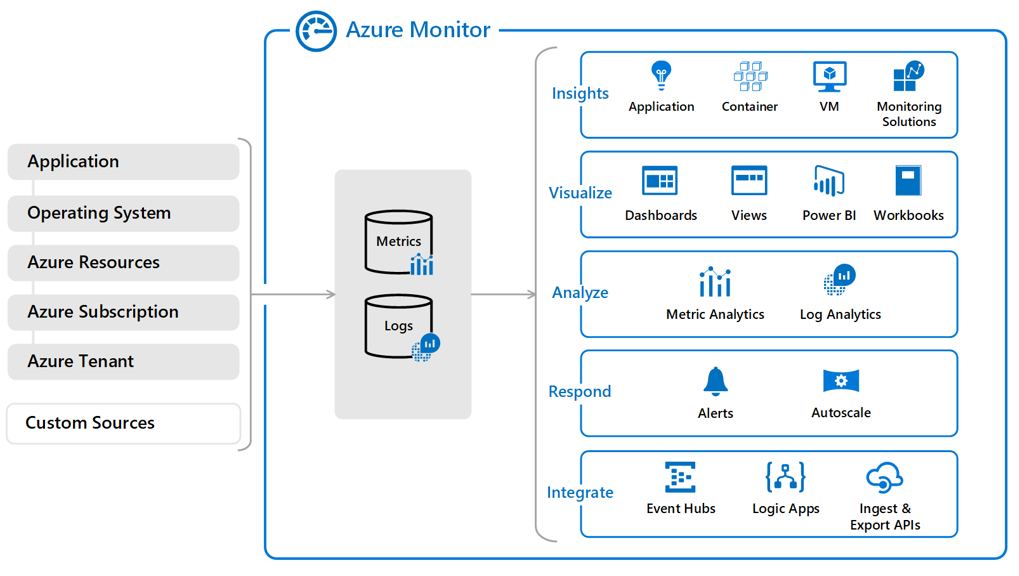
The monitoring and diagnostic services offered in Azure are divided into broad categories such as Core, Application, Infrastructure, and Shared Capabilities.
Data stores in Azure Monitor hold your metrics and logs. Azure Monitor Metrics and Azure Monitor Logs are the two base types of data used by the service.
Various monitoring sources provide Azure Monitor with the metrics and logs data to analyze. These sources can include your Azure subscription and tenant, your Azure service instances, your Azure resources, data from your applications, and more.
Azure Monitor Insights performs different functions with the collected data, including analysis, alerting, and streaming to external systems.
Get insights: Access the Azure Application Insights extension to Azure Monitor to use the Application Performance Monitoring (APM) features. You can use APM tools to monitor your application performance and gather trace logging data. Application Insights are available for many Azure services, such as Azure Virtual Machines and Azure Virtual Machine Scale Sets, Azure Container Instances, Azure Cosmos DB, and Azure IoT Edge.
Visualize: Utilize the many options in Azure Monitor for viewing and interpreting your gathered metrics and logs. You can use Power BI with the Azure Workbooks feature of Azure Monitor and access configurable dashboards and views.
Analyze: Work with Azure Monitor Logs (Log Analytics) in the Azure portal to write log queries for your data. You can interactively analyze your log data by using Azure Monitor Metrics and the powerful analysis engine.
Respond: Set up log alert rules in Azure Monitor to receive notifications about your application performance. You can configure the service to take automated action when the results of your queries and alerts match certain conditions or results.
Integrate: Ingest and export log query results from the Azure CLI, Azure PowerShell cmdlets, and various APIs. Set up automated export of your log data to your Azure Storage account or Azure Event Hubs. Build workflows to retrieve your log data and copy to external locations with Azure Logic Apps.