Examine the Azure IoT Central data analytics UI
Azure IoT Central provides rich analytics capabilities to analyze historical trends and correlate various telemetries from your devices.
To begin your investigation of the analytics tools, on the IoT Central navigation menu, under Analyze, select Data explorer, and then select + New query.
Understand the data explorer UI
The analytics user interface is made of three main components:
- Data configuration panel: On the configuration panel, start by selecting the device group for which you want to analyze the data. Next, select the telemetry that you want to analyze and select the aggregation method for each telemetry. The Group by control helps to group the data by using the device properties as dimensions.
- Time control: Use the time control to select the duration for which you want to analyze the data. You can drag either end of the time slider to select the time span. The time control also has an Interval size slider that controls the bucket or the interval size used to aggregate the data.
- Chart control: The chart control visualizes the data as a line chart. You can toggle the visibility of specific lines by interacting with the chart legend.
Query your data
You'll need to start by choosing a device group, and the telemetry that you want to analyze. Once you're done, select Analyze to start visualizing your data.
- Device group: A device group is a user-defined group of your devices. For example, All refrigerators in Oakland, or All version 2.0 wind turbines.
- Telemetry: Select the telemetry that you want to analyze and explore. You can select multiple telemetries to analyze together. Default aggregation method is set to Average for numerical and Count for string data-type respectively. Supported aggregation methods for Numeric data types are Average, Maximum, Minimum, Count and, Sum. Count is the only aggregation method for strings.
- Group by: The Group by control helps to group the data by using the device properties as dimensions. Values of the device and cloud properties are joined along with the telemetry as and when it's sent by the device. If the cloud or device property has been updated, then you'll see the telemetry grouped by different values on the chart.
Tip
To view data for each device separately, select Device Id in the Group by control.
Interact with your data
Once you've queried your data, you can start visualizing it on the line chart. You can show/hide telemetry, change the time duration, view telemetry in a data grid:
Time editor panel: By default you see your data from the last day. You can drag either end of the time slider to change the time duration. You can also use the calendar control to select one of the predefined time buckets or select a custom time range. Time control also has an Interval size slider that controls the bucket or the interval size used to aggregate the data.
Inner date range slider tool: Use the two endpoint controls by dragging them over the time span you want. This inner date range is constrained by the outer date range slider control.
Outer date range slider control: Use the endpoint controls to select the outer date range, which will be available for your inner date range control.
Increase and decrease date range buttons: Increase or decrease your time span by selecting either button for the interval you want.
Interval-size slider: Zoom in and out of intervals over the same time span. This action provides more precise control of movement between large slices of time. You can use it to see granular, high-resolution views of your data, even down to milliseconds. The slider's default starting point is set as the most optimal view of the data from your selection, which balances resolution, query speed, and granularity.
Date range picker: Easily select the date and time ranges you want. You can also use the control to switch between different time zones. After you make the changes to apply to your current workspace, select Save.
Tip
Interval size is determined dynamically based on the selected time span. Smaller time spans will enable aggregating the data into granular intervals of up to a few seconds.
Chart Legend: Chart legend shows the selected telemetry on the chart. You can hover over each item on the legend to bring it into focus on the chart. When you use Split By, the telemetry is grouped by the respective values of the selected dimension. You can toggle the visibility of each specific telemetry or the whole group by clicking on the group name.
Y-axis format control: y-axis mode cycles through the available y-axis view options. This control is available only when different telemetries are being visualized. You can set the y-axis by choosing from one of three modes:
- Stacked: A graph for every telemetry is stacked and each of the graphs have their own y-axis. This mode is set as default.
- Shared: A graph for every telemetry is plotted against the same y-axis.
- Overlap: Use it to stack multiple lines on the same y-axis, with the y-axis data changing based on the selected line.
Zoom control: Zoom lets you drill further into your data. If you find a time period you'd like to focus on within your result set, use your mouse pointer to grab the area, and then drag it to the endpoint of your choice. Then right select on the selected area and select Zoom.
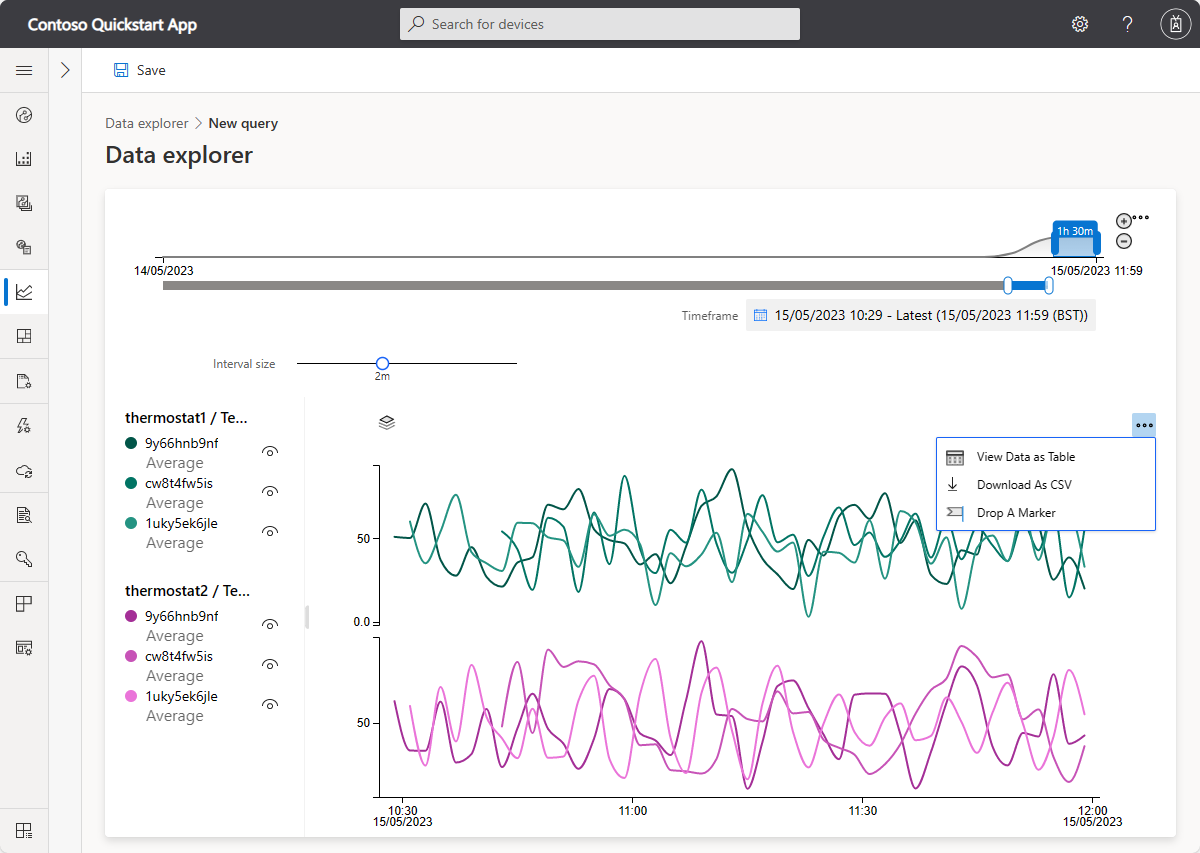
Under the ellipsis, there are more chart controls to interact with the data.
- View data as a table: Your results are available in a table format, enabling you to view the specific value for each data point.
- Download as CSV: Export your results as a comma-separated values (CSV) file. The CSV file contains data for each device. Results are exported by using the interval and timeframe specified.
- Drop a marker: The Drop a marker control lets you anchor certain data points on the chart. It's useful when you're trying to compare data for multiple lines across different time periods.
For detailed information about using the IoT Central Data explorer and building analytics queries, see: How to use data explorer to analyze device data.
Transform and export data
In addition to using IoT Central's internal data explorer tools, you can export your solution data to several different Azure services as well as webhook endpoints.
IoT Central's Data export feature can be used to continuously export filtered and enriched IoT data from your IoT Central application. Data export pushes changes in near real time to other parts of your cloud solution for warm-path insights, analytics, and storage.
For example, you can:
- Continuously export telemetry, property changes, device connectivity, device lifecycle, and device template lifecycle data in JSON format in near real time.
- Filter the data streams to export data that matches custom conditions.
- Enrich the data streams with custom values and property values from the device.
- Transform the data streams to modify their shape and content.
Note
To use data export features, you must have the data export permission.
Transform data internally
Since IoT devices send data in various formats, you may need to transform your device data before it's exported to other services.
Transformations in an IoT Central data export definition let you manipulate the format and structure of the device data before it's exported to a destination. You can specify a transformation for each destination in an export definition. Each message passes through the transformation to create an output record that's exported to the destination.
Use transformations to restructure JSON payloads, rename fields, filter out fields, and run simple calculations on telemetry values. For example, use a transformation to convert your messages into a tabular format that matches the schema of a destination such as an Azure Data Explorer table.
For detailed information on setting up data transformations, see: Transform data inside your IoT Central application for export.
IoT Central data export destinations
The IoT Central data export destination options include Azure Blob Storage, Azure Data Explorer, Azure Events Hubs, Azure Service Bus Queue, Azure Service Bus Topic, and Webhook. For detailed instructions on setting up and managing data exports, see the following: