Exercise - Explore Microsoft Dataverse
In this exercise, you explore Microsoft Dataverse standard tables. Tables in Microsoft Dataverse are similar to tables in a database or worksheets in Microsoft Excel. You can connect tables together with relationships that model real-world interactions between the data. Each table contains multiple rows (records), each having data columns. For example, a Project table might have columns such as Name, Due Date, and Status. And it might be related to a Project Owner table, which might have columns such as Name and Email.
Microsoft Dataverse abstracts much of the typical low-level database management work to help make it easier for you to set up a custom data model that fits your application.
In addition to allowing for the creation of custom tables, Microsoft Dataverse contains a Common Data Model that consists of hundreds of standard table definitions. You can find the current Common Data Model schema at GitHub Microsoft CDM. You can also browse the Common Data Model by using the CDM Visual Table Navigator by going to GitHub CDM. For more information, see Common Data Model Overview.
Note
This module is designed for use with the App in a Day instructor-led course. For more information on attending this free, instructor-led course, see Microsoft Power Platform instructor-led training. On that page, you can Register for an event.
Note
To complete the exercises, you'll need to use a few files. Download the App in a Day files for use in this module. The file folders that are in this download include:
- Completed modules with instructions - Package files to import the completed exercise steps.
- Machine-Order-Data.xlsx - File used in the exercises.
Task - Explore standard tables
In this task, you explore Microsoft Dataverse standard tables.
Before beginning the exercises, go to Make Microsoft Power Apps and confirm that you're in your training environment for the labs.

In the navigation pane to the left of the screen, select Tables.

A list of tables in this environment displays. Select a few of the standard tables (such as Account) to get familiar with some features of a table.

Table properties
In the Table properties section, you'll find the table name, table type, the table's primary column, and table description. You can also copy the table's set name, schema name, or logical name from the Tools dropdown menu.

Table schema
In the Schema section, you can navigate to the table columns, relationships, and keys. For this exercise, select Columns.

Columns
A table has a list of columns. In the following example, the Account table has columns such as Account Name and Account Number. Each column has a data type, such as Text and Number. The system chooses the data type when you create a column, and this value isn't changeable. The data type also defines many characteristics and behaviors of the column when your application runs. For example, a Choice column allows you to have a predefined list of values for use in your application. When this column is used on a form in a model-driven application, the visual presentation is a dropdown control. The column helps to ensure data consistency and allows for built-in support for multi-language applications.

For more information, see Microsoft Dataverse Supported Data Types.
Return to the table by selecting the browser's back button.
Select Relationships.

Relationships
Relationships allow you to manage relationships between tables. Supported relationships include one to many (1:N), many to one (N:1), and many to many (N:N). Relationships also define the behavior that happens when actions occur on the primary row in a 1:N relationship. For example, if the parent row is deleted, you can set up the relationship behavior so that all child rows are also deleted, or you can remove the reference.

Return to the table by selecting the browser's back button.
Select Keys.

Keys
By selecting the Keys menu, you can view the lookup keys for the table. Keys can contain multiple columns to define a composite key. Keys enforce uniqueness, so you shouldn't use them when you need to store duplicate values of used columns.

Return to the table by selecting the browser's back button.
Data experiences
With the Data experiences menu, you can navigate to the table forms, views, charts, and dashboards. Select Forms.

Forms
You can use forms to interact with the data that you need to do your work. Make sure that the forms that you use are designed to help you efficiently find or enter the information that you need. From the New form dropdown menu, you can create different types of forms, such as Quick Create, Quick View, Card, and a Main form. Some forms have more than one version to accommodate different user roles within your organization.

Return to the table by selecting the browser's back button.
Select Views.

Views
Views let you define how a list of rows are shown in the app. You can create multiple custom views, each having its own filtering and sorting criteria. For example, you could create a view so that only the rows that were created in the last week are visible. You could create another view for rows that haven't been updated in a year. Create views to make the application users more productive in filtering their data.

Return to the table by selecting the browser's back button.
Select Charts.

Charts
Use charts to display a high-level view of your data in insightful and graphical ways.

Return to the table by selecting the browser's back button.
Select Dashboards.

Dashboards
Dashboards help you bring your views, charts, and web resources together in one place.

Return to the table by selecting the browser's back button.
Customizations
In the Customizations section, you can navigate to the table business rules and commands. Select Business rules.

Business rules
Building a business rule is similar to building a flowchart where you can define conditions and actions.
For more information, see Business Rules Recommendations.

Return to the table by selecting the browser's back button.
Select Commands.

Commands
Microsoft Dataverse allows you to create your own command bar buttons. The commands that you add to the table are listed in the Commands section.

Return to the table by selecting the browser's back button.
Columns and data
The columns and data section shows the first 10 rows of the table data. You can also view more columns by selecting the Show existing columns button, add a new column by selecting the + new column button, edit table data with the Edit button, and order columns to your liking by dragging and dropping columns.

Select the Edit button.
Edit
By selecting the Edit button, you can create a new row, create a new column, refresh the data to view the latest rows, create an app from the data, and edit the table properties.

You can delete one or more rows by selecting the rows that you want to delete. For this exercise, don't delete rows.

Select the Back button.
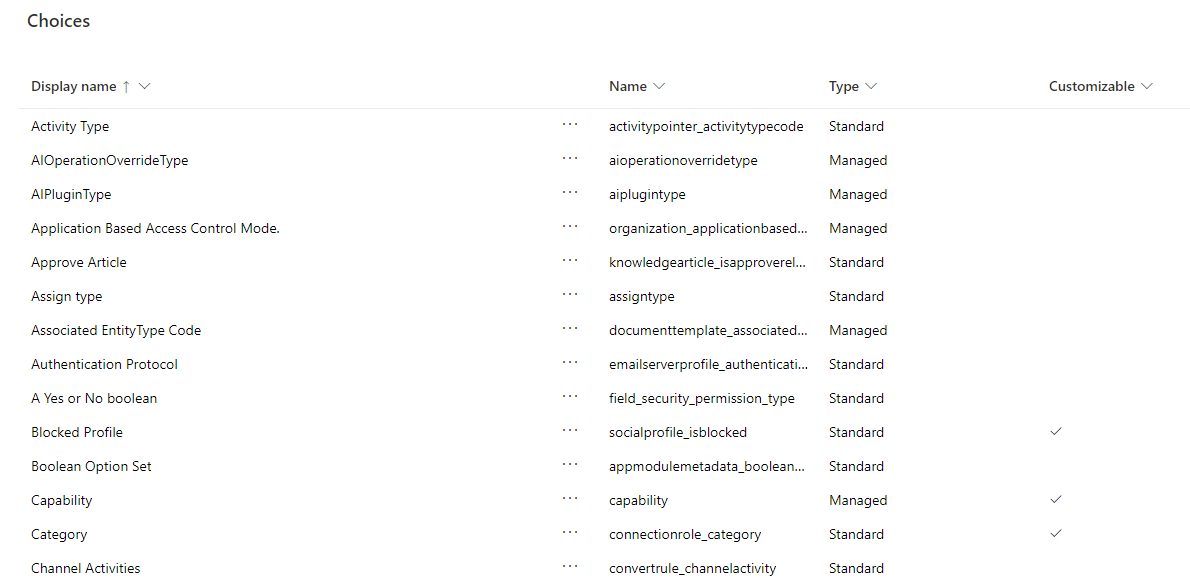
Task - Explore standard choices
Similar to standard tables, Microsoft Dataverse includes a set of standard choices. You can also create custom choices. Later in this lab, you create a custom choice called ApprovalStatus to set the approval status of a machine order.
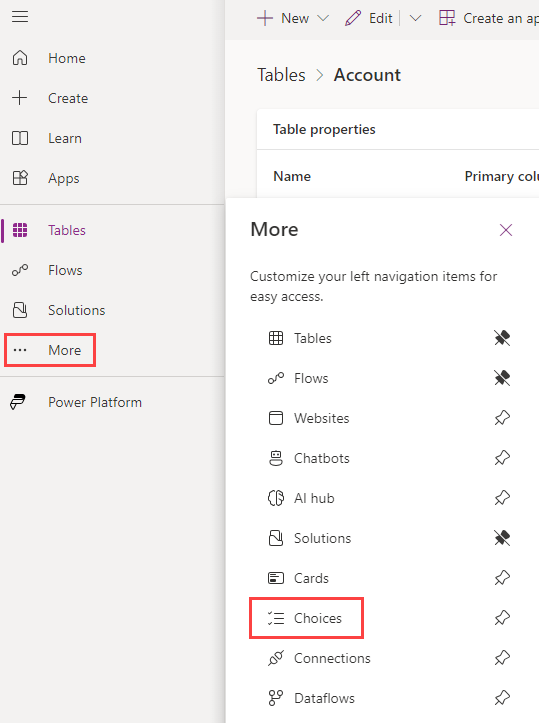
Select Choices from the navigation pane to the left of the screen. If you don't see Choices within the navigation pane, you might need to select More.
Examine the standard choices.