Use centralized monitoring in a scalable way
Relecloud provides managed services for other customers, alongside Microsoft’s Lamna Healthcare. At Relecloud, you want to monitor delegated resources across all customer tenants. Now, you’ll investigate how to create Log Analytics workspaces for Azure Monitor logs and deploy policies that help log data. You can then analyze all of the collected data across customer tenants. You’ll also explore how to query the activity log and enable access to tenant scoped data, so you can monitor delegation changes by customers for your tenant.
How Relecloud benefits from Azure Lighthouse
Azure Lighthouse is changing the way that managed service providers (MSPs) operate their business through its model of centralized multitenant management. Azure Lighthouse is a stronger and more secure access mechanism than Microsoft Entra B2B (Microsoft Entra B2B).
Azure Lighthouse has been beneficial to Relecloud, as it helps them to profitably and efficiently build and deliver managed services for customers like Microsoft’s Lamna Healthcare with a single pane.
Relecloud provides managed services to multiple businesses more securely without having to switch accounts, directories, or subscriptions.
Use Log Analytics workspaces
To collect data across customer tenants, you’ll need to create Log Analytics workspaces in Azure. These workspaces are separate environments that are used for data collection by Azure Monitor. Every workspace has its own configuration and repository for collected data. When you configure data sources with workspaces, the data will be stored in its assigned workspace.
We recommend that you create workspaces directly in customer tenants. This will help ensure that each customer's data remains in their tenant. This way, you achieve centralized monitoring for services and resources.
You can create Log Analytics workspaces through the Azure portal, Azure CLI, or Azure PowerShell.
In the following video, you’ll see how to create a Log Analytics workspace using the Azure portal.
Note
This is a silent video. You'll find additional information in captions where applicable.
Deploy policies to log data
Policies help your company to stay compliant with corporate standards and its service level agreements with customers. After you've created the Log Analytics workspaces, you can deploy policies through Azure Policy to ensure that diagnostic information is always sent to the correct workspace in each tenant. You can use Azure Policy to create and manage policies in Azure. Perform the following steps to create policies:
- Create a policy definition to specify what actions are enforced and under which conditions.
- Create an assignment to specify which resources or subscription the policy definition should be enforced on.
You can create policies using tools like the Azure portal, Azure CLI, and PowerShell.
Policy details will vary based on the customer and the resource types you're monitoring. You'll have to determine the policies you want to deploy depending on your needs.
Your company provides different kinds of managed services for customers, so you'll manage a variety of resources. You can use the Azure Diagnostics Policy Generator community tool to apply policies across many different Azure resource types at the same time. The tool is available on GitHub. There's a process you must follow to configure and use this tool. At a higher level, perform the following steps:
Run the Create-AzDiagPolicy.PS1 script using Azure PowerShell. This script creates policies for any Azure resource types that support Azure Diagnostics metrics and logging, and feeds data into Log Analytics or Event Hubs for you. Run the following command in Azure PowerShell to execute this script and ensure diagnostics are always fed into Log Analytics:
.\Create-AzDiagPolicy.ps1 -ExportAll -ExportLA -ValidateJSON -ManagementGroup -AllRegions -ExportInitiative -InitiativeDisplayName "Azure Diagnostics Policy Initiative for a Log Analytics Workspace" -TemplateFileName 'YourTemplate'When it finishes running, this script creates a Resource Manager template. The template will apply the policies across resources. You then deploy the template to Azure.
Select-AzSubscription -Subscription "<subscription-id>"

New-AzDeployment -Name "<Deployment Name>"-TemplateFile .\YourTemplate.json -Location 'West US' -Verbose
Run the Trigger-PolicyEvaluation.ps1 script to trigger an evaluation that returns information on compliance with the policies. Run the following command to trigger an evaluation at a subscription level:
.\Trigger-PolicyEvaluation.ps1 -SubscriptionId "<subscription-id>"Run the Trigger-PolicyInitiativeRemediation.PS1 script. This script ensures that all policies receive remediation if they aren't compliant. It will launch a remediation process for every policy to try and bring all resources into full compliance with each policy. Run the following command to run the script at a subscription level:
.\Trigger-PolicyInitiativeRemediation.ps1 -SubscriptionId "<subscription-id>"After you’ve executed the remediation script, use the Azure portal to review your remediation tasks and look out for any other issues that need manual remediation.
Analyze logged data
When you've deployed policies, data collected will be logged to the workspaces created for each customer. You can analyze the data and get insight across all of your customers’ tenants using tools like Azure Monitor Workbooks.

You can share workbooks across the organization or with outside groups in the wider community.
In the following video, you’ll see how to create a new workbook using the Azure portal. You’ll also learn how to add a query to your workbook, and run it across customer workspaces.
Note
This is a silent video. You'll find additional information in captions.
Use multiple Log Analytics alerts
You can have multiple simultaneous Log Analytics alerts in place for different events. In your case, you want to ensure that an alert is raised anytime there’s suspicious activity on an Azure Key Vault, or if someone tries to submit a bad template for deployment.
There's a template that creates multiple alerts based on Kusto Query Language (KQL) queries. Use the multiple Log Analytics alerts template on GitHub. It defines both types of alerts for you.
Monitor delegation changes in the managing tenant
You want to always be aware of when customer resources or subscriptions have been delegated to your tenant through Azure Lighthouse’s delegated resource management, or when delegations have been removed.
You can use Azure’s activity log to monitor for delegation activity from customers. To access logs, you do the following.
Enable access to tenant scoped data
You must have an account in Azure that's assigned with the Monitoring Reader built-in role set at the root scope of the managing tenant to access activity log data. Any administrator user who has the Global administrator role can assign this type of role, along with elevated access.
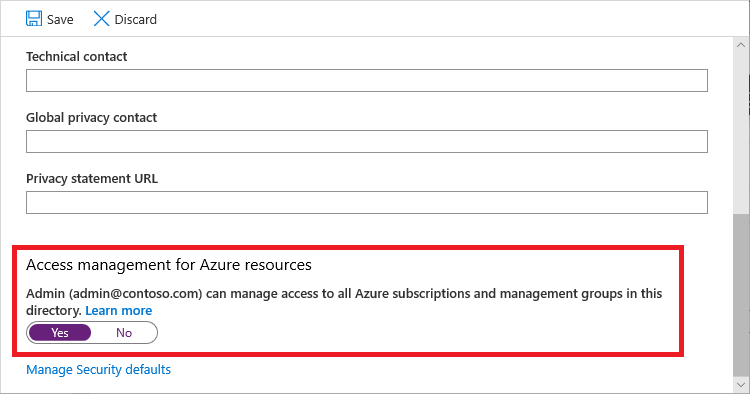
If you're a Global administrator, you can elevate access by enabling Access management for Azure resources in the Properties pane of your Microsoft Entra tenant.
You can then assign the Monitoring Reader role to the account you want to allow access to tenant-level data. You can assign the role by using tools like Azure CLI or Azure PowerShell. To assign a role using Azure PowerShell, run the following command:
# Log in first with Connect-AzAccount if you're not using Cloud Shell
New-AzRoleAssignment -SignInName <yourLoginName> -Scope "/" -RoleDefinitionName "Monitoring Reader" -ApplicationId $servicePrincipal.ApplicationId
We recommend that you assign this role to a service principal account rather than a single user or group of users. The service principal account should only be used for this particular function and not for anything else.
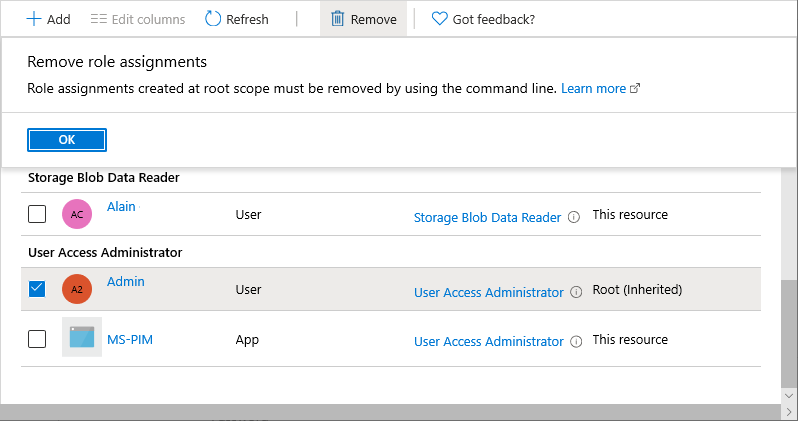
Elevated access must be removed after the role has been assigned to the service principal.
Query activity logs
After you've created a service principal account that has the Monitoring Reader level access, you can use it to report and query the tenant activity log for delegation activity.
The tenant activity log data returned contains useful information, including the following:
- A delegated resource group or subscription's ID
- A customer's Tenant ID
- Whether a delegation change was successful
- The time and date when a change in delegation was logged
You use an Azure PowerShell script to query the tenant activity log API in your managing tenant, and filter events related to customers who are registering or unregistering a delegation to your tenant. Write your script like this:
Define the time frame (in this case, the last day). Get your current Azure context and a token to make a call to the API:
# Azure Lighthouse: Query Tenant Activity Log for registered or unregistered delegations for the last 1 day

$GetDate = (Get-Date).AddDays((-1))

$dateFormatForQuery = $GetDate.ToUniversalTime().ToString("yyyy-MM-ddTHH:mm:ssZ")
# Getting Azure context for the API call

$currentContext = Get-AzContext

# fetching new token
$azureRmProfile = [Microsoft.Azure.Commands.Common.Authentication.Abstractions.AzureRmProfileProvider]::Instance.Profile
$profileClient = [Microsoft.Azure.Commands.ResourceManager.Common.RMProfileClient]::new($azureRmProfile)
$token = $profileClient.AcquireAccessToken($currentContext.Tenant.Id)

$listOperations = @{
    Uri     = "https://management.azure.com/providers/microsoft.insights/eventtypes/management/values?api-version=2015-04-01&`$filter=eventTimestamp ge '$($dateFormatForQuery)'"
    Headers = @{
        Authorization  = "Bearer $($token.AccessToken)"
        'Content-Type' = 'application/json'
    }
    Method  = 'GET'
}
$list = Invoke-RestMethod @listOperations
Aggregate all the tenant activity data:
# While you get data - continue fetching and add results
while($list.nextLink){
    $list2 = Invoke-RestMethod $list.nextLink -Headers $listOperations.Headers -Method Get
    $data+=$list2.value;
    $list.nextLink = $list2.nextlink;
}

$showOperations = $data;
Output information on any customer who has delegated resources to the Azure tenant:
if ($showOperations.operationName.value -eq "Microsoft.Resources/tenants/register/action") {
    $registerOutputs = $showOperations | Where-Object -FilterScript { $_.eventName.value -eq "EndRequest" -and $_.resourceType.value -and $_.operationName.value -eq "Microsoft.Resources/tenants/register/action" }
    foreach ($registerOutput in $registerOutputs) {

        $eventDescription = $registerOutput.description | ConvertFrom-Json;

    $registerOutputdata = [pscustomobject]@{
        Event                    = "An Azure customer has registered delegated resources to your Azure tenant";
        DelegatedResourceId      = $eventDescription.delegationResourceId;
        CustomerTenantId         = $eventDescription.subscriptionTenantId;
        CustomerSubscriptionId   = $eventDescription.subscriptionId;
        CustomerDelegationStatus = $registerOutput.status.value;
        EventTimeStamp           = $registerOutput.eventTimestamp;
        }
        $registerOutputdata | Format-List
    }
}
This helps you see details like the following:
Detail Description DelegatedResourceId The ID for any resource or subscription that has been delegated CustomerTenantId The customer tenant ID CustomerSubscriptionId The customer's subscription ID CustomerDelegationStatus The new status for the delegation of the resource EventTimeStamp When the action took place Output the same information on any customer who has unregistered delegated resources from your tenant:
if ($showOperations.operationName.value -eq "Microsoft.Resources/tenants/unregister/action") {
    $unregisterOutputs = $showOperations | Where-Object -FilterScript { $_.eventName.value -eq "EndRequest" -and $_.resourceType.value -and $_.operationName.value -eq "Microsoft.Resources/tenants/unregister/action" }
    foreach ($unregisterOutput in $unregisterOutputs) {
        $eventDescription = $registerOutput.description | ConvertFrom-Json;
    $unregisterOutputdata = [pscustomobject]@{
        Event                    = "An Azure customer has unregistered delegated resources from your Azure tenant";
        DelegatedResourceId      = $eventDescription.delegationResourceId;
        CustomerTenantId         = $eventDescription.subscriptionTenantId;
        CustomerSubscriptionId   = $eventDescription.subscriptionId;
        CustomerDelegationStatus = $unregisterOutput.status.value;
        EventTimeStamp           = $unregisterOutput.eventTimestamp;
        }
        $unregisterOutputdata | Format-List
    }
}
else {
    Write-Output "No new delegation events for tenant: $($currentContext.Tenant.TenantId)"
Additional tools
You can use various tools in Azure that naturally integrate with Azure Lighthouse. Use these tools to help monitor customer tenants:
- Use Azure Monitor alerts to help you monitor for alerts across customers. Your alerts are accessible from one Log Analytics workspace. You’ll also help customers to stay compliant, because log data never leaves their subscriptions.
- Use Azure Automation to create runbooks that are stored in your subscriptions while they perform actions on customers' subscriptions. This way, your company's intellectual property never leaves your tenant, but customers still benefit from your runbooks.
- Use Azure Resource Graph Explorer to query for Azure resources across all customer tenants. You might want to find out which virtual machines belong to which customer. You can write a straightforward query to fetch a list of these machines, then export the information to a
.csvfile for further analysis.