Azure Monitor for SAP Solutions concepts
Azure Monitor for SAP Solutions uses existing Azure Monitor features such as Log Analytics and Workbooks to provide more monitoring capabilities. For example:
Use an Azure Log Analytics workspace to:
Create custom visualizations by editing default Workbooks
Write custom queries
Creating custom alerts
Take advantage of the flexible retention period
Connect monitoring data with their ticketing system.
What data does Azure Monitor for SAP Solutions collect?
Azure Monitor for SAP solutions doesn't collect Azure Monitor metrics or resource log data, like some other Azure resources do. Instead, it sends custom logs directly to the Azure Monitor Logs system. There, you can use the built-in features of Log Analytics.
Data collection in Azure Monitor for SAP solutions depends on the providers that you configure. The following data is collected for each provider.
HA Pacemaker cluster data
- Node, resource, and SBD status
- Pacemaker location constraints
- Quorum votes and ring status
Also see the metrics specification for ha_cluster_exporter.
SAP HANA data
- CPU, memory, disk, and network use
- HANA system replication
- HANA backup
- HANA host status
- Index server and name server roles
- Database growth
- Top tables
- File system use
Microsoft SQL Server data
- CPU, memory, and disk use
- Host name, SQL instance name, and SAP system ID
- Batch requests, compilations, and page life expectancy over time
- Top 10 most expensive SQL statements over time
- Top 12 largest tables in the SAP system
- Problems recorded in the SQL Server error log
- Blocking processes and SQL wait statistics over time
OS (Linux) data
- CPU use, fork count, running processes, and blocked processes
- Memory use and distribution among used, cached, and buffered
- Swap use, paging, and swap rate
- File system usage, along with number of bytes read and written per block device
- Read/write latency per block device
- Ongoing I/O count and persistent memory read/write bytes
- Network packets in/out and network bytes in/out
SAP NetWeaver data
- SAP system and application server availability, including instance process availability of:
- Dispatcher
- ICM
- Gateway
- Message server
- Enqueue server
- IGS Watchdog
- Work process usage statistics and trends
- Enqueue lock statistics and trends
- Queue usage statistics and trends
- SMON metrics (/SDF/SMON)
- SWNC workload, memory, transaction, user, and RFC usage (St03n)
- Short dumps (ST22)
- Object lock (SM12)
- Failed updates (SM13)
- System log analysis (SM21)
- Batch job statistics (SM37)
- Outbound queues (SMQ1)
- Inbound queues (SMQ2)
- Transactional RFC (SM59)
- STMS change transport system metrics (STMS)
IBM Db2 data
- Database availability
- Number of connections, logical reads, and physical reads
- Waits and current locks
- Top 20 runtimes and executions
Data sharing with Microsoft
Azure Monitor for SAP Solutions collects system metadata to provide improved support for our SAP on Azure customers. No PII/EUII is collected. To enable data sharing with Microsoft when creating an Azure Monitor for SAP Solutions resource, select Share from the drop-down.
We recommend that you enable data sharing, as it helps Microsoft provide improved support to our mission-critical SAP on Azure customers.
Architecture overview
The following diagram shows, at a high level, how Azure Monitor for SAP solutions collects data from the SAP HANA database. The architecture is the same whether SAP HANA is deployed on Azure Virtual Machines or Azure Large Instances.
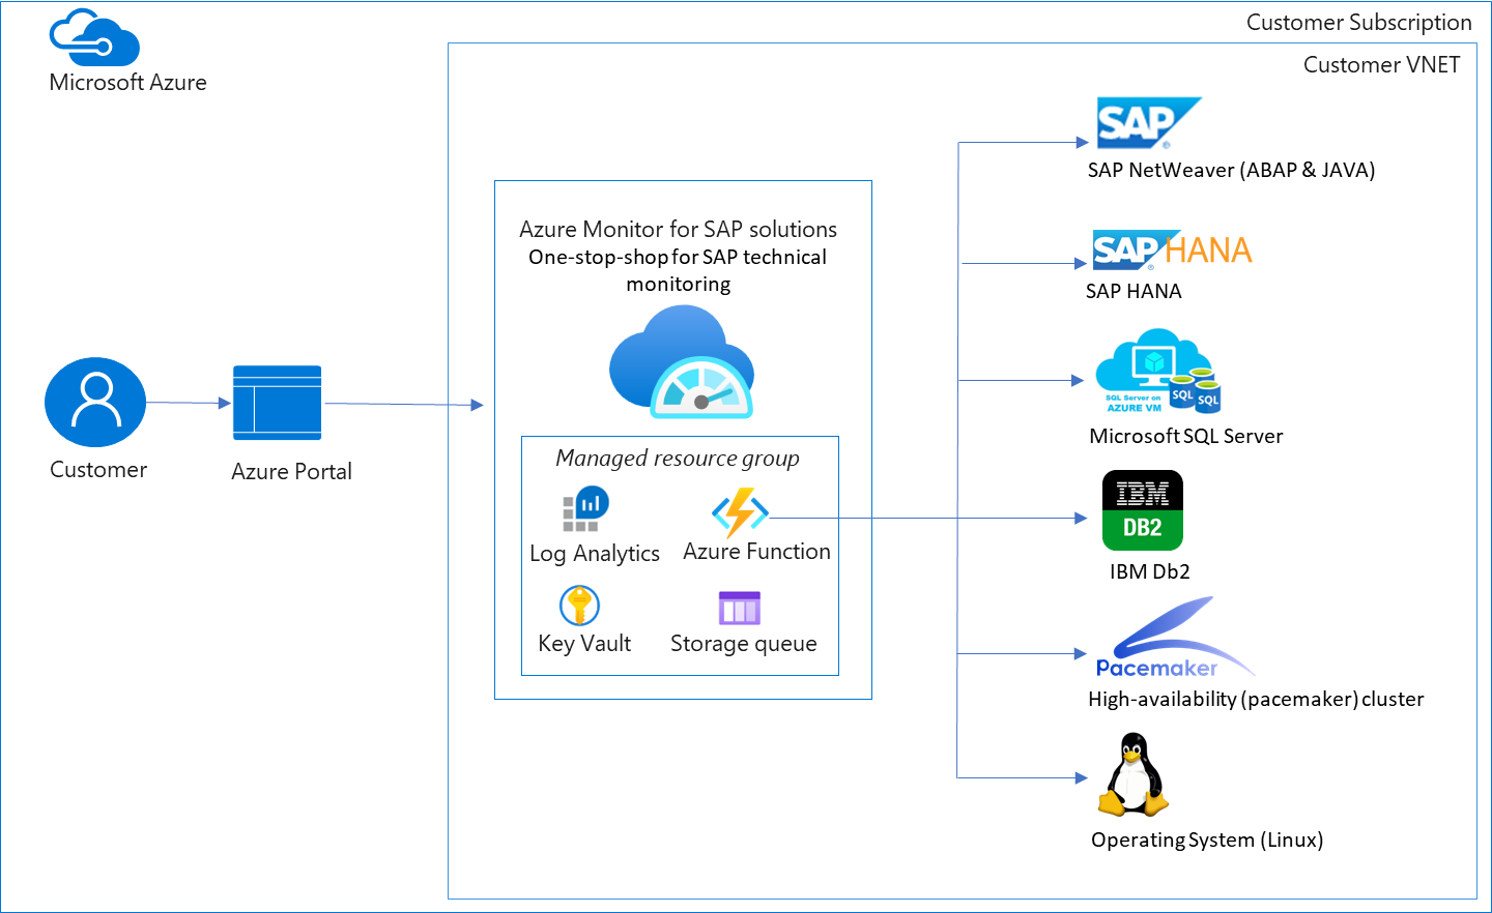
Important points about the architecture include:
You can monitor multiple instances of a component type across multiple SAP systems (SIDs) within a virtual network by using a single resource of Azure Monitor for SAP solutions. For example, you can monitor multiple HANA databases, HA clusters, Microsoft SQL Server instances, and SAP NetWeaver systems of multiple SIDs.
The architecture diagram shows the SAP HANA provider as an example. You can configure multiple providers for corresponding components to collect data from those components. Examples include HANA database, HA cluster, Microsoft SQL Server instance, and SAP NetWeaver.
Key components of the architecture
The Azure portal, where you access Azure Monitor for SAP solutions.
The Azure Monitor for SAP solutions resource, where you view monitoring data.
The managed resource group, which is deployed automatically as part of the Azure Monitor for SAP solutions resource's deployment. Inside the managed resource group, resources like these help collect data:
An Azure Functions resource hosts the monitoring code. This logic collects data from the source systems and transfers the data to the monitoring framework.
An Azure Key Vault resource holds the SAP HANA database credentials and stores information about providers.
A Log Analytics workspace is the destination for storing data. Optionally, you can choose to use an existing workspace in the same subscription as your Azure Monitor for SAP solutions resource at deployment.
A storage account is associated with the Azure Functions resource. It's used to manage triggers and executions of logging functions.
Azure Monitor workbooks provide customizable visualization of the data in Log Analytics. To automatically refresh your workbooks or visualizations, pin the items to the Azure dashboard. The maximum refresh frequency is every 30 minutes.
You can also use Kusto Query Language (KQL) to run log queries against the raw tables inside the Log Analytics workspace.
Monitoring requirements of Azure for SAP Workloads
According to SAP Note #2015553, for full support, you must enable built-in SAP monitors to retrieve information about configuration and resource utilization from the underlying Azure infrastructure. You must set up every Azure instance that hosts SAP software and related DBMS systems such that:
The Azure Monitoring Extension for SAP is deployed and correctly configured.
Data from the Azure Monitoring Extension for SAP is visible in the SAP NetWeaver system.
The following are technical requirements for using the Azure Monitoring Extension for SAP:
The Azure virtual machine instance has an active route to the Internet (required for accessing the Azure Extension Pool). If you need to set up Internet proxies for the virtual machine instance before you deploy the extension.
SAP Enhanced Monitoring is deployed. To include Azure performance counters in the SAP enhanced monitoring, SAP has enhanced the SAP Host Agent and its monitoring transaction ST06. Be sure to check the configuration, the required versions, and minimum support package levels. For more information, see the following SAP Notes:
Windows: SAP Note #1409604 (Virtualization on Windows: Enhanced monitoring)
Linux: SAP Note #1102124 (SAPOSCOL on Linux: Enhanced function)