Explore model-driven applications
Unlike canvas apps where the app maker has control over the data sources, screen layout, and overall user experience, model-driven apps are always built from data in Microsoft Dataverse. Model-driven apps use a data first design, where app design focuses on adding components such as forms, views, charts, and dashboards to tables using an app designer tool. With model-driven apps, there's no need to worry about choosing the app size. They're responsive, which means that they work and display appropriately whether being accessed through a browser, a mobile phone, or tablet.
Model-driven applications are used as management applications. For example, when someone reports a problem with audio/visual equipment, they use a canvas application. To manage the incoming requests, assist users with troubleshooting, dispatch someone to fix them, and analyze overall operations related to the organization, organizations typically use a model driven app. Dashboards and charts let managers see overall performance such as how many issues are being reported and how they're being resolved. Support users can easily identify incoming requests and provide support directly from within the application.
You define the relationships, forms, views, business rules, and more at the data layer inside of the Dataverse. These definitions give you enough control to achieve the business result you're looking for without needing to write all the formulas yourself.
Here's an example of a fundraiser donations tracking model-driven app.
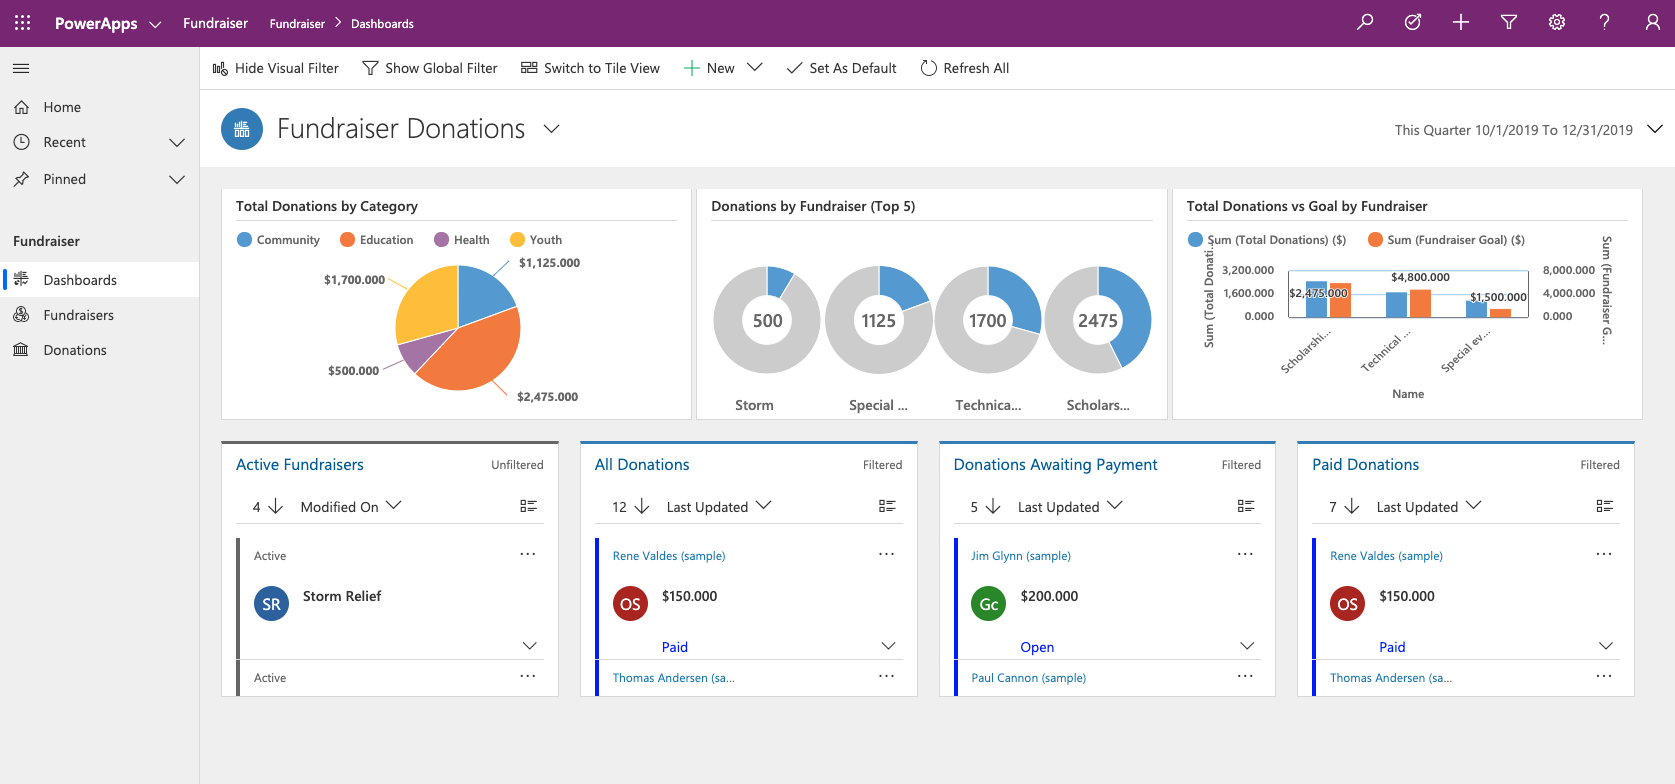
The fundraiser donations dashboard lets managers easily see details related to incoming donations based on different fundraisers the organization ran. Using the charts provided, managers can easily examine different donations based on the donation category, donation totals for each fundraiser, and even compare the actual donation totals vs the donation goals.
Additionally, they can easily create and manage fundraisers directly from the application and dive into each individual donation provided.
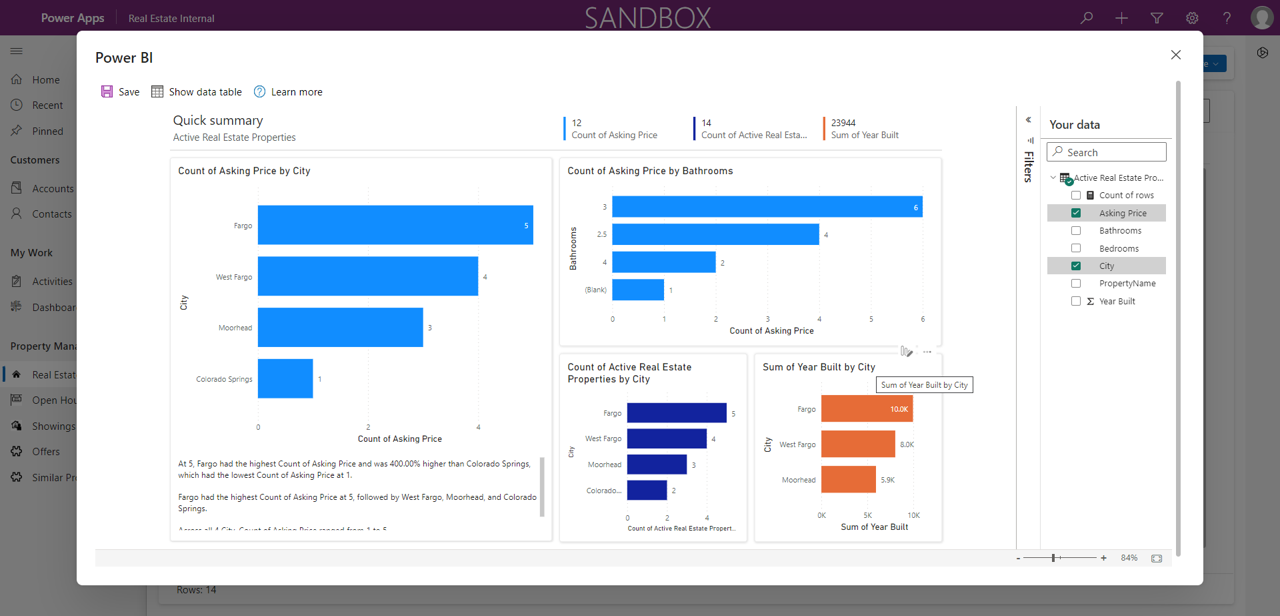
Model-driven applications provide various different analytic options. Organizations can easily export data to Microsoft Excel, or they can iusePower BI integration to create Power BI reports from their business data directly from their model app.
In the example, a real-estate manager used the Visualize this view button to generate a property listings report in Power BI that breaks down different its real estate data in different ways.