Monitor an Azure Stack HCI cluster
One of the challenges that Contoso struggles with is its diverse, fragmented computing environment, which lacks a unified monitoring and management solution. As recent outages have demonstrated, implementing such a solution is essential to comply with service-level agreements for mission critical workloads and to provide a timely response to issues affecting workload availability. As part of evaluating Azure Stack HCI functionality, you decide to explore cluster monitoring options. You also want to identify a solution that can provide a single pane of glass solution for monitoring a wide range of hardware and software resources, including Azure Stack HCI clusters, present in Contoso's on-premises datacenters.
Overview of Azure Stack HCI cluster monitoring
Because of the relatively complex architecture of Azure Stack HCI, a comprehensive monitoring approach should provide visibility into all of its interrelated components, including:
- Clusters
- Cluster nodes
- Volumes
- Drives
- Virtual machines (VMs)
You can implement such an approach by using the built-in capabilities of Windows Admin Center, Microsoft Azure Monitor, or PowerShell.
Monitor Azure Stack HCI by using Windows Admin Center
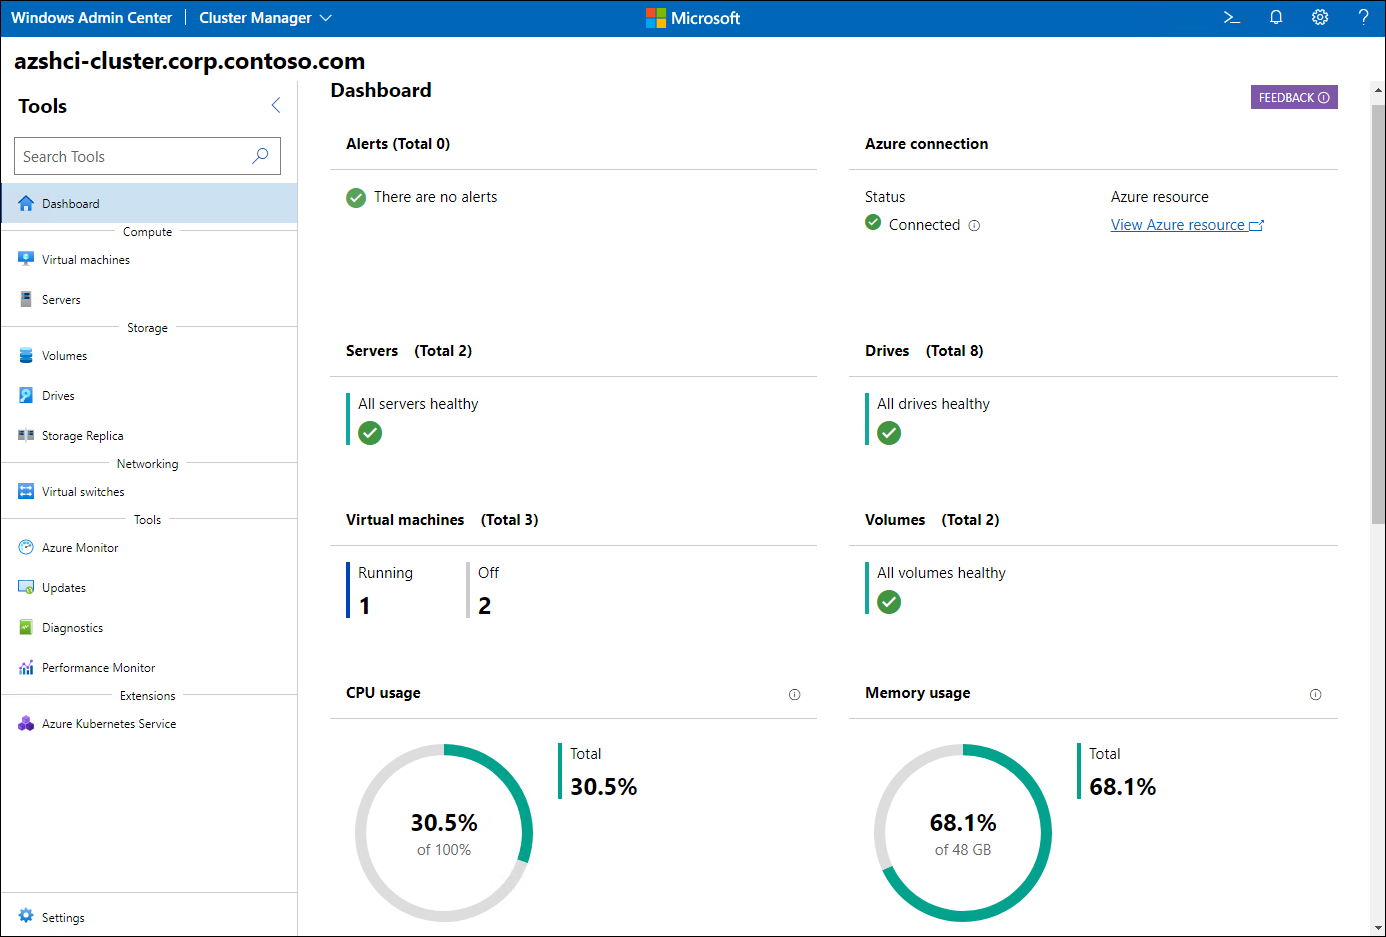
Windows Admin Center offers predefined dashboards that allow you to quickly assess the status and performance of a cluster and its components. Data presented by dashboards becomes available as soon as you connect to the target cluster.
Monitor a cluster by using Windows Admin Center
The Cluster Manager interface of Windows Admin Center includes a dashboard that displays information about cluster status and performance, including:
- Cluster-related alerts
- List of cluster nodes
- List of disks and volumes available on the cluster
- List of VMs hosted on the cluster
- Total cluster CPU usage (aggregated across all cluster nodes)
- Total cluster memory usage (aggregated across all cluster nodes)
- Total cluster storage usage (aggregated across all cluster nodes)
- Total number of input/output operations per second (IOPS) across cluster nodes
- Average latency of disk operations (in milliseconds) across cluster nodes
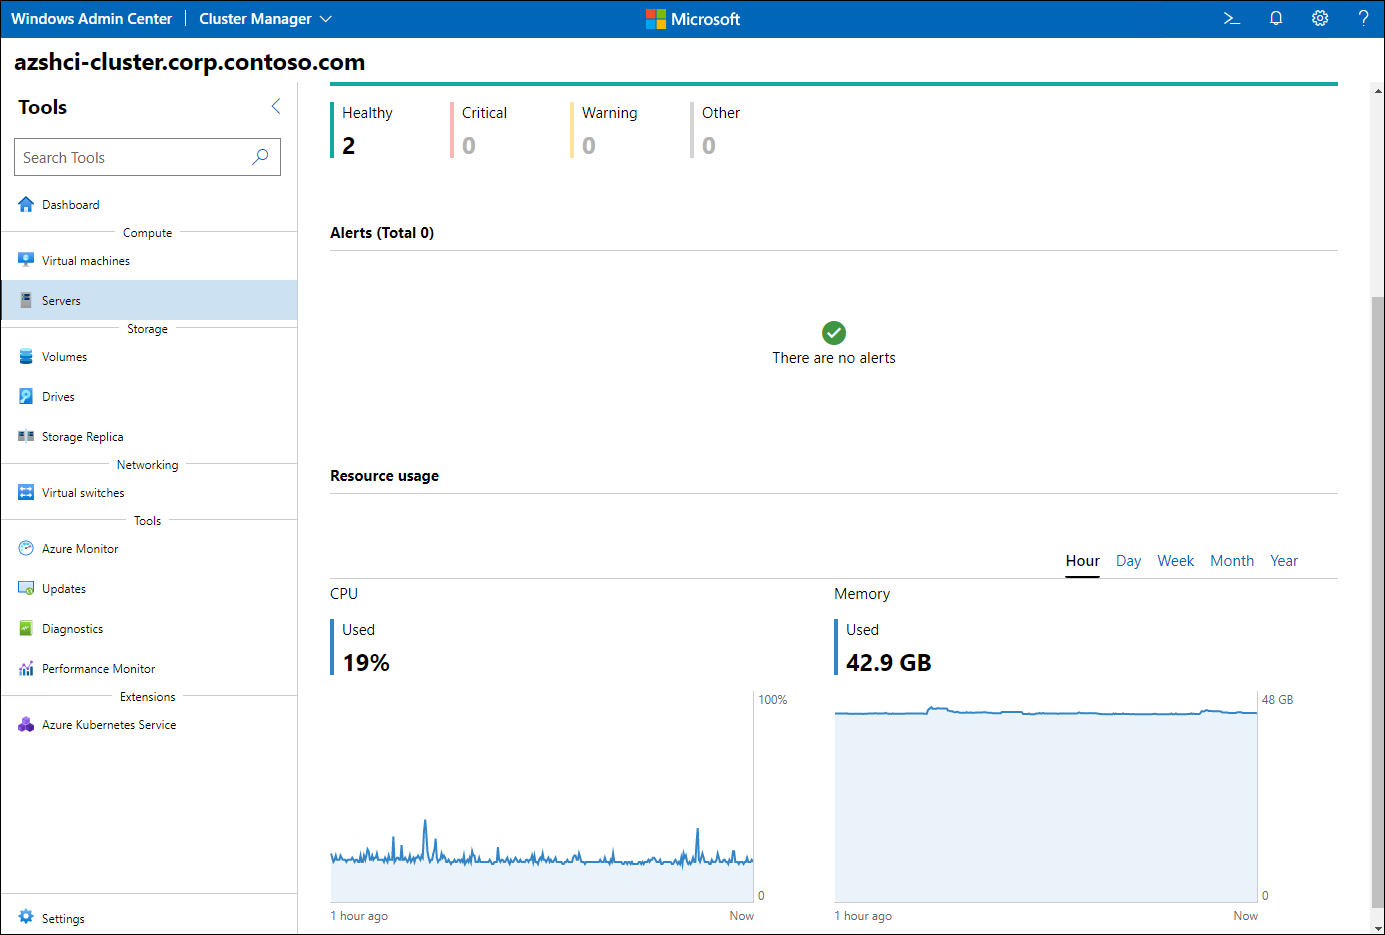
Monitor cluster nodes
After you connect to a cluster by using Windows Admin Center, you can access the Servers pane through the Tools menu. The Inventory tab on the Servers pane allows you to display information about each server that is a member of the Azure Stack HCI cluster, including:
- Name
- Operating system status
- Operating system uptime
- Hardware manufacturer, model, and the serial number
- CPU and memory utilization
Note
For each server, you can configure monitoring of individual performance metrics from the Performance Monitor pane in Windows Admin Center.
Note
You should investigate server performance if its CPU utilization exceeds 85 percent or its available memory drops below 100 MB for 10 minutes or longer.
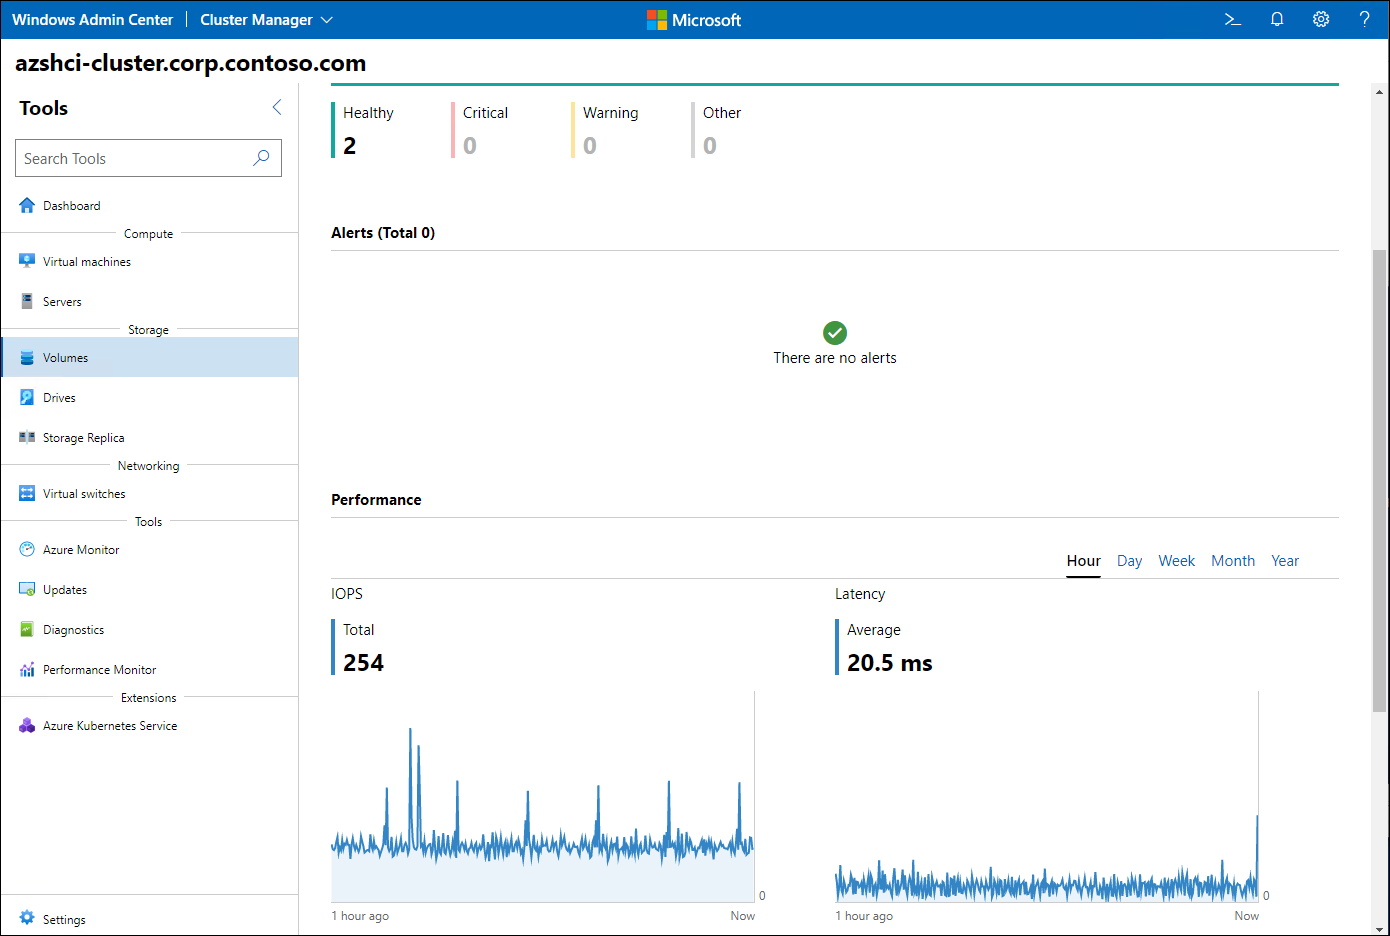
Monitor cluster volumes
After you connect to a cluster, you also have access to the Volumes pane in its Tools menu. The Inventory tab on that pane allows you to display information about each volume that is part of the cluster's Storage Spaces Direct storage pools, including:
- Name
- Status
- File system (ReFS or CSVFS)
- Resiliency (two-way mirror, three-way mirror, or mirror-accelerated parity)
- Total size and used space
- Storage pool that the volume is part of
- Performance in IOPS
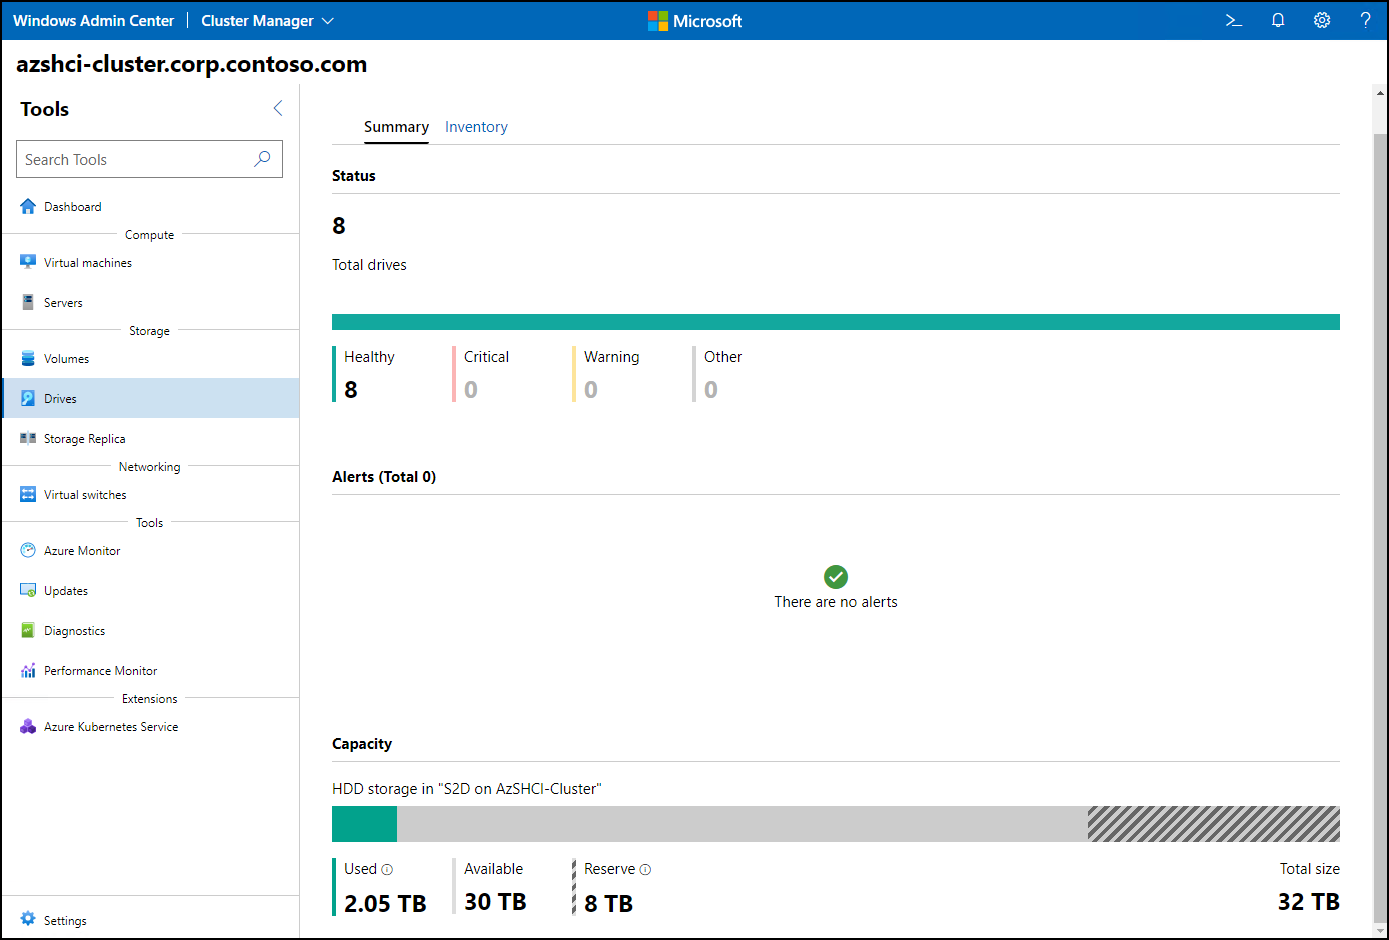
Monitor cluster drives
To quickly evaluate the status of all physical drives connected to cluster nodes, after you connect to a cluster by using Windows Admin center, browse to the Drives pane through the Tools menu. The Inventory tab on the Drivers pane allows you to display information about each drive, including:
- Model and serial number
- Status
- Total size and used space
- Type (SSD or HDD)
- Usage (cache or capacity)
- Location (storage adapter and port) and the server to which the drive is connected
- Storage pool that the drive is part of
Monitor clustered VMs
You also have the option to review the status and performance of VMs running within the cluster. To accomplish this, after you connect to a cluster by using Windows Admin center, browse to the Virtual machines pane through the Tools menu. The Inventory tab on that pane allows you to display information about each VM, including:
- Name
- VM status (running or stopped)
- Host server on which the VM is running
- Operating system uptime
- Heartbeat status
- Disaster recovery status
- CPU and memory performance metrics
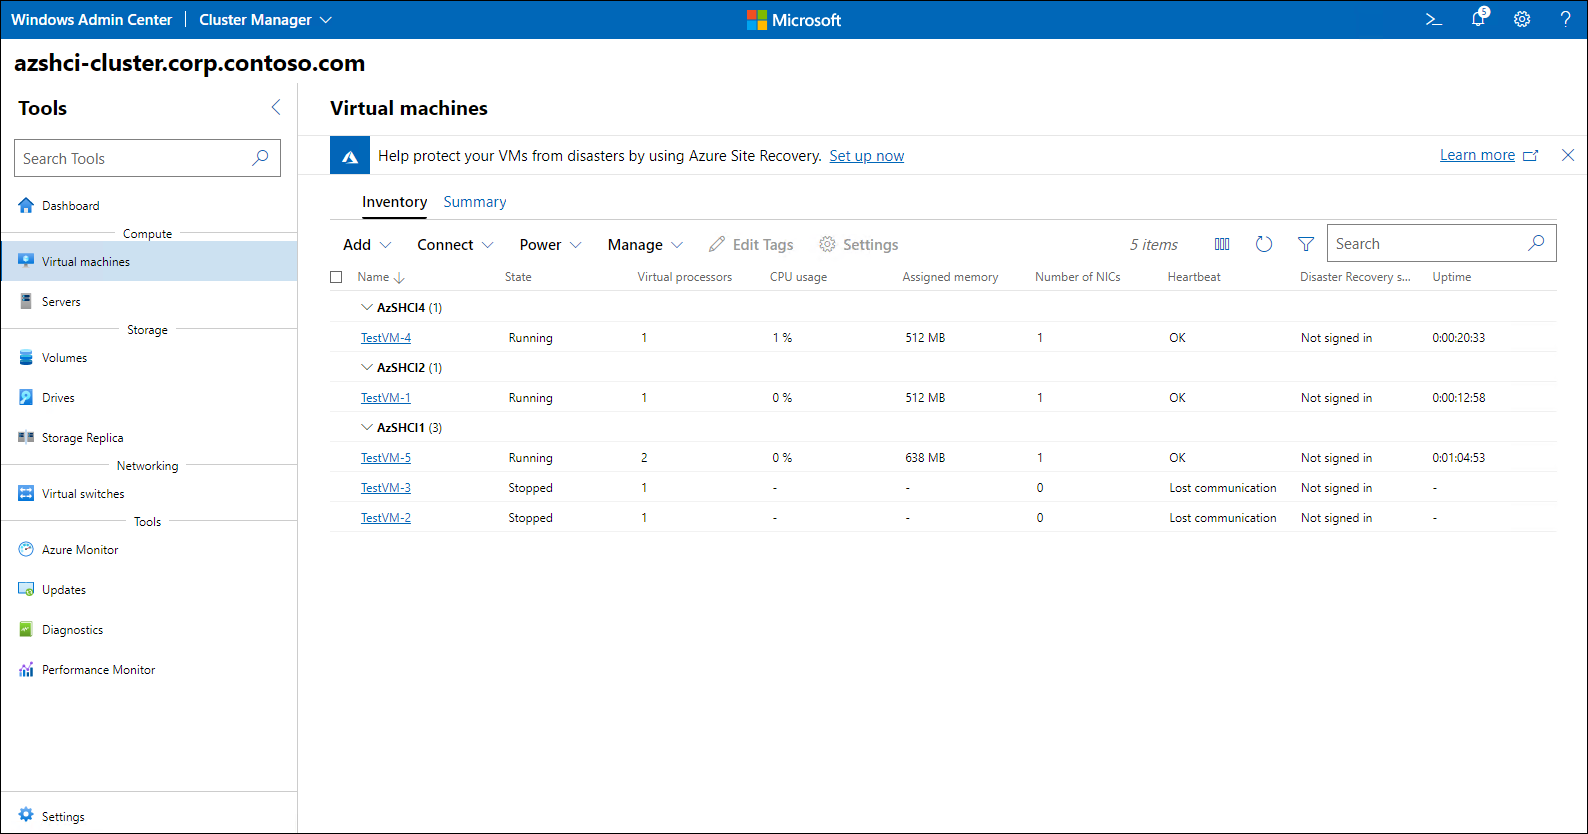
Note
The cluster relies on periodic checks, referred to as heartbeats, to validate the availability of its VMs.
Monitor Azure Stack HCI by using Azure Monitor
You can make more in-depth monitoring, alerting, and log analytics available by integrating Azure Stack HCI with Azure Monitor. The simplest way to onboard your cluster to Azure Monitor is by using Windows Admin Center, which first provisions a Log Analytics workspace in the target Azure subscription, and then configures the Health Service and installs the required agents on each cluster node.
Note
The Health Service enhances monitoring of Storage Spaces Direct.
After the onboarding process is complete, the cluster nodes will start forwarding telemetry and logs to Azure Monitor. The Azure portal serves as the primary monitoring dashboard, displaying collected data on the Azure Monitor blades and allowing you to analyze it by running Log Analytics queries. Azure Monitor also gives you the option to implement metric- or log-based rules to trigger alerts and auto-remediation tasks.
Cloud-based monitoring might potentially eliminate the need for an on-premises monitoring system. Considering that Azure Monitor offers multi-platform support, Contoso could use it to implement a uniform monitoring solution across its diverse hardware and software resources.