Manage relationship health with Sales Insights
Do you have a good relationship with your customers? You might be surprised at how customers answer that question. While you may think that you have a great relationship, the customer could see it differently. There are many factors that can influence a relationship with a customer. Are you only reaching out to them during sales cycles? How quickly are you getting back to them? How quickly are they getting back to you? Dynamics 365 Sales Insights Premium Includes several features that can help build and sustain those relationships.
One of the key features is Relationship Analytics. Relationship Analytics examines all the communication that's taking place both from you to your customer, and also from your customer to you. It examines the number of emails, appointments, phone calls, and other activities initiated by your sales team and team members by the customer.
Important
Dynamics 365 Sales Insights Premium is a subscription based add on.
Relationship analytics
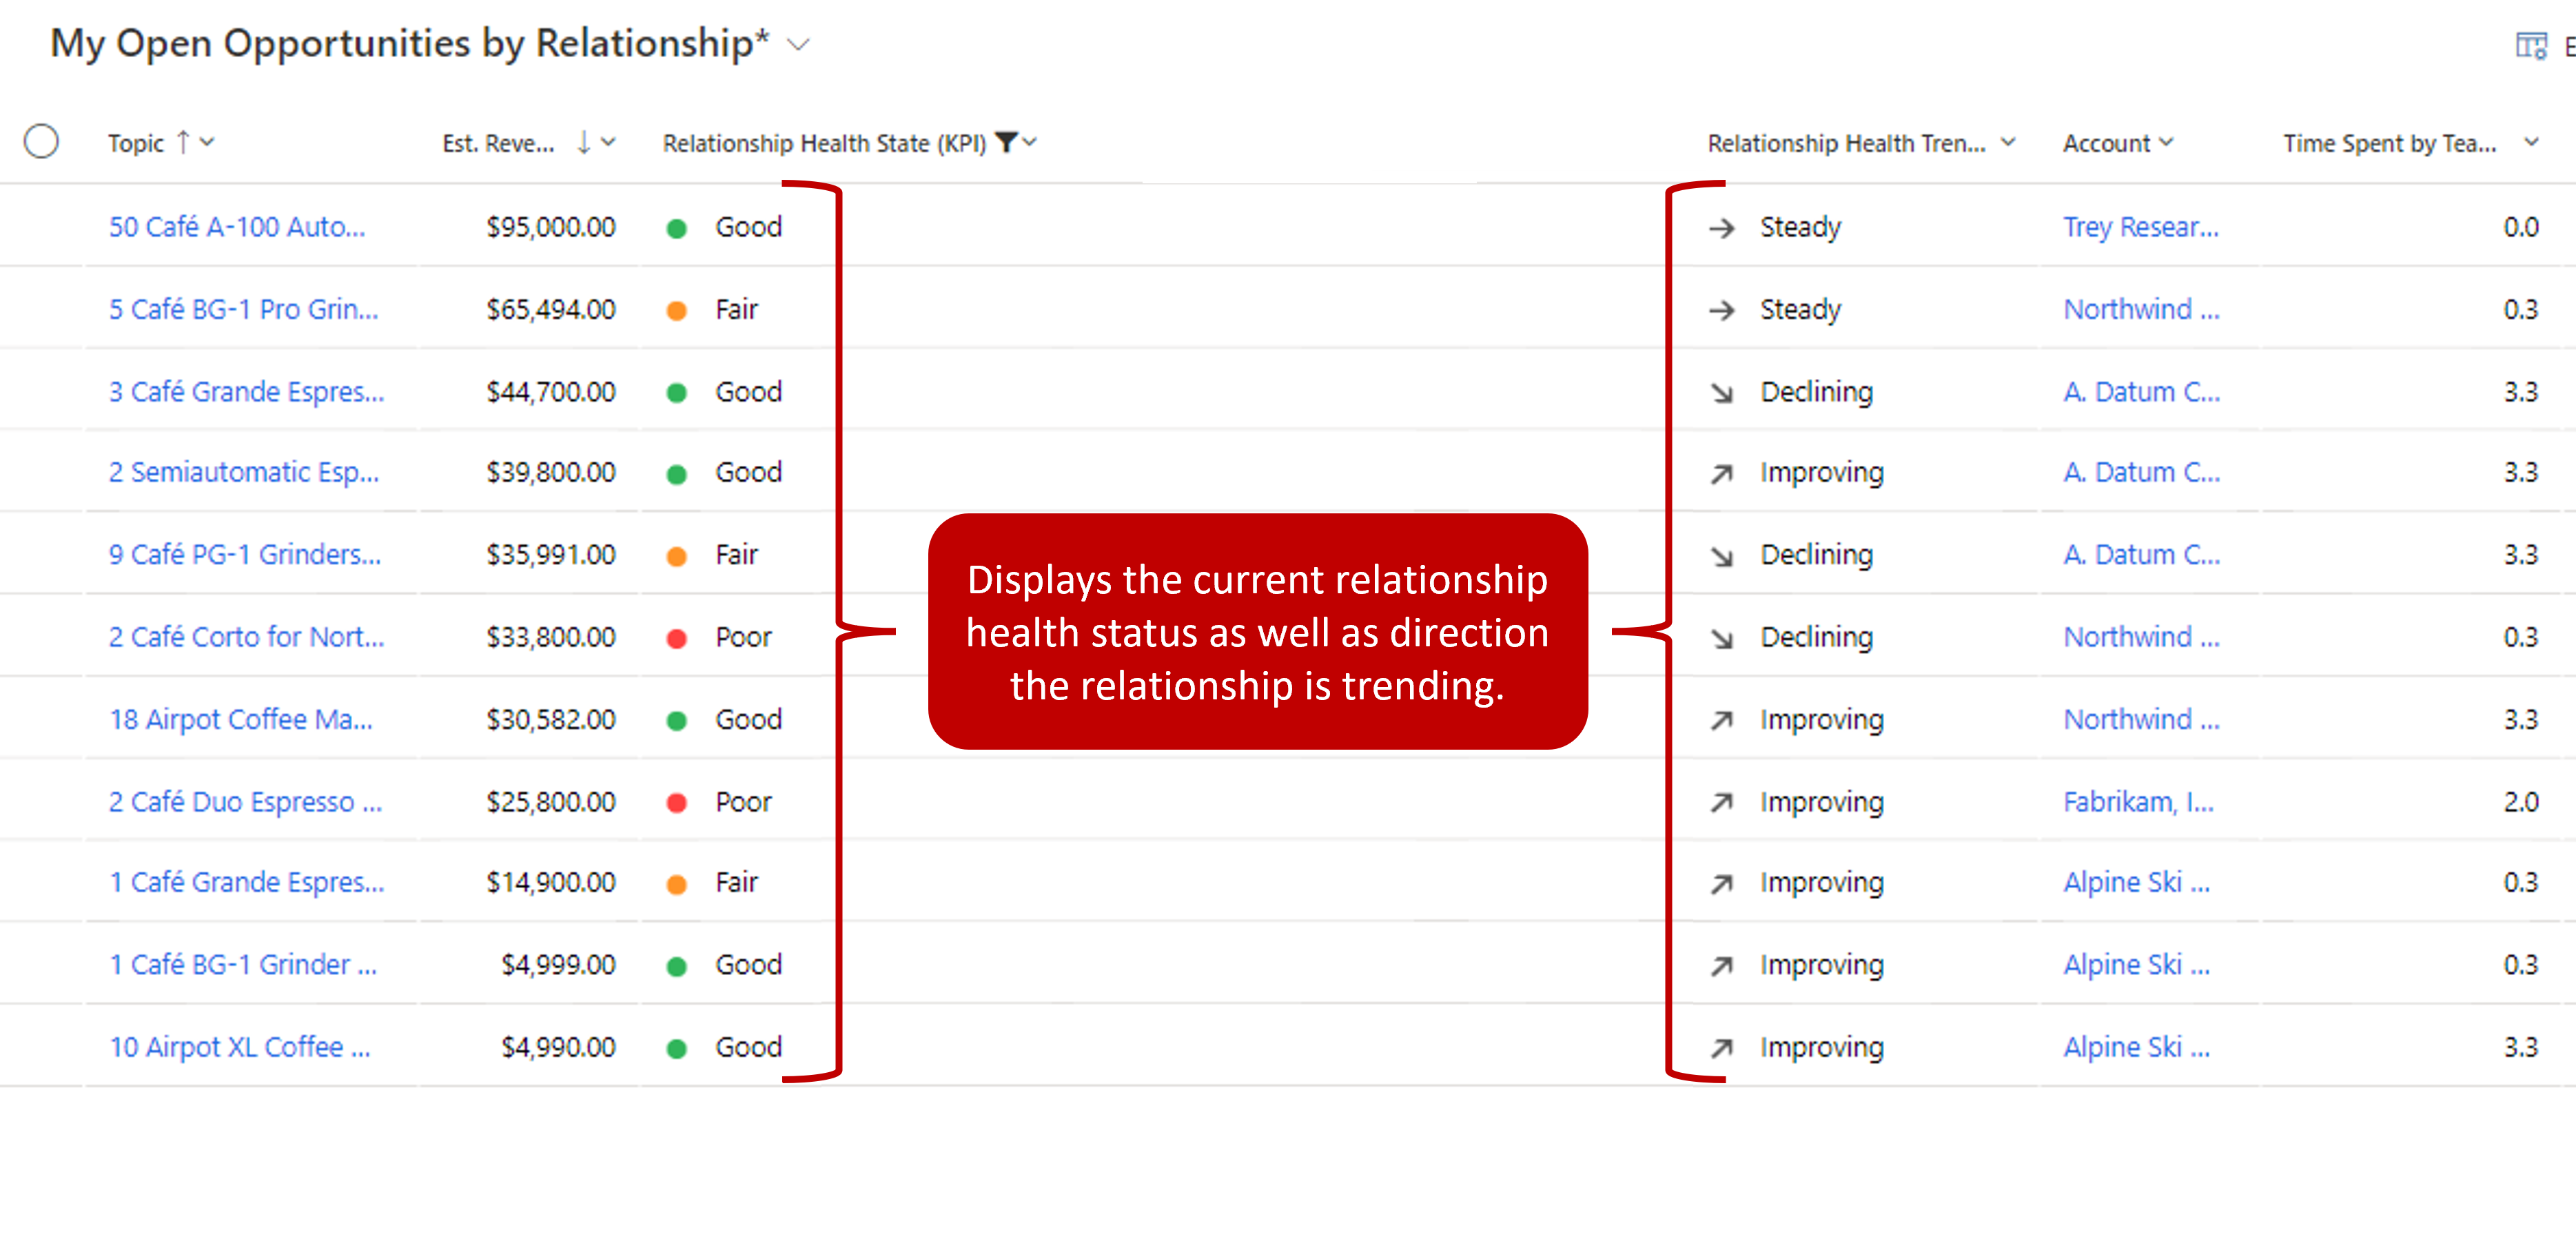
Relationship analytics provides an activity history, key performance indicators (KPIs), health score, and health trend for contact, opportunity, lead, and account records. The most important KPIs (including your team's previous and next activity) are shown in the list view for each of these record types, so you can get an overview and sort the list by them.
Relationship analytics help sales professionals and managers answer questions such as:
Do we have a good relationship with the customer?
How much time have we spent with our customer?
When was the last time we contacted them?
When is the next time we'll contact them?
How many emails and meetings have we exchanged?
What's the customer's response rate?
How many activities were initiated by the customer?
How long does it take our team to respond?
Which opportunities should I spend my time on?
When you're viewing a customer or an opportunity record, you can see complete analytics for individual records including graphs, KPIs, email interaction history, full activity history, and relationship health.
Summary: Provides metrics and key performance indicators (KPIs) that are computed from activities of current and past years.
Call comparison: Defines how the number of calls you've placed to the customer compares with the number they've placed to you.
Hour's comparison: Defines how much time your sellers have invested compares to the contact.
Response comparison: Defines how long it takes you to respond to communication compared to the contact.
Email response comparison: Defines how long it takes you to respond to emails vs the customer.
Relationship health: Display the overall health of your relationship with the customer based on opportunity and activity data. It also displays how the current relationship status is trending.
Customer interactions: Compares the number of interactions initiated by your sellers, to the number of interactions initiated by the contact.
Hourly investment: Compares the overall number of hours spent by your sellers on emails, phone calls, meetings, and tasks with the contact, to the number of hours spent by the contact.
Response Time: Compares the average time it takes for sellers to respond to emails from this contact, to the average time it takes this contact to respond to our emails.
Email send/receive ratio: Compares the ratio of the number of emails sent by you and received by the customer, to the number of emails sent by the customer and received by you.
Relationship activities: Provides a detailed look at activities over 90 days, broken down by date and activity type such as emails sent, emails received, meetings sent, meetings received, phone calls made, and phone calls received.
Predictive lead scoring
This model assigns a score between 0 to 100 for leads based on the signals from leads and related tables such as contact and account. Using these scores, you can identify and prioritize leads that have more chances of converting into opportunities.
For example, say you have two leads in your pipeline: Lead A and Lead B. The lead scoring model applies a score of 80 for Lead A and 50 for Lead B. By looking at the score, you can predict that Lead A has more chances of converting into an opportunity and you can engage it. Also, you can further analyze why the score of Lead B is low by looking at the top reasons influencing the score and deciding whether to improve this score.
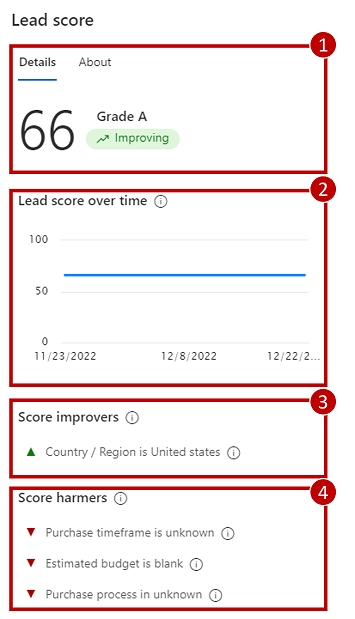
In forms, you can use the Lead Score widget to see the top 10 reasons that are influencing the score. These reasons come from the lead attributes and attributes from the related tables. This helps you to analyze and work on the lead to improve the score and convert it into a possible opportunity.
The following screen displays a typical Lead Score widget with reasons that influence the lead score.
Lead score: Displays the basic information of a lead such as lead score, lead grade, and lead score trend, to help you avoid going back to the My Open Leads Scored view to see basic information.
Lead score over time: Chart showcasing the leads score over the past month.
Score improvers Displays the list of reasons that are affecting the lead score in a positive way. This helps you to analyze and consider the lead for converting into an opportunity.
Score harmers: Displays the list of reasons that are affecting the lead score in a negative way.
Important
You need at least 40 qualified and 40 disqualified leads that we created in the past 2 years to create a model.
Predictive opportunity scoring
This model assigns a score between 0 and 100 for opportunities based on the signals from opportunities and related tables such as contact and account. Using these scores, you can identify and prioritize opportunities that have more chances of converting into wins.
For example, say you have two opportunities in your pipeline: Opportunity A and Opportunity B. The opportunity scoring model applies a score of 75 for Opportunity A and 55 for Opportunity B. By looking at the score, you can predict that Opportunity A has more chances of converting into a win deal and you can engage it. Also, you can further analyze why the score of Opportunity B is low by looking at the top reasons that are influencing the score and deciding how to improve this score.
Important
You need at least 40 qualified and 40 disqualified opportunities that we created in the past 2 years to create a model.
Notes analytics
Timeline control is available on contacts, opportunities, leads, accounts, and case forms.
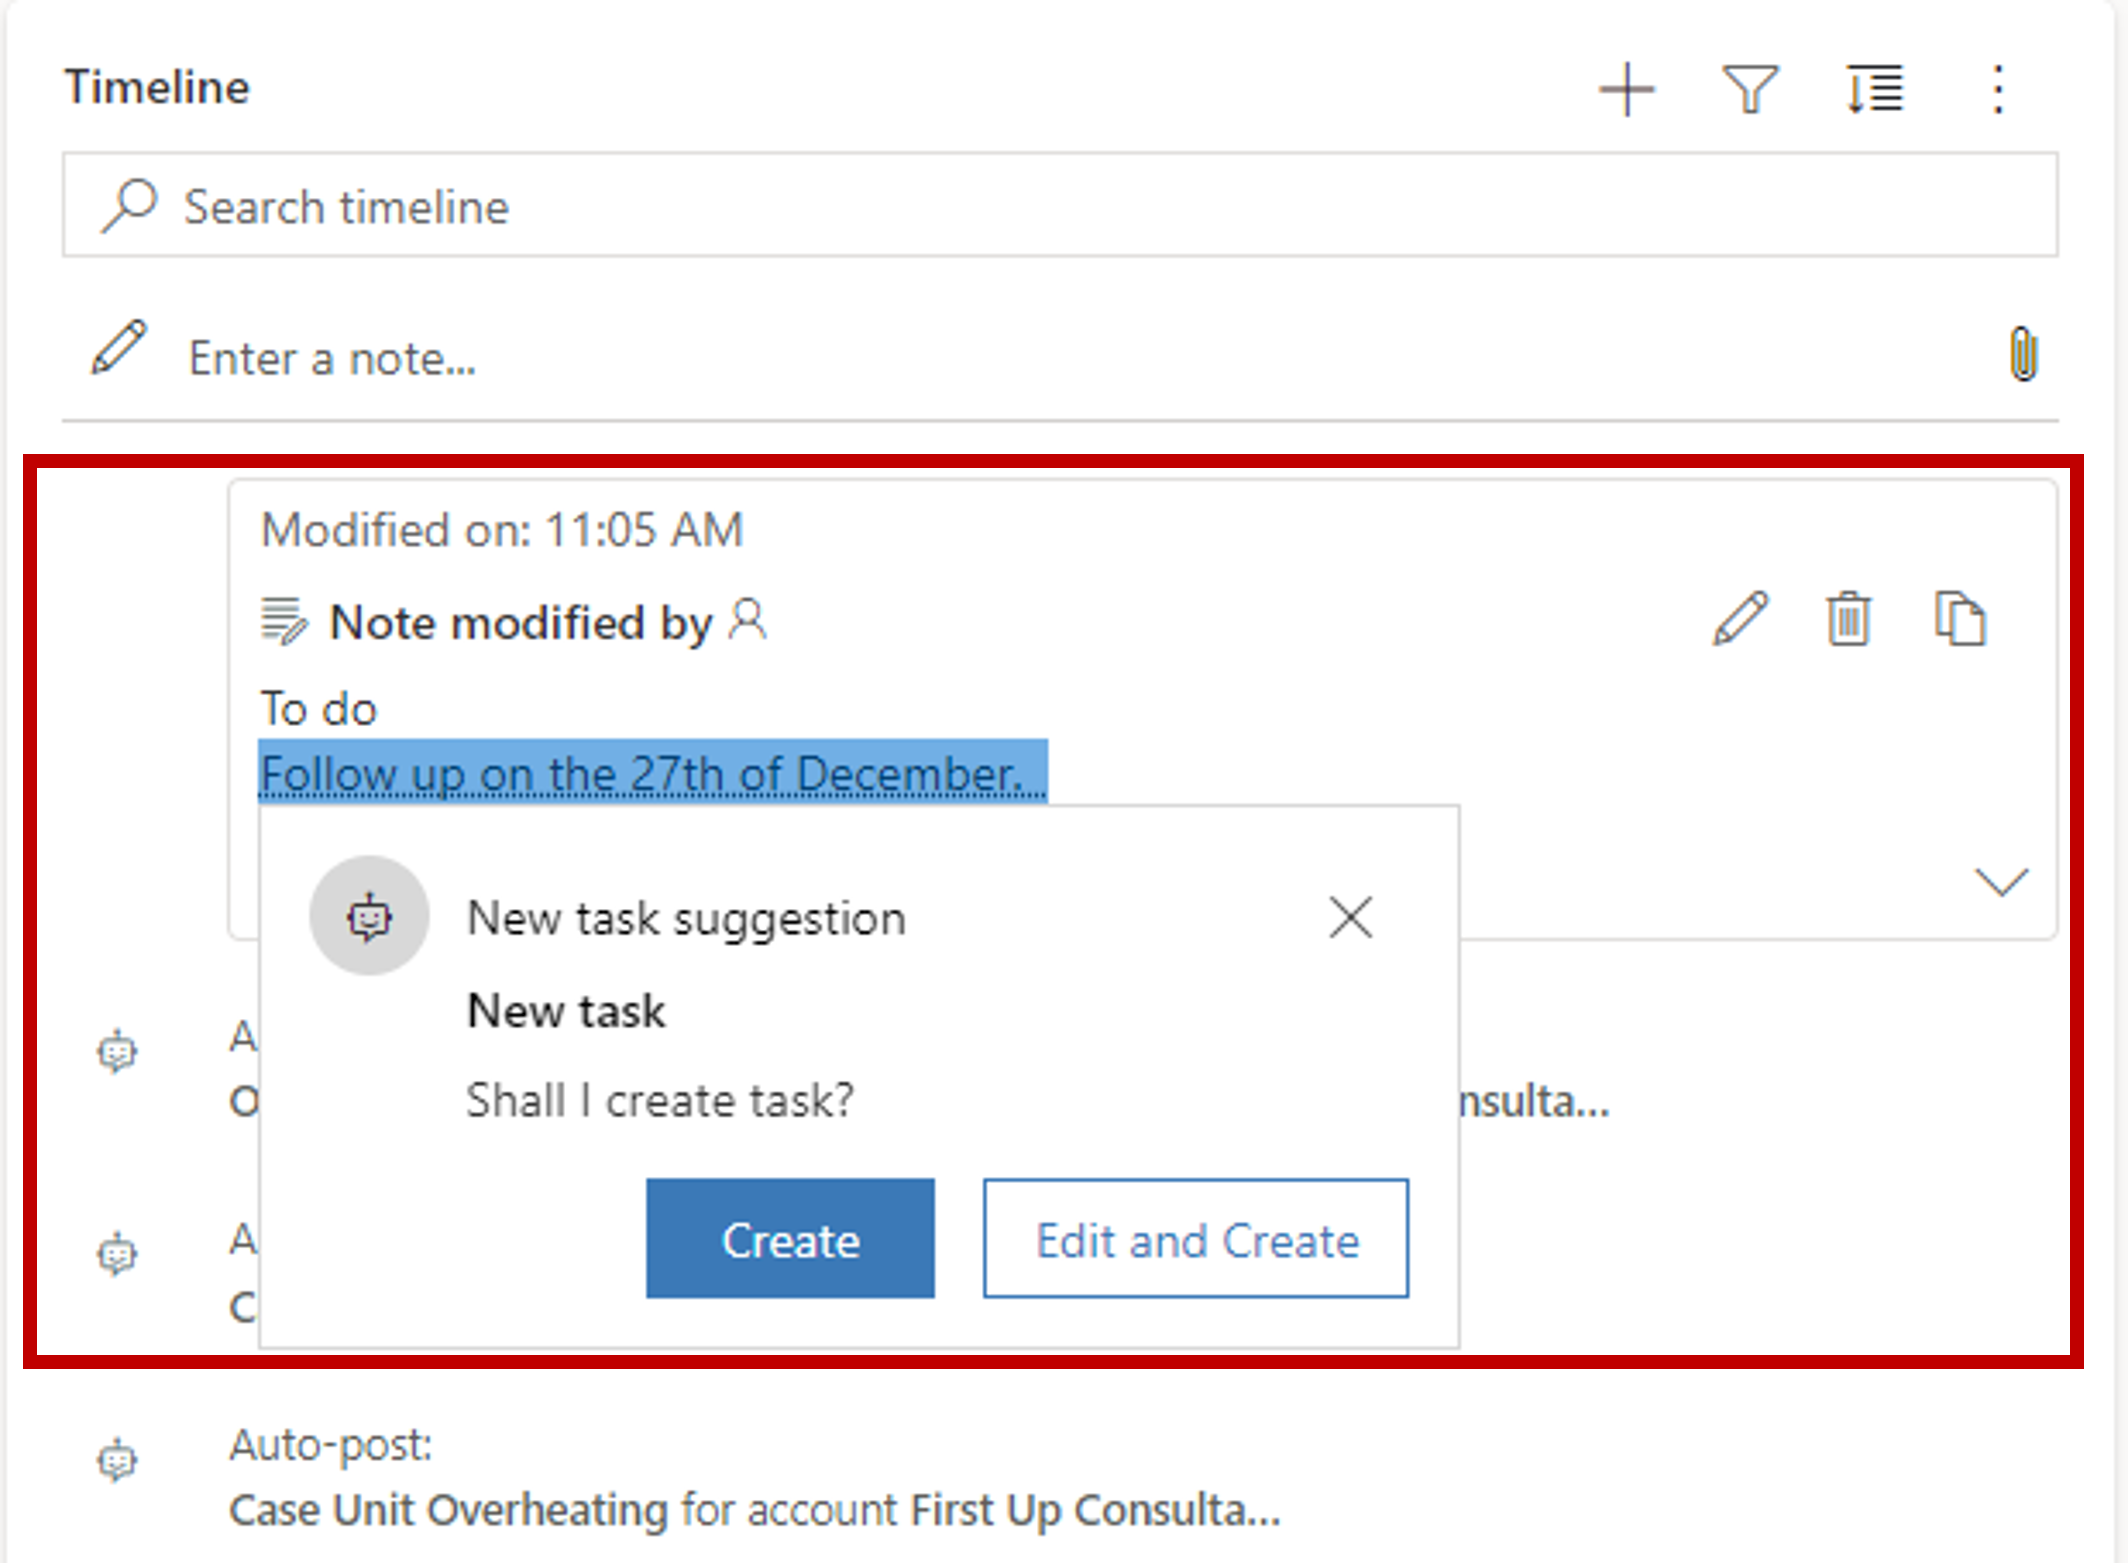
When you save a note, the text in the note is highlighted, and when selected, suggestions are displayed. These suggestions include: Creating activities, tasks, contacts, meetings, content requests, and issue detection.
For example, you created a note "Meet the customer on May 4 at 4:00 PM." When you select this text, Dynamics 365 provides an automatic suggestion to create an appointment.
When you have multiple suggestions associated with a note, Dynamics 365 displays all suggestions. You can take timely action depending on your requirements. For example, you've created a note to contact your customer regarding pricing and scheduling a meeting to further discuss the deal. The note shows suggestions to create an appointment and schedule a phone call.
Who know whom
Who Knows Whom relationships are calculated from the communication and collaboration patterns of users in your Microsoft Exchange environment. This data helps connect you to other users within your Microsoft Exchange environment that can help facilitate a connection. Contacts or leads that are external to your Microsoft Exchange organization can be queried for and, in some cases, users internal to your Microsoft Exchange organization can also be queried for. For example, this is possible if a user within your Microsoft Exchange organization has added an internal user's email address to their Microsoft Exchange address book.
Who Knows Whom is available in Contact and Lead forms. When you open a lead or contact and select the Sales Insights view, the Who Knows Whom tile is displayed.
Configuration
Out of the box Sales Insights basic features such as email engagement, auto capture, and limited Sales Accelerator functionality is enabled. For organizations that have purchased Sales Insights Premium, enabling and configuring its features lets your organization more effectively use it. Sales Insights Premium contains the following features:
Relationship analytics
Predictive lead scoring
Predictive opportunity scoring
Notes analysis
Talking points
Who knows whom
To learn more about working with and configuring Dynamics 365 Sales Insights, refer to the following Microsoft Learn Modules.


