Set and view alerts in your Log Analytics workspace
Alerts are similar to queries, but they run automatically in response to specific events. You can set a threshold against the result set, and if the threshold is met, trigger an alert to let you know about it.
Set alerts in your Log Analytics workspace in the Azure portal.
Set an alert
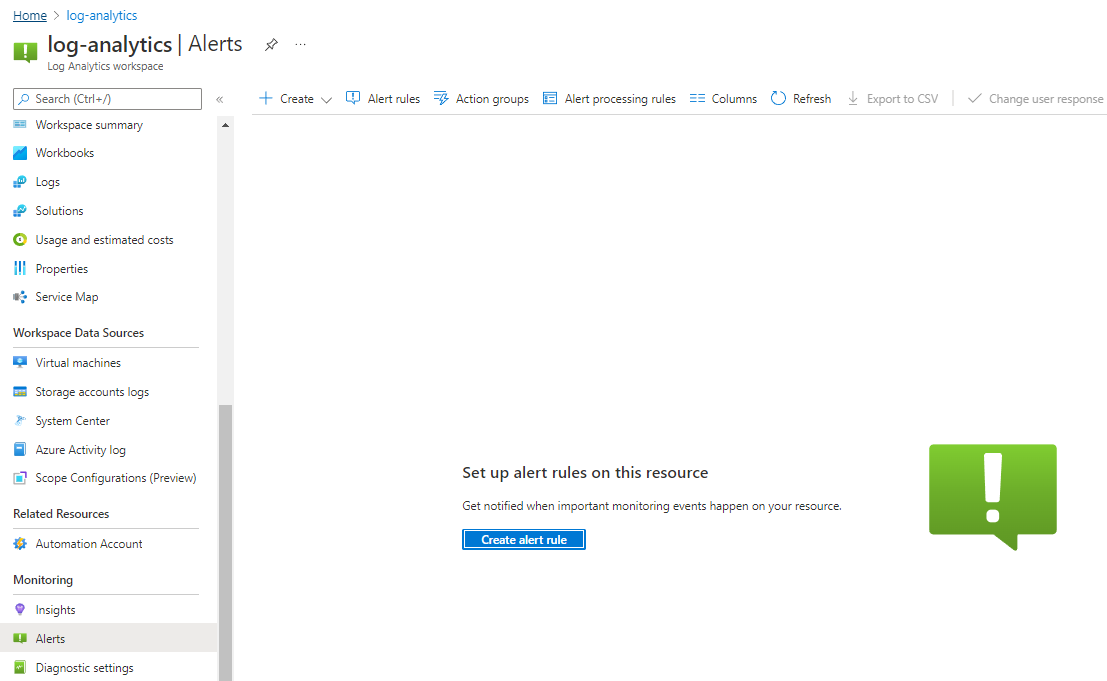
To set an alert, in the left menu under Monitoring, select Alerts, and then select Create alert rule. Scope is automatically set to your Log Analytics workspace.
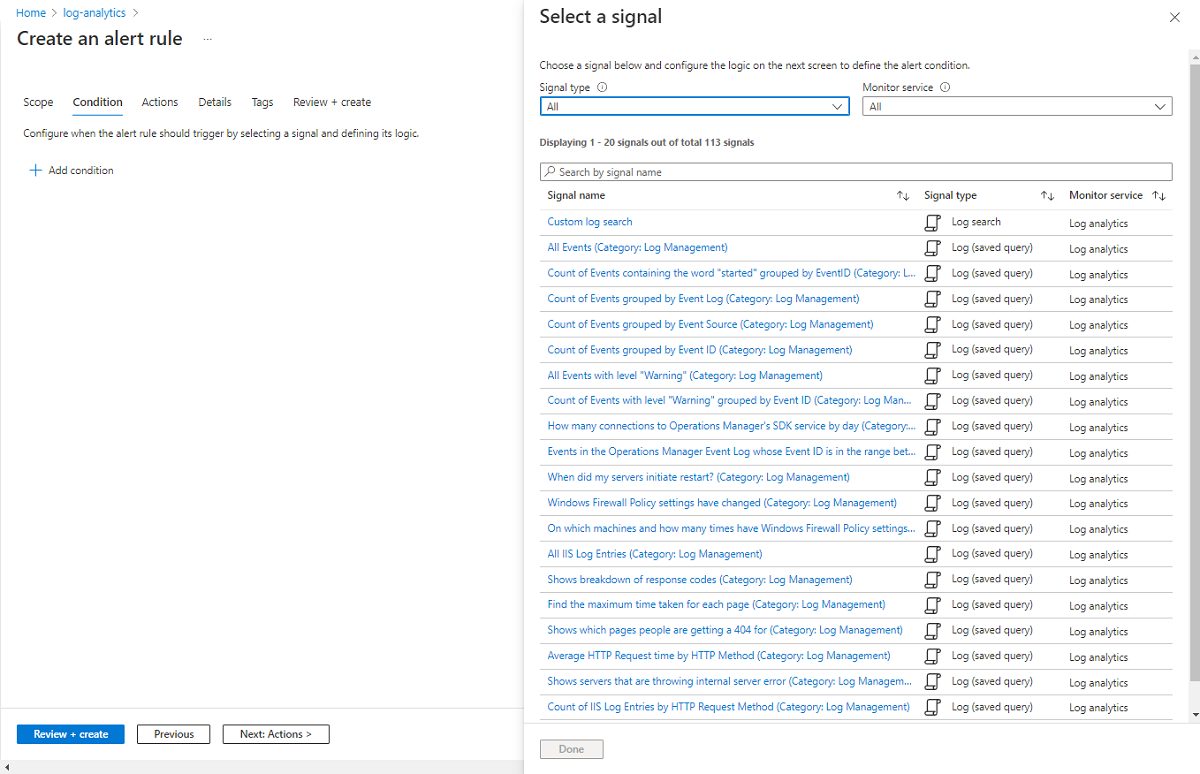
On the Condition tab, select or enter information for signal type and signal name. For example, set an alert to check for activity on your network.
Next, select values for the settings for the alert logic. The alert logic is defined by the condition and the evaluation time. The alert fires when this condition is true. Provide a threshold value for your alert rule and modify the operator and aggregation type to define the logic you need. You can accept the default time granularity or modify it to your requirements. Frequency of evaluation defines how often the alert logic is evaluated. Aggregation granularity defines the time interval over which the collected values are aggregated.
You can add more conditions, and then select the Actions tab. If you haven't already created an action group that you want to use, select Create action group. Select a subscription and resource group for the action group and give it an action group name that appears in the portal and a display name that appears in email and SMS notifications.
Complete the steps to set up notifications, actions, and tags, and then create the alert. You can step through the details in the exercise in the next unit.
View alert rules
When an alert fires, it sends any notifications to its action groups. You can also view the alert in the Azure portal.
In the left menu, select Alerts. Any open alerts for the resources are included in the view.
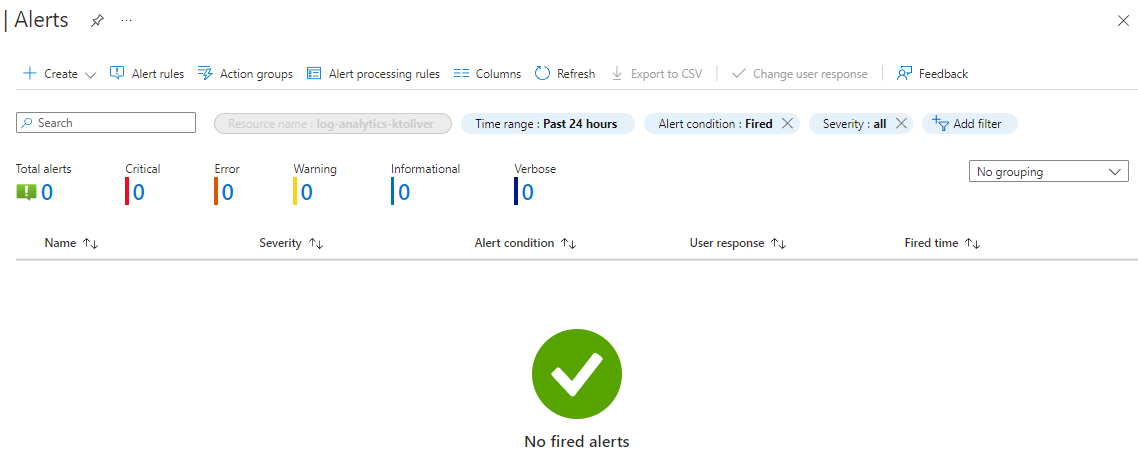
To view alerts that have that severity, select a severity. You can add filters to view subsets of alert results.
To view details about an alert, select the name of the alert.
Next unit: Exercise - Set an alert in your Log Analytics workspace and view alerts
Having an issue? We can help!
- For issues related to this module, explore existing questions using the #azure training tag or Ask a question on Microsoft Q&A.
- For issues related to Certifications and Exams, post on Certifications Support Forums or visit our Credentials Help.