Exercise - Cleanse meteor data
Recall that in the data science project life cycle, after you have the data for your predictions, you have to prepare the data for analysis. In this unit, you'll explore your data and make sure it's ready to use in the machine learning model.
Exercise: Import data
First, import NumPy and pandas:
import numpy as np
import pandas as pd
Make sure you run the cell to ensure you have your environment set up. Your notebook should look like this:
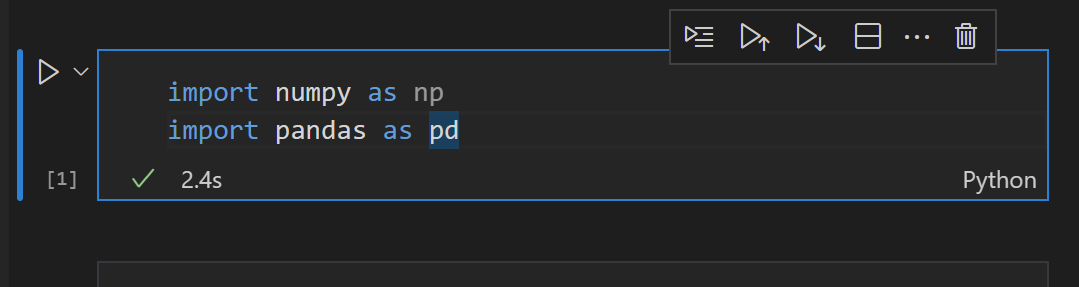
Notice the [1] in the corner of the cell where you have your imported code. That number means that the cell has finished running. There's no output between the first and second cell, so you know the code was successful.
Note
When you run the first import command, you'll be asked to choose a kernel. Select Python Environments and then a Python environment such as Python 3.10.4 or later.
Now import all four .csv files:
meteor_showers = pd.read_csv('data/meteorshowers.csv')
moon_phases = pd.read_csv('data/moonphases.csv')
constellations = pd.read_csv('data/constellations.csv')
cities = pd.read_csv('data/cities.csv')
Exercise: Explore data
Look through the data. For each variable you created, print the head and the info for those DataFrames. head allows you to see the first five lines in the .csv files. info gives you an overview of what data might be missing. Make sure you run each of these commands in their own cell so that you can see their output.
meteor_showers.head()
name |
radiant |
bestmonth |
startmonth |
startday |
endmonth |
endday |
hemisphere |
preferredhemisphere |
|
|---|---|---|---|---|---|---|---|---|---|
| 0 | Lyrids | Lyra | april | april | 21 | april | 22 | northern | northern |
| 1 | Eta Aquarids | Aquarius | may | april | 19 | may | 28 | northern, southern | southern |
| 2 | Orionids | Orion | october | october | 2 | november | 7 | northern, southern | northern, southern |
| 3 | Perseids | Perseus | august | july | 14 | august | 24 | northern | northern |
| 4 | Leonids | Leo | november | november | 6 | november | 30 | northern, southern | northern, southern |
meteor_showers.info()
<class 'pandas.core.frame.DataFrame'>
RangeIndex: 5 entries, 0 to 4
Data columns (total 9 columns):
 #   Column               Non-Null Count  Dtype
---  ------               --------------  -----
 0   name                 5 non-null      object
 1   radiant              5 non-null      object
 2   bestmonth            5 non-null      object
 3   startmonth           5 non-null      object
 4   startday             5 non-null      int64
 5   endmonth             5 non-null      object
 6   endday               5 non-null      int64
 7   hemisphere           5 non-null      object
 8   preferredhemisphere  5 non-null      object
dtypes: int64(2), object(7)
memory usage: 284.0+ bytes
moon_phases.head()
month |
day |
moonphase |
specialevent |
|
|---|---|---|---|---|
| 0 | january | 1 | NaN | NaN |
| 1 | january | 2 | first quarter | NaN |
| 2 | january | 3 | NaN | NaN |
| 3 | january | 4 | NaN | NaN |
| 4 | january | 5 | NaN | NaN |
moon_phases.info()
<class 'pandas.core.frame.DataFrame'>
RangeIndex: 366 entries, 0 to 365
Data columns (total 4 columns):
 #   Column        Non-Null Count  Dtype
---  ------        --------------  -----
 0   month         366 non-null    object
 1   day           366 non-null    int64
 2   moonphase     50 non-null     object
 3   specialevent  10 non-null     object
dtypes: int64(1), object(3)
memory usage: 7.2+ KB
constellations.head()
constellation |
bestmonth |
latitudestart |
latitudeend |
besttime |
hemisphere |
|
|---|---|---|---|---|---|---|
| 0 | Lyra | august | 90 | -40 | 21:00 | northern |
| 1 | Aquarius | october | 65 | -90 | 21:00 | southern |
| 2 | Orion | january | 85 | -75 | 21:00 | northern |
| 3 | Perseus | december | 90 | -35 | 21:00 | northern |
| 4 | Leo | april | 90 | 65 | 21:00 | northern |
constellations.info()
<class 'pandas.core.frame.DataFrame'>
RangeIndex: 5 entries, 0 to 4
Data columns (total 6 columns):
 #   Column         Non-Null Count  Dtype
---  ------         --------------  -----
 0   constellation  5 non-null      object
 1   bestmonth      5 non-null      object
 2   latitudestart  5 non-null      int64
 3   latitudeend    5 non-null      int64
 4   besttime       5 non-null      object
 5   hemisphere     5 non-null      object
dtypes: int64(2), object(4)
memory usage: 224.0+ bytes
cities.head()
city |
latitude |
country |
|
|---|---|---|---|
| 0 | Abu Dhabi | 24.47 | United Arab Emirates |
| 1 | Abuja | 9.07 | Nigeria |
| 2 | Accra | 5.55 | Ghana |
| 3 | Adamstown | -25.07 | Pitcairn Islands |
| 4 | Addis Ababa | 9.02 | Ethiopia |
cities.info()
<class 'pandas.core.frame.DataFrame'>
RangeIndex: 256 entries, 0 to 255
Data columns (total 3 columns):
 #   Column    Non-Null Count  Dtype
---  ------    --------------  -----
 0   city      256 non-null    object
 1   latitude  256 non-null    float64
 2   country   256 non-null    object
dtypes: float64(1), object(2)
memory usage: 4.1+ KB
Convert to numbers
We can see from the calls to head() that a lot of information is written in words (strings) instead of numbers (integers). Some data makes sense as strings, like city names or meteor shower names. But other data makes more sense as integers, like months or Moon phases.
You can quickly convert the month columns to numbers:
- Create a map of months to numbers. We can see from the output of
head()that the months are all lowercase. - Map the map of months to the columns that have months in them.
- Save the result to the DataFrame.
months = {'january':1, 'february':2, 'march':3, 'april':4, 'may':5, 'june':6, 'july':7, 'august':8, 'september':9, 'october':10, 'november':11, 'december':12}
meteor_showers.bestmonth = meteor_showers.bestmonth.map(months)
meteor_showers.startmonth = meteor_showers.startmonth.map(months)
meteor_showers.endmonth = meteor_showers.endmonth.map(months)
moon_phases.month = moon_phases.month.map(months)
constellations.bestmonth = constellations.bestmonth.map(months)
Verify your changes by adding calls to head() and info() to each of the three DataFrames that you modified. For example:
meteor_showers.head()
name |
radiant |
bestmonth |
startmonth |
startday |
endmonth |
endday |
hemisphere |
preferredhemisphere |
|
|---|---|---|---|---|---|---|---|---|---|
| 0 | Lyrids | Lyra | 4 | 4 | 21 | 4 | 22 | northern | northern |
| 1 | Eta Aquarids | Aquarius | 5 | 4 | 19 | 3 | 28 | northern, southern | southern |
| 2 | Orionids | Orion | 10 | 10 | 2 | 11 | 7 | northern, southern | northern, southern |
| 3 | Perseids | Perseus | 8 | 7 | 14 | 8 | 24 | northern | northern |
| 4 | Leonids | Leo | 11 | 11 | 6 | 11 | 30 | northern, southern | northern, southern |
meteor_showers.info()
<class 'pandas.core.frame.DataFrame'>
RangeIndex: 5 entries, 0 to 4
Data columns (total 9 columns):
 #   Column               Non-Null Count  Dtype
---  ------               --------------  -----
 0   name                 5 non-null      object
 1   radiant              5 non-null      object
 2   bestmonth            5 non-null      int64
 3   startmonth           5 non-null      int64
 4   startday             5 non-null      int64
 5   endmonth             5 non-null      int64
 6   endday               5 non-null      int64
 7   hemisphere           5 non-null      object
 8   preferredhemisphere  5 non-null      object
dtypes: int64(5), object(4)
memory usage: 488.0+ bytes
Before you continue, convert months and days in the meteor_showers DataFrame to a type called datetime, which tracks dates.
Create two new columns: startdate and enddate. These columns will contain a month and day in 2020:
meteor_showers['startdate'] = pd.to_datetime(2020*10000+meteor_showers.startmonth*100+meteor_showers.startday,format='%Y%m%d')
meteor_showers['enddate'] = pd.to_datetime(2020*10000+meteor_showers.endmonth*100+meteor_showers.endday,format='%Y%m%d')
Follow the same pattern for moon_phases:
moon_phases['date'] = pd.to_datetime(2020*10000+moon_phases.month*100+moon_phases.day,format='%Y%m%d')
Next, convert hemisphere data to numbers by using the mapping process:
hemispheres = {'northern':0, 'southern':1, 'northern, southern':3}
meteor_showers.hemisphere = meteor_showers.hemisphere.map(hemispheres)
constellations.hemisphere = constellations.hemisphere.map(hemispheres)
Finally, convert Moon phases to numbers that represent the percentage of the Moon that's visible. This time, add a new column to represent the data:
- Create the map of phases to numbers.
- Add a new column called
percentageand set it to themoonphasecolumn that's mapped to the numbers. - Show the first five rows.
phases = {'new moon':0,'third quarter':0.5, 'first quarter':0.5,'full moon':1.0}
moon_phases['percentage'] = moon_phases.moonphase.map(phases)
moon_phases.head()
month |
day |
moonphase |
specialevent |
date |
percentage |
|---|---|---|---|---|---|
| 0 | 1 | 1 | NaN | 2020-01-01 | NaN |
| 1 | 1 | 2 | first quarter | 2020-01-02 | 0.5 |
| 2 | 1 | 3 | NaN | 2020-01-03 | NaN |
| 3 | 1 | 4 | NaN | 2020-01-04 | NaN |
| 4 | 1 | 5 | NaN | 2020-01-05 | NaN |
Now you've converted all the data that makes more sense as numbers. But some values are missing.
Remove unnecessary data
Some of the data from these .csv files isn't useful. You can delete the following data:
| Data frame | Columns to remove | Reason |
|---|---|---|
meteor_showers |
startmonth, startday, endmonth, endday, hemisphere |
The month and day information is captured in the startdate and enddate columns. The preferredhemisphere column is the optimal value. |
moon_phases |
month, day, moonphase, specialevent |
The date column already contains month and day. The percentage column covers the moonphase. The specialevent column isn't relevant. |
constellations |
besttime |
Every row is 21:00. |
Here's how to remove those columns:
meteor_showers = meteor_showers.drop(['startmonth', 'startday', 'endmonth', 'endday', 'hemisphere'], axis=1)
moon_phases = moon_phases.drop(['month','day','moonphase','specialevent'], axis=1)
constellations = constellations.drop(['besttime'], axis=1)
Now it's time to fill in the missing data.
Missing data
One of the .csv files is interesting. The output of moon_phases.info() shows the following information:
<class 'pandas.core.frame.DataFrame'>
RangeIndex: 366 entries, 0 to 365
Data columns (total 2 columns):
 #   Column      Non-Null Count  Dtype
---  ------      --------------  -----
 0   date        366 non-null    datetime64[ns]
 1   percentage  50 non-null     float64
dtypes: datetime64[ns](1), float64(1)
memory usage: 5.8 KB
You see that the cycle of the Moon phases goes from 0 to 0.5 to 1 to 0.5 and then back to 0. So, you could conceivably make every value between 0 and 0.5 be 0.25. And you could make every value between 0.5 and 1 be 0.75.
You could get more detailed by figuring out a more accurate percentage on your own:
Create a variable to save the last phase that you saw.
Loop through each row and column in the
moon_phasesDataFrame.If the value in the
percentagecolumn of a row isNaN(null), then replace it with the last phase that you saw.If the value isn't
NaN, then save the value as the last phase that you saw.Show the info for the
moon_phasesDataFrame:lastPhase = 0 for index, row in moon_phases.iterrows(): if pd.isnull(row['percentage']): moon_phases.at[index,'percentage'] = lastPhase else: lastPhase = row['percentage'] moon_phases.info()<class 'pandas.core.frame.DataFrame'> RangeIndex: 366 entries, 0 to 365 Data columns (total 2 columns): # Column Non-Null Count Dtype --- ------ -------------- ----- 0 date 366 non-null datetime64[ns] 1 percentage 366 non-null float64 dtypes: datetime64[ns](1), float64(1) memory usage: 5.8 KB
Now your data is cleansed and ready to be analyzed!