Exercise - Troubleshoot a network by using Network Watcher metrics and logs
In Azure Network Watcher, metrics and logs can diagnose complex configuration issues.
Suppose you have two virtual machines (VMs) that can't communicate. You want to obtain as much information as you can to diagnose the problem.
In this unit, you'll troubleshoot by using Network Watcher metrics and logs. To diagnose the connectivity issue between the two VMs, you'll then use the network security group (NSG) flow logs.
Register the Microsoft.Insights provider
NSG flow logging requires the Microsoft.Insights provider. To register for the Microsoft.Insights provider, complete the following steps.
Sign in to the Azure portal, and log in to the directory with access to the subscription you created resources in.
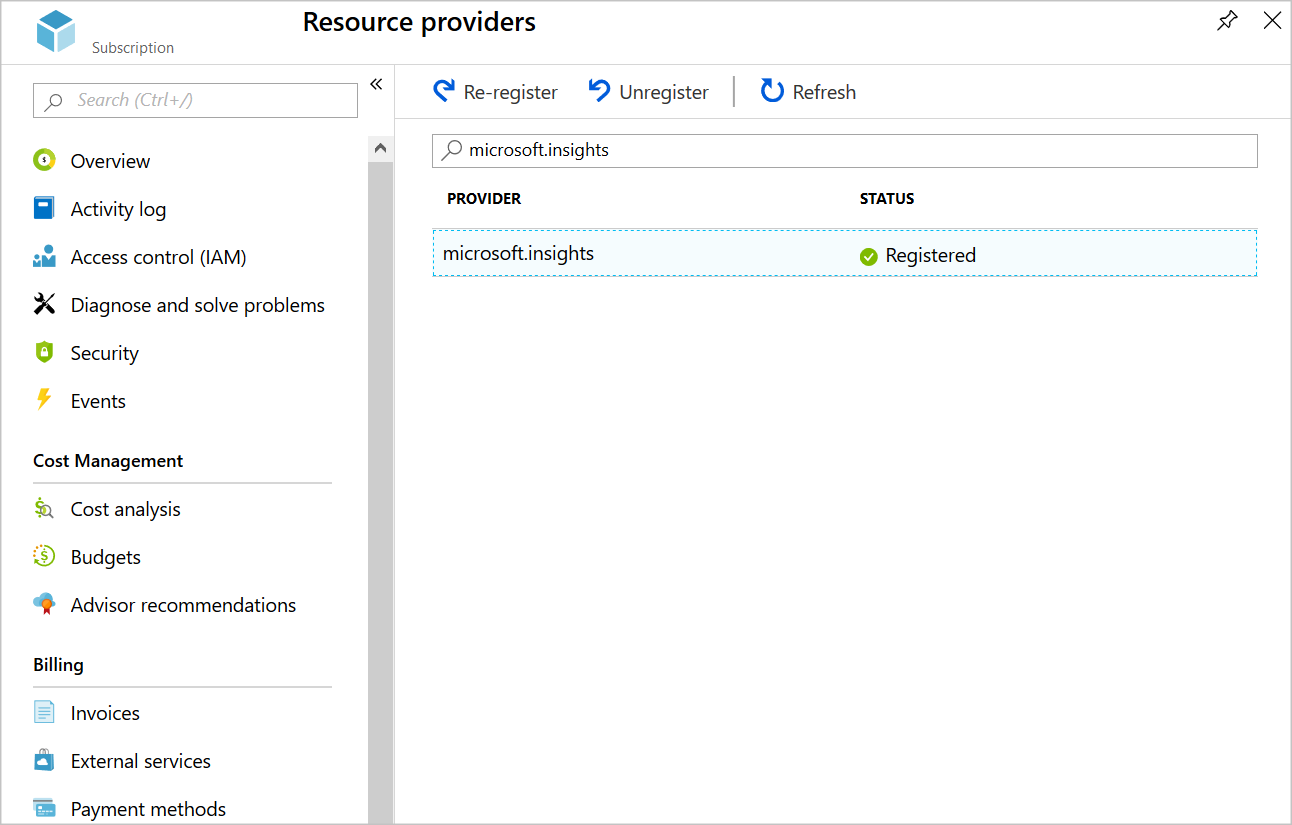
In the Azure portal, search for, select Subscriptions, and then select your subscription. The Subscription pane appears.
In the Subscription menu, under Settings, select Resource providers. Your subscription's Resource providers pane appears.
In the filter bar, enter microsoft.insights.
If the status of the microsoft.insights provider is NotRegistered, select Register in the command bar.
Create a storage account
Now, create a storage account for the NSG flow logs.
On the Azure portal menu or from the Home page, select Create a resource.
On the resource menu, select Storage, then search for and select Storage account. The Storage account pane appears.
Select Create. The Create storage account pane appears.
On the Basics tab, enter the following values for each setting.
Setting Value Project details Subscription Select your subscription Resource group Select your resource group Instance details Storage account name Create a unique name Region Select the same region as your resource group Select Next: Advanced tab, and ensure that the following value is set.
Setting Value Blob storage Access tier Hot (default) Select Review + create, and when validation passes, select Create.
Create a Log Analytics workspace
To view the NSG flow logs, you'll use Log Analytics.
On the Azure portal menu or from the Home page, search for and select Log Analytics workspaces. The Log Analytics workspaces pane appears.
In the command bar, select Create. The Create Log Analytics workspace pane appears.
On the Basics tab, enter the following values for each setting.
Setting Value Project details Subscription Select your subscription Resource group Select your resource group Instance details Name testsworkspaceRegion Select the same region as your resource group Select Review + Create, and after validation passes, select Create.
Enable flow logs
To set up flow logs, you must configure the NSG to connect to the storage account, and add traffic analytics for the NSG.
On the Azure portal menu, select All resources. Then, select the MyNsg network security group.
In the MyNsg menu, under Monitoring, select NSG flow logs. The MyNsg | NSG flow logs pane appears.
Select Create. The Create a flow log pane appears.
On the Basics tab, select or enter the following values.
Setting Value Project details Subscription Select your subscription from the dropdown list. + Select Resource On the Select network security group pane, search for and select MyNsg and Confirm selection. Instance details Subscription Select your subscription from the dropdown list. Storage Accounts Select your unique storage account name. Retention (days) 1 Select Next: Analytics, then select or enter the following values.
Setting Value Flow Logs Version Version 2 Traffic Analytics Enable Traffic Analytics is checked. Traffic Analytics processing interval Every 10 mins Subscription Select your subscription from the dropdown list. Log Analytics Workspace Select testworkspacefrom the dropdown list.Select Review + create.
Select Create.
When the deployment is complete, select Go to resource.
Generate test traffic
Now, you're ready to generate some network traffic between VMs to catch in the flow log.
On the resource menu, select All resources, then select FrontendVM.
From the command bar, select Connect, then select RDP, and then select Download RDP File. If you see a warning about the publisher of the remote connection, select Connect.
Launch the FrontendVM.rdp file and select Connect.
When asked for your credentials, select More choices and sign in with the username azureuser and the password you specified when you created the VM.
When asked for a security certificate, select Yes.
In the RDP session, if prompted, allow your device to be discoverable ONLY if on a private network.
Open a PowerShell prompt and run the following command.
PowerShellTest-NetConnection 10.10.2.4 -port 80
The TCP connection test fails after a few seconds.
Diagnose the problem
Now, let's use log analytics to view the NSG flow logs.
On the Azure portal resource menu, select All services, select Networking, and then select Network Watcher. The Network Watcher pane appears.
In the resource menu, under Logs, select Traffic Analytics. The Network Watcher | Traffic Analytics pane appears.
In the FlowLog Subscriptions dropdown list, select your subscription.
In the Log Analytics workspace dropdown list, select
testworkspace.Use the different views to diagnose the problem that prevents communication from the frontend VM to the backend VM.
Fix the problem
An NSG rule is blocking inbound traffic to the backend subnet from everywhere over the ports 80, 443, and 3389 instead of just blocking inbound traffic from the Internet. Let's reconfigure that rule now.
On the Azure portal resource menu, select All resources, and then select MyNsg from the list.
In the MyNsg menu, under Settings, select Inbound security rules, and then select MyNSGRule. The MyNSGRule pane appears.
In the Source dropdown list, select Service Tag, and in the Source service tag dropdown list, select Internet.
In the MyNSGRule command bar, select Save to update the security rule.
Retest the connection
Connections on port 80 should now work without problems.
In the RDP client, connect to FrontendVM. At the PowerShell prompt, run the following command.
PowerShellTest-NetConnection 10.10.2.4 -port 80
The connection test should now succeed.
Next unit: Summary
Having an issue? We can help!
- For issues related to this module, explore existing questions using the #azure training tag or Ask a question on Microsoft Q&A.
- For issues related to Certifications and Exams, post on Certifications Support Forums or visit our Credentials Help.