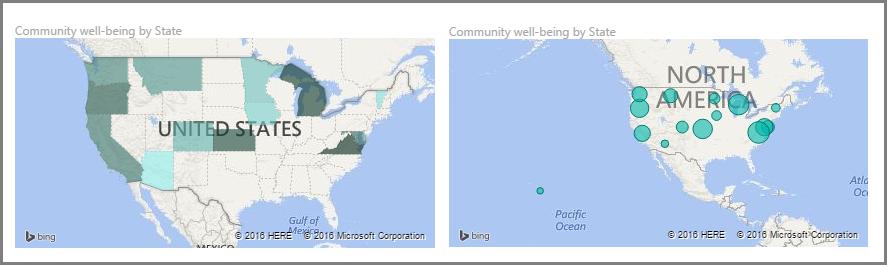
Map visualizations
Power BI has two different types of map visualizations: a bubble map that places a bubble over a geographic point, and a shape map that shows the outline of the area that you want to visualize.
Video: Map visuals
Important
When you are working with countries or regions, use the three-letter abbreviation to ensure that geocoding works properly. Do not use two-letter abbreviations because some countries or regions might not be properly recognized.
If you only have two-letter abbreviations, go to this external blog post for steps on how to associate your two-letter country and/or region abbreviations with three-letter country and/or region abbreviations.
Create bubble maps
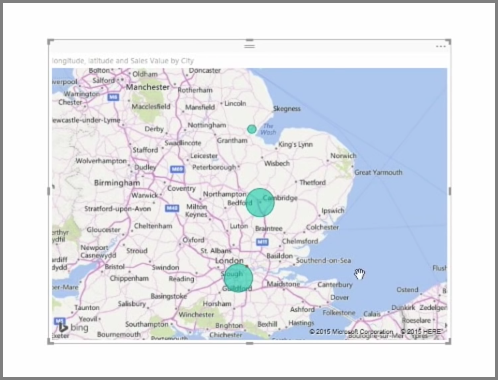
To create a bubble map, select the Map option in the Visualization pane. In the Visualizations options, add a value to the Location bucket to use a map visual.
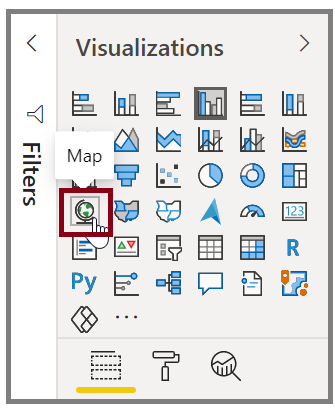
Power BI accepts many types of location values. It recognizes city names, airport codes, or specific latitude and longitude data. Add a field to the Size bucket to change the size of the bubble for each map location.
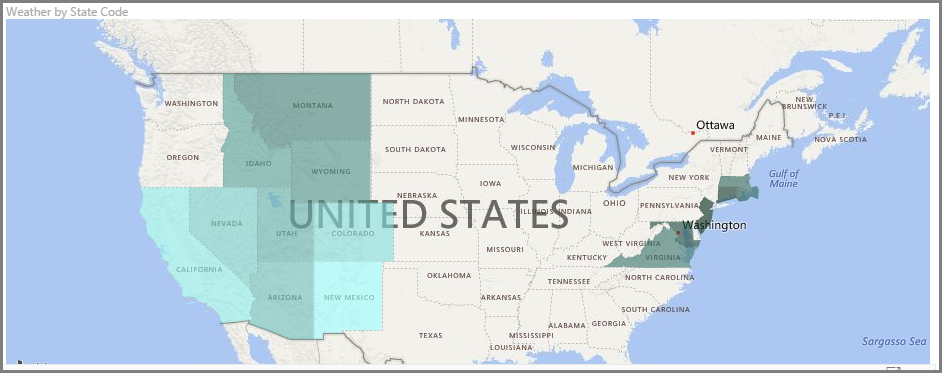
Create shape maps
To create a shape map, select the Filled Map option in the Visualization pane. As with bubble maps, you must add a value to the Location bucket to use this visual. Add a field to the Size bucket to change the intensity of the fill color.
A warning icon in the top-left corner of your visual indicates that the map needs more location data to accurately plot values. This is a common problem when the data in your location field is ambiguous, such as using an area name like Washington, which could indicate a state or a district.
One way to resolve the location data problem is to rename your column to be more specific, such as State. Another way is to manually reset the data category by selecting Data Category on the Column tools tab. From the Data Category list, you can assign a category to your data such as "State" or "City."