Troubleshoot Azure virtual machine performance on Linux or Windows
This article describes virtual machine (VM) generic performance troubleshooting through monitoring and observing bottlenecks and provides possible remediation for issues that may occur. Besides monitoring, you can also use Perfinsights which can provide a report with best practices recommendations and key bottlenecks around IO/CPU/Memory. Perfinsights is available for both Windows and Linux VM's in Azure.
This article will walk through using monitoring to diagnose Performance bottlenecks.
Enabling monitoring
Azure IAAS virtual machine monitoring
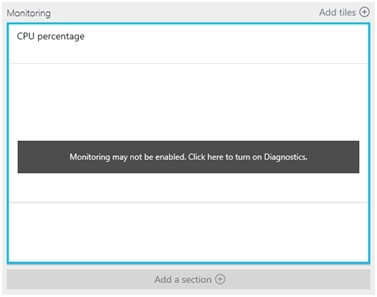
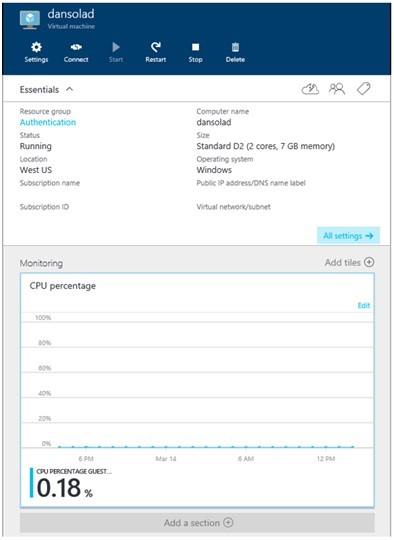
To monitor the Guest VM, use the Azure VM Monitoring, which will alert you to certain high-level resource conditions. To check whether you have the VM diagnostics enabled, see Azure Resource logs overview. If you see the following, then you most likely don't have the diagnostics enabled:
Enable VM diagnostics through microsoft Azure portal
To enable VM diagnostics:
Go to the VM.
Click Diagnostics Settings.
Select the storage account and click Enable guest-level monitoring.

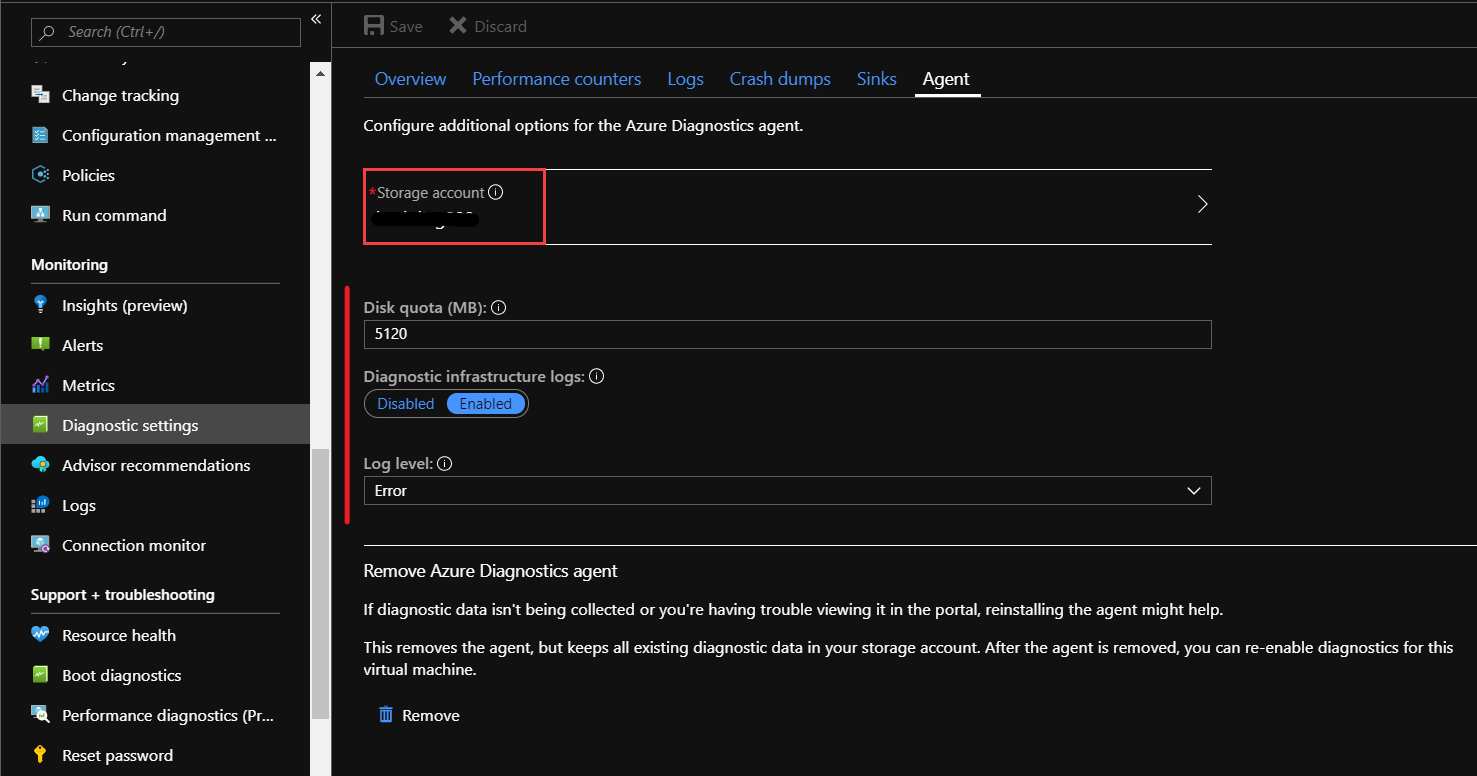
You can check the storage account used for Diagnostics setup from Agent tab under Diagnostics Settings.
Enable storage account diagnostics through Azure portal
Storage is a very important tier when we intend to analyze IO performance for a Virtual Machine in Azure. For storage related metrics we need to enable diagnostics as an additional step. This could also be enabled, if we only want to analyze the storage related counters.
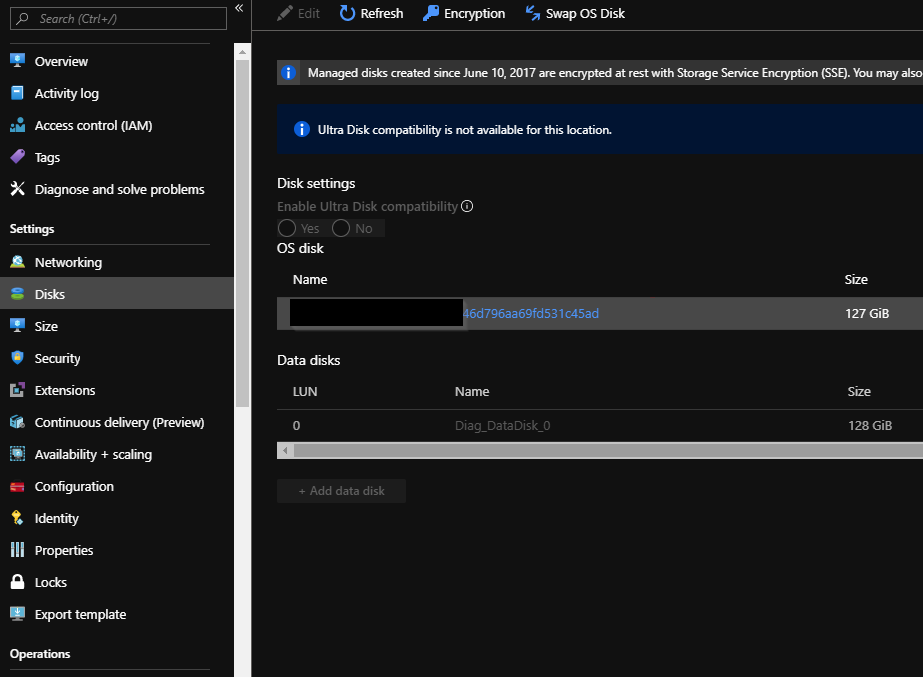
Identify which storage account (or accounts) your VM is using by selecting the VM. Click Settings, and then click Disks:
In the portal, go to the storage account (or accounts) for the VM and work through the following steps:
- Click overview for the Storage account you found with step above.
- Default metrics would be shown.
Click on any of the metrics, which will show another blade with more options to configure and add metrics.

To configure these options:
- Select Metrics.
- Select the Resource (storage account).
- Select the Namespace
- Select Metric.
- Select the type of Aggregation
- You can pin this view on dashboard.
Observing bottlenecks
Once we are through the initial setup process for needed metrics, and post enabling the diagnostics for VM and related Storage account, we can shift to analysis phase.
Accessing the monitoring
Select the Azure VM you want to investigate and select Monitoring.
Timelines of observation
To identify if you have any resource bottlenecks, review your data. If your find that your machine has been running fine, but it has been reported that the performance has recently degraded, review a time range of data that encompasses performance metric data before the reported changed, during and after the issue.
Check for CPU bottleneck
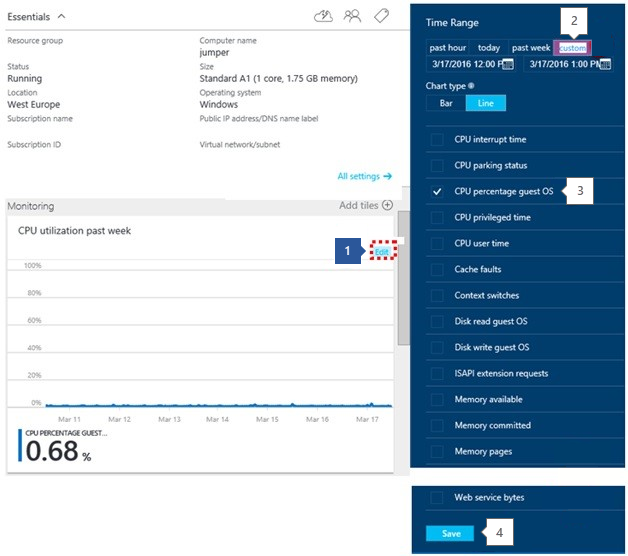
- Edit the Graph.
- Set the time Range.
- You then need to add in the counter: CPU Percentage Guest OS
- Save.
CPU observe trends
When looking at performance issues, be aware of the trends and understand if they affect you. In the next sections, we'll use the Monitoring graphs from the portal to show trends. They can also be useful for cross referencing difference resource behaviors in the same time period. To customize the graphs, click Azure Monitor data platform.
Spiking – Spiking could be related to a scheduled task/known event. If you can identify the task, determine whether the task runs at the required performance level. If performance is acceptable, you may not need to increase resources.
Spike up and Constant – Often indicates a new workload. If it's not a recognized workload, enable monitoring in the VM to find out what process (or processes) causes the behavior. Once the process is recognized, determine whether the increased consumption is being caused by inefficient code, or normal consumption. If normal consumption, decide whether the process operates at the required performance level.
Constant – Determine whether your VM has always run at this level, or if it has only been running at that level since the diagnostics have been enabled. If so, identify the process (or processes) causing the issue, and consider adding more of that resource.
Steadily Increasing – A constant increase in consumption is often either inefficient code or a process taking on more user workload.
High CPU utilization remediation
If your application or process isn't running at the correct performance level, and you're seeing 95% + CPU utilization constant, you can perform either of the following tasks:
- For immediate relief - Increase the size of the VM to a size with more cores
- Understand the issue – locate application/process and troubleshoot accordingly.
If you have increased the VM, and the CPU is still running 95%, determine whether this setting is offering better performance or higher application throughput to an acceptable level. If not, troubleshoot that individual application\process.
You can use Perfinsights for Windows or Linux to analyze which process is driving the CPU consumption.
Check for memory bottleneck
To view the metrics:
- Add a Section.
- Add a Tile.
- Open the Gallery.
- Select the Memory Usage and drag. When the tile is docked, right-click and select 6x4.
Memory observe trends
The Memory Usage shows you how much memory is being consumed with the VM. Understand the trend and whether it maps to the time where you see issues. You should always have more than 100 MB of available memory.
Spike and Constant/Constant Steady Consumption - High memory utilization may not be the cause of bad performance, as some applications such as relational database engines allocate a large amount of memory, and this utilization may not be significant. However, if there are multiple memory-hungry applications, you may see poor performance from memory contention causing trimming and paging/swapping to disk. This poor performance is often a noticeable cause of application performance impact.
Steadily Increasing Consumption – A possible application 'warming up', this consumption is common among database engines starting up. However, it could also be a sign of a memory leak in an application. Identify the application and understand whether the behavior is expected.
Page or Swap File Usage – Check whether you're using the Windows Paging file (located on D:) or Linux Swap file (located on /dev/sdb) are being heavily used. If you have nothing on these volumes except these files, check for high Read/Writes on those disks. This issue is indicative of low memory conditions.
High memory utilization remediation
To resolve high memory utilization, perform any of the following tasks:
- For immediate relief or Page or Swap File Usage - Increase the VM size to one with more memory, then monitor.
- Understand issue – locate applications/process and troubleshoot for identifying high consuming memory applications.
- If you know the application, see if the memory allocation can be capped.
If after upgrading to a larger VM, you discover that you still have a constant steady increase until 100%, identify the application/process and troubleshoot.
You can use Perfinsights for Windows or Linux to analyze which process is driving the Memory consumption.
Check for disk bottleneck
To check the storage subsystem for the VM, check the diagnostics at the Azure VM level by using the counters in VM Diagnostics and also the Storage Account Diagnostics.
For within VM specific troubleshooting, you can use Perfinsights for Windows or Linux, which could help to analyze which process is driving the IO's.
Note that we don't have counters for Zone Redundant and Premium Storage Accounts. For issues related to these counters, raise a support case.
Viewing storage account diagnostics in monitoring
To work on the below items, go into the storage account for the VM in the portal:
- Edit the Monitoring Graph.
- Set the time range.
- Add the counters described in the steps below.
- Save the changes.
Disk observe trends (standard storage only)
To identify issues with storage, look at the performance metrics from the Storage Account Diagnostics and the VM Diagnostics.
For each check below, look for key trends when the issues occur within the time range of the issue.
Check Azure storage availability – Add the storage account metric: availability
If you see a drop in availability, there could be an issue with the platform, check the Azure Status. If no issue is shown there, raise a new support request.
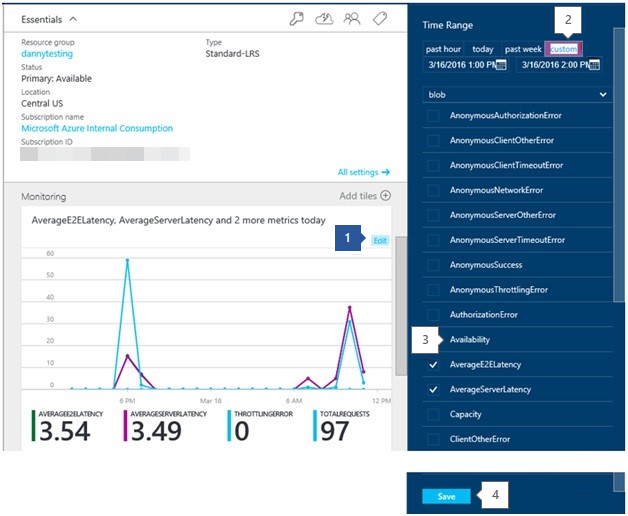
Check for Azure storage timeout - Add the storage account metrics
- ClientTimeOutError
- ServerTimeOutError
- AverageE2ELatency
- AverageServerLatency
- TotalRequests
Values in the *TimeOutError metrics indicate that an IO operation took too long and timed out. Working through the next steps will help identify potential causes.
AverageServerLatency increases at the same time at the TimeOutErrors could be a platform issue. Raise a new support request in this situation.
AverageE2ELatency represents client latency. Verify how the IOPS are being performed by the application. Look for an increase or constantly high TotalRequests metric. This metric represents IOPS. If you're starting to hit the limits of the storage account or single VHD, the latency could be related to throttling.
Check for Azure storage throttling - Add the storage account metrics: ThrottlingError
Values for throttling indicates that you're being throttled at storage account level, meaning that your hitting the IOPS limit of the account. You can determine whether you're hitting the IOPs threshold by checking the metric TotalRequests.
Note that each VHD has a limit of 500 IOPS or 60 MBits, but is bound by the cumulative limit of 20000 IOPS per storage account.
With this metric, you can't tell which blob is causing the throttling and which are affected by it. However, you're either hitting the IOPS or Ingress/Egress limits of the storage account.
To identify if you're hitting the IOPS limit, go into the Storage Account diagnostics and check the TotalRequests, looking to see if you're approaching 20 thousand TotalRequests. Identify either a change in the pattern, whether you're seeing the limit for the first time, or whether this limit happens at a certain time.
With new disk offerings under Standard storage, the IOPS and Throughput limits could differ, but the cumulative limit of Standard Storage account is 20000 IOPS(Premium storage has different limits at account or Disk level). Read more about different standard storage disk offerings and per disk limits:
References
The bandwidth of the storage account is measured by the Storage Account Metrics: TotalIngress and TotalEgress. You have different thresholds for bandwidth depending on type of redundancy and regions.
Check the TotalIngress and TotalEgress against the Ingress and Egress limits for the storage account redundancy type and region.
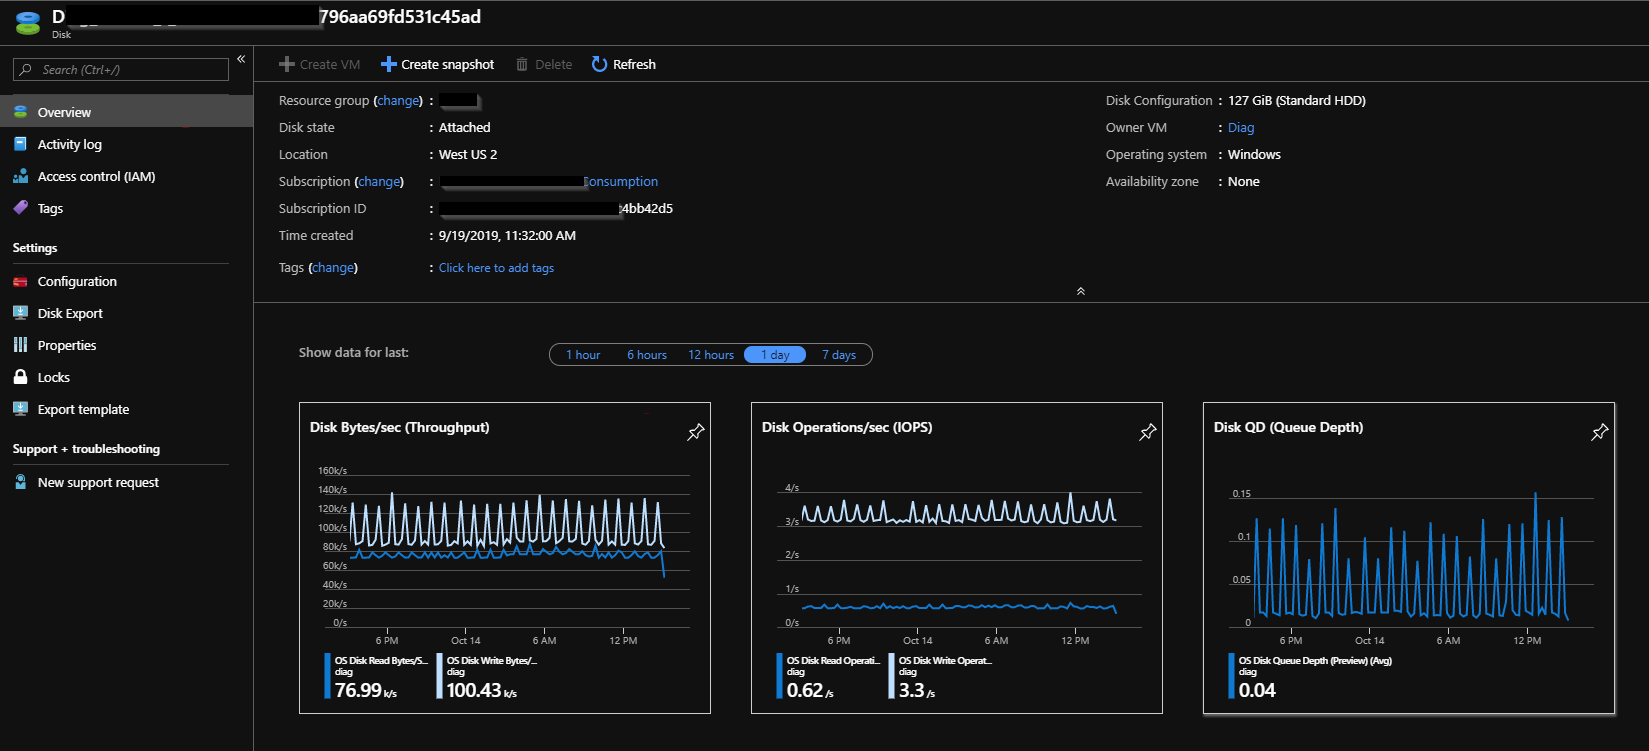
Check Throughput Limits of the VHDs attached to the VM. Add the VM Metrics Disk Read and Write.
New disk offerings under Standard storage have different IOPS and throughput limits (IOPS are not exposed per VHD). Look at the data to see if you're the hitting the limits of combined throughput MB of the VHD(s) at VM level using Disk Read and Write, then optimize your VM storage configuration to scale past single VHD limits. Read more about different standard storage disk offerings and per disk limits:
High disk utilization/latency remediation
Reduce Client Latency and Optimize VM IO to scale past VHD Limits
Reduce throttling
If hitting upper limits of storage accounts, re-balance the VHDs between storage accounts. Refer to Azure Storage Scalability and Performance Targets.
Increase throughput and reduce latency
If you have a latency sensitive application and require high throughput, migrate your VHDs to Azure Premium storage using the DS and GS series VM.
These articles discuss the specific scenarios:
Contact us for help
If you have questions or need help, create a support request, or ask Azure community support. You can also submit product feedback to Azure feedback community.
Feedback
Coming soon: Throughout 2024 we will be phasing out GitHub Issues as the feedback mechanism for content and replacing it with a new feedback system. For more information see: https://aka.ms/ContentUserFeedback.
Submit and view feedback for