Troubleshooting and known issues for snapshot debugging in Visual Studio
Applies to: Visual Studio
This article provides resolutions of common issues that you may encounter when you debug an Azure app with Snapshot Debugger in Visual Studio.
If the steps described in this article don't resolve your issue, search for the problem on Developer Community or report a new issue by choosing Help > Send Feedback > Report a Problem in Visual Studio.
Issue: "Attach Snapshot Debugger" encounters an HTTP status code error
If you see the following error in the Output window during the attempt to attach, it may be a known issue listed in the following sections. Try the proposed solutions, and if the issue continues to persist, contact the preceding alias.
[TIMESTAMP] Error --- Unable to Start Snapshot Debugger - Attach Snapshot Debugger failed: System.Net.WebException: The remote server returned an error: (###) XXXXXX
(401) Unauthorized
This error indicates that the REST call issued by Visual Studio to Azure uses an invalid credential.
Take these steps:
- Make sure that your Visual Studio personalization account has permissions to the Azure subscription and resource that you're attaching to. A quick way to determine this is to check whether the resource is available in the dialog box from Debug > Attach Snapshot Debugger... > Azure Resource > Select Existing, or in Cloud Explorer.
- If this error continues to persist, use one of the feedback channels described in the beginning of this article.
If you have enabled Authentication/Authorization (EasyAuth) on your App Service, you may encounter a 401 error with LaunchAgentAsync in the call stack error message. Ensure Action to take when request is not authenticated is set to Allow Anonymous requests (no action) in the Azure portal and provide an authorization.json in D:\Home\sites\wwwroot with the following content instead.
{
  "routes": [
    {
      "path_prefix": "/",
      "policies": {
        "unauthenticated_action": "RedirectToLoginPage"
      }
    },
    {
      "http_methods": [ "POST" ],
      "path_prefix": "/41C07CED-2E08-4609-9D9F-882468261608/api/agent",
      "policies": {
        "unauthenticated_action": "AllowAnonymous"
      }
    }
  ]
}
The first route effectively secures your app domain similar to Log in with [IdentityProvider]. The second route exposes the SnapshotDebugger AgentLaunch endpoint outside of authentication, which performs the pre-defined action of starting the SnapshotDebugger diagnostic agent only if the SnapshotDebugger preinstalled site extension is enabled for your app service. For more information on the authorization.json configuration, see URL authorization rules.
(403) Forbidden
The 403 - Forbidden error indicates that permission is denied. Many different scenarios may cause this error.
Take these steps:
- Verify that your Visual Studio account has a valid Azure subscription with the necessary Role-Based Access Control (RBAC) permissions for the resource. For AppService, check if you have permissions to query the App Service Plan hosting your app.
- Verify the timestamp of your client machine is correct and up-to-date. Servers with timestamps off by more than 15 minutes of the request timestamp usually produce this error.
- If this error continues to persist, use one of the feedback channels described in the beginning of this article.
(404) Not Found
The 404 - Not Found error indicates that the website couldn't be found on the server.
Take these steps:
- Verify that you have a website deployed and running on the App Service resource that you're attaching to.
- Verify that the site is available at https://<resource>.azurewebsites.net
- Verify that your properly running custom web application doesn't return a status code of 404 when accessed at https://<resource>.azurewebsites.net.
- If this error continues to persist, use one of the feedback channels described in the beginning of this article.
(406) Not Acceptable
The 406 - Not Acceptable error indicates the server is unable to respond to the type set in the Accept header of the request.
Take these steps:
- Verify that your site is available at https://<resource>.azurewebsites.net.
- Verify that your site hasn't been migrated to new instances. Snapshot Debugger uses the notion of ARRAffinity for routing requests to specific instances that can produce this error intermittently.
- If this error continues to persist, use one of the feedback channels described in the beginning of this article.
(409) Conflict
The 409 - Conflict error indicates that the request conflicts with the current server state.
This is a known issue that occurs when a user attempts to attach Snapshot Debugger against an AppService that has enabled ApplicationInsights. ApplicationInsights sets the AppSettings with a different casing than Visual Studio, causing this issue.
We've resolved this in Visual Studio 2019.
Take these steps:
- If this error continues to persist, use one of the feedback channels described in the beginning of this article.
(500) Internal Server Error
The 500 - Internal Server Error error indicates that the site is down or the server can't handle the request. Snapshot Debugger only functions on running applications. Application Insights Snapshot Debugger provides snapshotting on exceptions and may be the best tool for your needs.
(502) Bad Gateway
The 502 - Bad Gateway error indicates a server-side networking issue and may be temporary.
Take these steps:
- Try waiting a few minutes before attaching the Snapshot Debugger again.
- If this error continues to persist, use one of the feedback channels described in the beginning of this article.
Issue: Snappoint isn't turned on
If you see a warning icon ![]() with your snappoint instead of the regular snappoint icon, then the snappoint isn't turned on.
with your snappoint instead of the regular snappoint icon, then the snappoint isn't turned on.
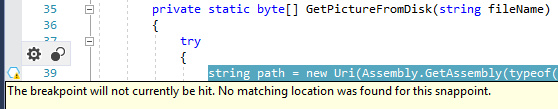
Take these steps:
- Make sure you use the same version of source code to build and deploy your app.
- Make sure you're loading the correct symbols for your deployment.
- To do this, view the Modules window while Snapshot Debugging and verify the Symbol File column shows a .pdb file loaded for the module you're debugging.
- The Snapshot Debugger will try to automatically download and use symbols for your deployment.
Issue: Symbols don't load when I open a Snapshot
If you see the following window, symbols didn't load.
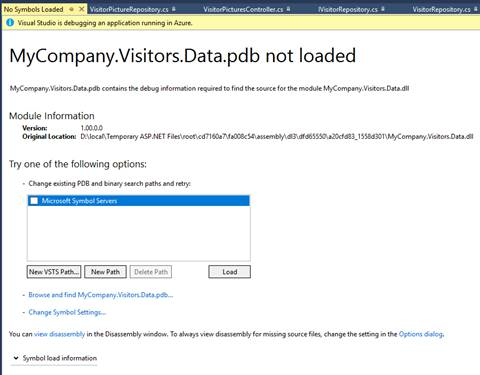
Take these steps:
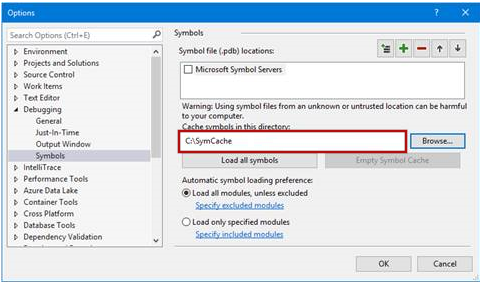
Select Change Symbol Settings… on the page.
In the Debugging > Symbol settings, add a symbol cache directory.
Restart snapshot debugging after the symbol path has been set.
The symbols, or .pdb files, available in your project must match your App Service deployment. Most deployments (deployment through Visual Studio, CI/CD with Azure Pipelines or Kudu, etc.) publish your symbol files along to your App Service. Setting the symbol cache directory enables Visual Studio to use these symbols.
Alternatively, if your organization uses a symbol server or drops symbols in a different path, use the symbol settings to load the correct symbols for your deployment.
Issue: I can't see the "Attach Snapshot Debugger" option in the Cloud Explorer
Take these steps:
Make sure the Snapshot Debugger component is installed. Open the Visual Studio Installer, and check the Snapshot Debugger component in the Azure workload.
For Visual Studio 2019 or later versions, make sure your app is supported:
- Azure App Services - ASP.NET applications running on .NET Framework 4.6.1 or later.
- Azure App Services - ASP.NET Core applications running on .NET Core 2.0 or later on Windows.
- Azure Virtual Machines (and virtual machine scale set) - ASP.NET applications running on .NET Framework 4.6.1 or later.
- Azure Virtual Machines (and virtual machine scale set) - ASP.NET Core applications running on .NET Core 2.0 or later on Windows.
- Azure Kubernetes Services - ASP.NET Core applications running on .NET Core 2.2 or later on Debian 9.
- Azure Kubernetes Services - ASP.NET Core applications running on .NET Core 2.2 or later on Alpine 3.8.
- Azure Kubernetes Services - ASP.NET Core applications running on .NET Core 2.2 or later on Ubuntu 18.04.
Issue: I only see Throttled Snapshots in the Diagnostic Tools
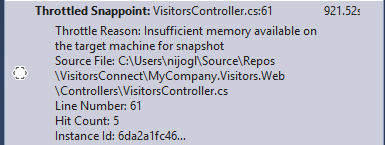
Take these steps:
- Snapshots take up little memory but do have a commit charge. If the Snapshot Debugger detects your server is under heavy memory load, it will not take snapshots. You can delete already captured snapshots by stopping the Snapshot Debugger session and trying again.
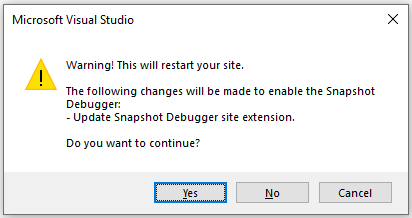
Issue: Snapshot debugging with multiple versions of the Visual Studio gives me errors (Visual Studio 2019 or later versions)
Visual Studio 2019 requires a newer version of the Snapshot Debugger site extension on your Azure App Service. This version isn't compatible with the older version of the Snapshot Debugger site extension used by Visual Studio 2017. You'll get the following error if you try to attach the Snapshot Debugger in Visual Studio 2019 to an Azure App Service that has been previously debugged by the Snapshot Debugger in Visual Studio 2017:
Conversely, if you use Visual Studio 2017 to attach the Snapshot Debugger to an Azure App Service that has been previously debugged by the Snapshot Debugger in Visual Studio 2019, you'll get the following error:
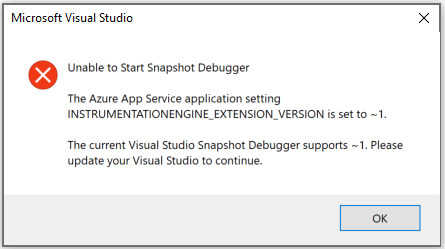
To fix this, delete the following App settings in the Azure portal and attach the Snapshot Debugger again:
INSTRUMENTATIONENGINE_EXTENSION_VERSIONSNAPSHOTDEBUGGER_EXTENSION_VERSION
Issue: I'm attaching to the wrong/old Azure resource or storage account
Take these steps:
The "Azure resource" and "Storage account" entries use resource names as keys so actions such as migrating a resource to different subscriptions can cause problems. To clear out the list, follow these steps:
Run these commands in Developer command prompt for VS (with admin privileges).
vsregedit remove local HKCU SnapshotDebugger AzureResourcesMRU
vsregedit remove local HKCU SnapshotDebugger StorageAccountsMRU
Delete any .suo files associated with the web app.
Issue: I'm having problems Snapshot Debugging and I need to enable more logging
Enable agent logs
To enable and disable agent logging, open Visual Studio and navigate to Tools>Options>Snapshot Debugger>Enable agent logging. Note if Delete old agent logs on session start is also enabled, each successful Visual Studio attach will delete previous agent logs.
You can find agent logs in the following locations:
- App Services:
- Navigate to your App Service's Kudu site (that is, <yourappservice>.scm.azurewebsites.net) and navigate to Debug Console.
- Agent logs are stored in the following directory: D:\home\LogFiles\SiteExtensions\DiagnosticsAgentLogs\.
- VM/VMSS:
- Sign in to your VM, agent logs are stored as follows: C:\WindowsAzure\Logs\Plugins\Microsoft.Azure.Diagnostics.IaaSDiagnostics<Version>\SnapshotDebuggerAgent*.txt_
- AKS
- Navigate to the following directory: /tmp/diag/AgentLogs/*
Enable Profiler/Instrumentation logs
You can find Instrumentation logs in the following locations:
- App Services:
- Error logging is automatically sent to D:\Home\LogFiles\eventlog.xml, events are marked with
<Provider Name="Instrumentation Engine" />or "Production Breakpoints"
- Error logging is automatically sent to D:\Home\LogFiles\eventlog.xml, events are marked with
- VM/VMSS:
- Sign in to your VM and open Event Viewer.
- Open the following view: Windows Logs>Application.
- Filter Current Log by Event Source using either Production Breakpoints or Instrumentation Engine.
- AKS
- Instrumentation engine logging at /tmp/diag/log.txt (set
MicrosoftInstrumentationEngine_FileLogPathin DockerFile) - ProductionBreakpoint logging at /tmp/diag/shLog.txt
- Instrumentation engine logging at /tmp/diag/log.txt (set
Known issues
- Snapshot debugging with multiple Visual Studio clients against the same App Service isn't currently supported.
- Roslyn IL optimizations aren't fully supported in ASP.NET Core projects. For some ASP.NET Core projects, you may not be able to see some variables or use some variables in conditional statements.
- Special variables, such as
$FUNCTIONor$CALLER, can't be evaluated in conditional statements or logpoints for ASP.NET Core projects. - Snapshot debugging doesn't work on App Services that have Local Caching turned on.
- Snapshot debugging API Apps isn't currently supported.
Site extension upgrade
Snapshot Debugging and Application Insights depend on an ICorProfiler, which loads into the site process and causes file locking issues during upgrade. We recommend this process to ensure there's no down-time to your production site.
- Create a Deployment Slot within your App Service and deploy your site to the Slot.
- Swap the Slot with production from Cloud Explorer in Visual Studio or from the Azure portal.
- Stop the Slot site. It takes a few seconds to kill off the site w3wp.exe process from all instances.
- Upgrade the Slot site extension from the Kudu site or the Azure portal (App Service Blade > Development Tools > Extensions > Update).
- Start the Slot site. We recommend visiting the site to warm it up again.
- Swap the Slot with production.
References
Feedback
Coming soon: Throughout 2024 we will be phasing out GitHub Issues as the feedback mechanism for content and replacing it with a new feedback system. For more information see: https://aka.ms/ContentUserFeedback.
Submit and view feedback for