Lab 3 Troubleshooting performance and GC issues with dotnet-dump in Linux
Article
Applies to: .NET Core 2.1, .NET Core 3.1, .NET 5
This article introduces how to use the dotnet-dump tool to capture and analyze .NET Core dumps and use dotnet-gcdump to generate GC related reports in Linux.
Prerequisites
The minimum requirements to follow these troubleshooting labs are as follows:
An ASP.NET Core application to demonstrate low-CPU and high-CPU performance problems and crash issues.
The lldb debugger, installed and configured to load SOS extension when a core dump file is opened.
If you have followed the previous parts of this series, you should have the following setup ready to go:
Nginx is configured to host two websites:
The first listens for requests by using the myfirstwebsite host header (http://myfirstwebsite) and routing requests to the demo ASP.NET Core application that listens on port 5000.
The second listens for requests by using buggyamb host header (http://buggyamb) and routing requests to the second ASP.NET Core sample buggy application that listens on port 5001.
Both ASP.NET Core applications should be running as services that restart automatically when the server is restarted or the application stops responding.
The Linux local firewall is enabled and configured to allow SSH and HTTP traffic.
In this part, you'll learn how to use dotnet-dump to capture and analyze core dump files without any native debugger. Then, you'll learn how to use dotnet-gcdump to generate GC-related reports that you can open on a Windows-based computer.
Dotnet-dump
dotnet-dump is another way to collect and analyze core dump files without having to use a native debugger, such as lldb on Linux. This tool also enables you to run SOS commands in order to analyze crashes and Garbage Collector (GC)-related issues. Dotnet-dump is available in .NET Core 3.0 SDK and later versions only.
Note
Dotnet-dump isn't a native debugger. Therefore, some features, such as displaying the native stack frames, aren't available in this tool.
If you haven't installed dotnet-dump, you can install it now by running the following command:
.NET CLI
dotnettool install -g dotnet-dump
To manually capture core dump files, you can use the dotnet-dump collect command. For example, dotnet-dump collect -p 11724. The tool will collect the same core dump files that you collected by using createdump or ProcDump.
The most important feature of dotnet-dump is that it can be used to open .NET Core dump files and run SOS commands, the same as lldb. You'll still have to set up symbols and install SOS extension to be able to analyze a dump file bu using dotnet-dump.
Note
If you previously worked with lldb, you should have already symbols set up, and installed SOS. Therefore, you should be able to open the same .NET Core version dump files without having to download the symbols again. If you open a different .NET Core version dump file for which the symbols haven't yet been downloaded, you'll have to download the symbols for that version of .NET Core before you start the analysis.
Collect core dump files by using dotnet-dump
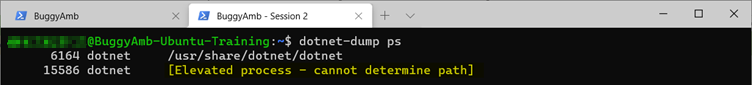
To collect a core dump file by using dotnet-dump, you'll use the dotnet-dump collect <PID> command. Determining the PID should be an easy task for you at this point. However, should you need help, this command includes a ps parameter. The dotnet-dump ps command lists the dotnet processes that you can collect a dump file from.
If you try to run the dotnet-dump ps command, you'll encounter some unexpected results.
Two processes are displayed in this list. However, one of them is shown as an elevated process, and its path can't be determined by the dotnet-dump ps command. To find its path, examine the process command-line information by running the cat /proc/<PID>/cmdline command.
Note
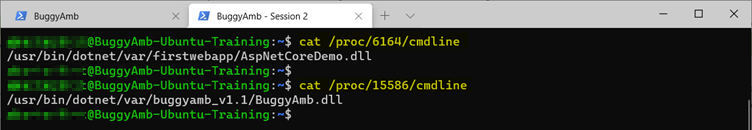
In this command, replace <PID> with the actual process ID of the target process, as seen in the following sample output. You may recall the special /proc/ directory from previous sections, and that a process in Linux can be seen as another folder under that directory (having the name of process ID). You can find all the details about a process by examining the /proc/<PID>/ directory structure.
As shown in this screenshot, the output of the first command (cat /proc/6164/cmdline) tells you that this is your first demo ASP.NET Core application. The output of the second command (cat /proc/15586/cmdline) tells you that this is your buggy application.
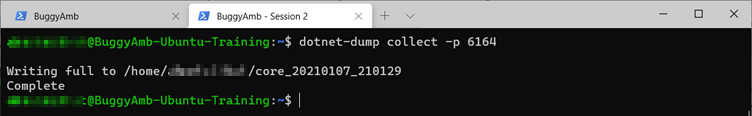
Although the dotnet-dump ps command wasn't able to retrieve the process path, it should still be able to generate the necessary dump files to troubleshoot. Try capturing a core dump file by using the dotnet-dump collect command. First, try the demo application for which the tool was able to display the process path. Run dotnet-dump collect -p 6164 (the process PID will be different when you try the exercise).
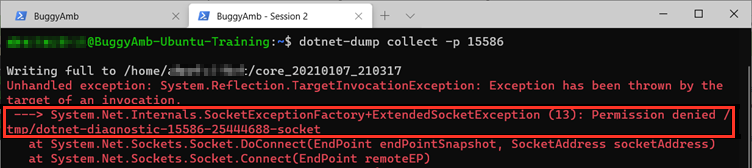
Generating the memory dump file is successful. Now, try to collect a core dump file for the buggy application for which the tool could not list the process path when you used the dotnet-dump ps command. Run dotnet-dump collect -p 15586, and notice that this fails unexpectedly.
When you noticed that the dotnet-dump ps command could not get the process path, you may have suspected that trying to generate the core dump file would fail.
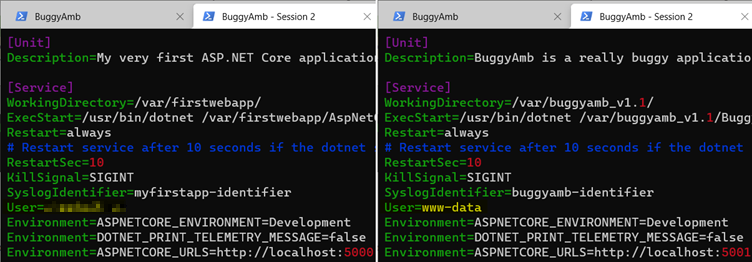
From the previous error message, you can determine that there is a permission issue involved. But what is the difference between the two processes, the first hosting the .NET 5 sample application and the second hosting the .NET Core 3 application? Compare the service files for each process. You should be able to spot the difference with relative ease: The user account that runs each process is different.
The left side of the list corresponds to the first demo application, in which everything works fine, and the application runs as <User Name> (or the user account that you used when you set up the environment and logged in). The right side corresponds to the buggy application, for which the dump file collection failed. and the application runs as www-data user.
The solution to this issue is discussed on the official GitHub page.
As a summary, if you're running your service process as a different user than the one for the account that you used to log in, you should run the dotnet-dump collect command as follows.
Here's the format of the command:
Bash
sudo -H -u <user name of service> bash -c "<full path to dotnet tools>/dotnet-dump collect -p <PID> -o <output path>"
You can determine the full path of the dotnet-dump tool by using the whereis dotnet-dump command.
The output path should be a directory where the user has the Write permission. Usually, you can create the directory under the /tmp directory, and then copy the dump file to your home directory later.
Open and analyze core dump files by using dotnet-dump
For this exercise, you don't have to capture a new dump file. Instead, you can open one of the previous dump files that you captured by using createdump. If you prefer, you can open a core dump file that you captured by using dotnet-dump.
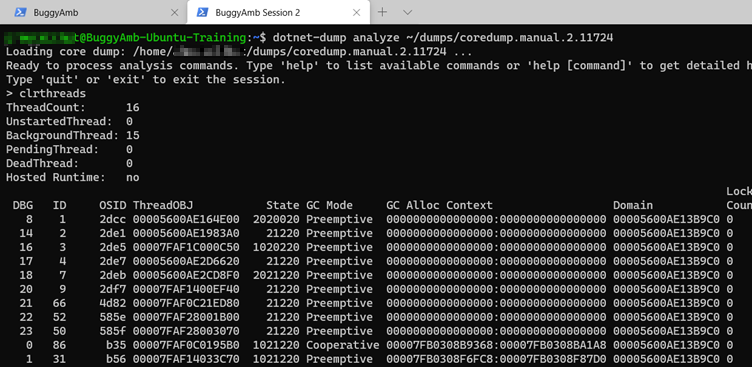
To open the dump file by using dotnet-dump, run dotnet-dump analyze ~/dumps/coredump.manual.2.11724 (the name of the memory dump file will be different on your computer). This is the same managed debugger engine that you used earlier in lldb. If your symbols are correctly configured and SOS is installed correctly, you can run any SOS commands, the same as you can by using lldb. In the following list, you can see the clrstack command in action.
There are two things to keep in mind:
Because this isn't a native debugger, you can't run lldb native debugger commands, such as the memory read command that you were instructed to use in lldb earlier. You can run only SOS commands.
Auto-completion isn't working. In lldb, you can start typing a command and then press the TAB key to auto-complete the command, the same as you did in the command line and shell. The feature isn't working for dotnet-dump. However, this shouldn't affect your training.
While you have the core dump file open, take this opportunity to practice a few new SOS commands.
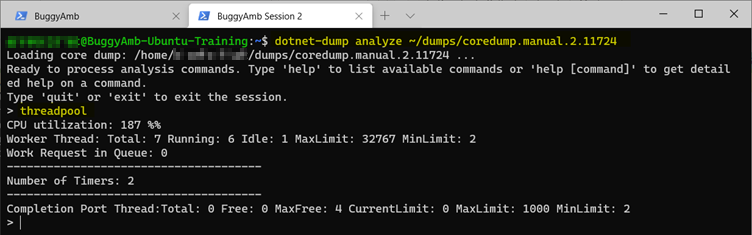
How can you check the CPU usage in a dump? The threadpool command might help to reveal this information. It reports the "total CPU usage of server" (not only for the process that's being debugged), but it still provides a general idea of the resource consumption on the computer at the time that the memory dump file was generated. The following screenshot shows that the server's total CPU usage was around 94%.
Note
The server that was used to create these lists was equipped with two CPUs. This is why it generates reports such as this.
The same output also shows thread pool configuration and, in the previous list, that seven worker threads were available and six of them were running. This information would be useful when you troubleshoot thread pool configuration issues.
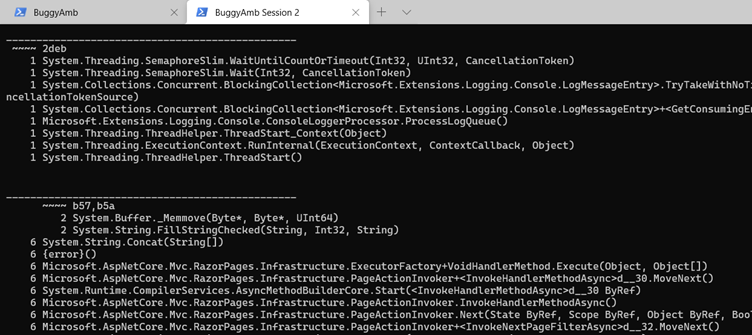
Do you want to group the call stack of all running threads and show a merged display, similar to the Visual Studio Parallel Stacks panel? Run pstacks to obtain a similar result.
To further your understanding of the available SOS commands, open SOS Help, and review each command individually to familiarize yourself with the power of SOS debugging.
Dotnet-dump is useful if installing lldb isn't an option for you. The training continues by introducing another approach to analyzing GC heaps.
Dotnet-gcdump
Dotnet-gcdump is another useful tool. It is available in .NET Core 3.1 or later versions.
The idea behind this tool is that you don't need a full process dump to be able to complete an investigation in many scenarios in which you mainly want to look at the managed heap. So, why not just capture the heap information and generate a report about it? Most importantly, those GC dump files that are generated by this tool are portable and can be analyzed on a Windows computer. Because this type of dump file contains only the GC heap information, you can't open it in lldb to investigate the threads or the thread call stacks. But you can open it in PerfView or in Visual Studio.
This might sound promising, but… There is one thing that you have to be aware of: Dotnet-gcdump triggers a Gen 2 GC collection in your process to gather the data it needs. Use this tool carefully in production. Don't use it unless you know that you definitely have to.
When might you need to use this tool? If your process is already in a nonresponsive (hung) state, and there is nothing to recover from the situation, and you intend to restart the application. Then, you can capture a gcdump before the restart so that you would have at least one set of information to analyze at a later stage.
The information captured by this tool will be useful for the following tasks:
Compare the number of objects by type on the heap.
Analyze the object roots.
Determine which objects have a reference to what types.
Other statistical analysis about objects on the heap.
If you haven't yet installed this tool, do so now. You have only to run the following command:
Bash
dotnet tool install --global dotnet-gcdump
Collect gcdump with dotnet-gcdump command
The same rule applies to dotnet-gcdump that applied to the dotnet-dump tool: If you run your process for a different user, you have to run the command in the following format:
Bash
sudo -H -u <user name of service> bash -c "<full path to dotnet tools>/dotnet-gcdump collect -p <PID> -o <output path>"
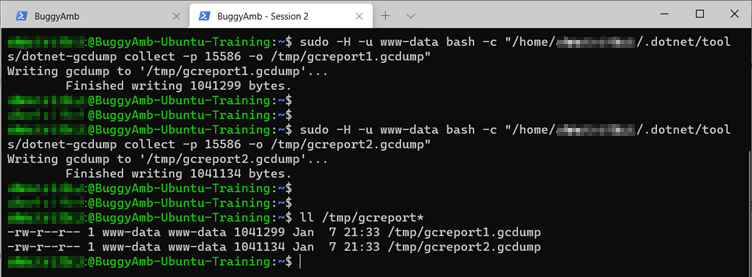
You should now have everything that you need to collect process information by using the tool. The objective will be to collect two sets of data, just as you did by using core dump files. The target process is again running for a different user. Therefore, you'll have to use the "bash" format for the startup command.
Here are the steps:
Reproduce the performance problem by running six requests to the Slow page by using the Load Generator tool that's included in the ASP.NET Core website.
Collect the first gcdump by running the following command:
Note: In this command, replace your PID with the original PID.
Remember that you're troubleshooting a performance problem. It's a good idea to have multiple sets of data so that you can compare how the managed heap evolved over time. The result of these commands will be that two gcdump files are generated.
Create reports from gcdump files
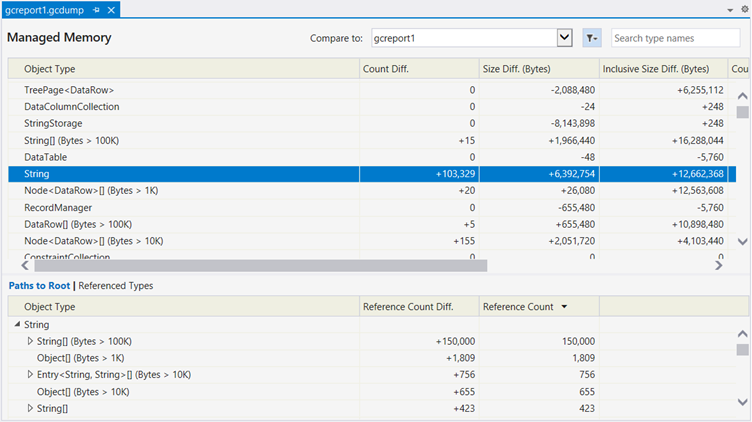
Copy both gcdump files to your Windows-based computer, and open them in Visual Studio 2019. The following screenshot shows the comparison results of both gcdump files taken for this list. As you can see, there's a big difference between the String object type values. You can also get some root information about objects.
This can be useful information.
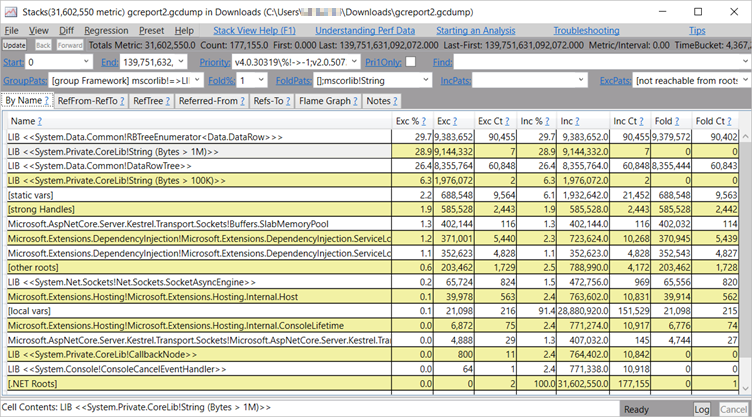
Alternatively, you can open gcdump reports in PerfView.
If you have to look at only the managed heap, then this could be the fastest option for you. Just remember to exercise caution when you use dotnet-gcdump in production, because as mentioned earlier, it will trigger a full GC in your process, and this might cause long pauses. Use this tool in production carefully and only when necessary when you troubleshoot a memory problem.
Utilize Web App Down, Crash Monitoring, and Ask Genie for troubleshooting. Use these tools to monitor application and platform availability, identify unhandled exceptions, capture memory dumps and callstack, and find areas of investigation and diagnostics.
This article describes how to use the createdump tool to capture .NET Core crash dumps in Linux and open the dump in lldb to diagnose the crash problem.
This article helps you analyze performance problems and describes how to use createdump and ProcDump to capture memory .NET Core dumps manually in Linux.
This article describes the process of reproducing the .NET Core crash problem in Linux, and checking the Nginx tool and system logs for crash symptoms and indications.