Debug from a DLL project in Visual Studio (C#, C++, Visual Basic, F#)
One way to debug a DLL project is to specify the calling app in the DLL project properties. Then you can start debugging from the DLL project itself. For this method to work, the app must call the same DLL in the same location as the one you configure. If the app finds and loads a different version of the DLL, that version won't contain your breakpoints. For other methods of debugging DLLs, see Debugging DLL projects.
If your managed app calls a native DLL, or your native app calls a managed DLL, you can debug both the DLL and the calling app. For more information, see How to: Debug in mixed mode.
Native and managed DLL projects have different settings to specify calling apps.
Specify a calling app in a native DLL project
Select the C++ DLL project in Solution Explorer. Select the Properties icon, press Alt+Enter, or right-click and choose Properties.
In the <Project> Property Pages dialog box, make sure the Configuration field at the top of the window is set to Debug.
Select Configuration Properties > Debugging.
In the Debugger to launch list, choose either Local Windows Debugger or Remote Windows Debugger.
In the Command or Remote Command box, add the fully qualified path and filename of the calling app, such as an .exe file.

Add any necessary program arguments to the Command Arguments box.
Select OK.
Specify a calling app in a C# DLL project (.NET Core, .NET 5+)
Select the C# or Visual Basic DLL project in Solution Explorer. Select the Properties icon, press Alt+Enter, or right-click and choose Properties.
In the Debug tab, select Open Debug launch profiles UI.
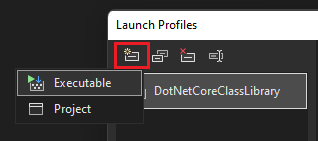
In the Launch Profiles dialog box, select the Create a new profile icon, and choose Executable.
In the new profile, under Executable, browse to the location of the executable (.exe file) and select it.
In the Launch Profiles dialog box, note the name of the default profile, then select it and delete it.
Rename the new profile to the same name as the default profile.
Alternatively, you can manually edit launchSettings.json to get the same result. You want the first profile in launchSettings.json to match the name of the Class Library, and you want it listed first in the file.
Specify a calling app in a managed DLL project
Select the C# or Visual Basic DLL project in Solution Explorer. Select the Properties icon, press Alt+Enter, or right-click and choose Properties.
Make sure that the Configuration field at the top of the window is set to Debug.
Under Start action:
For .NET Framework DLLs, select Start external program, and add the fully qualified path and name of the calling app.
Or, select Start browser with URL and fill in the URL of a local ASP.NET app.
- For .NET Core DLLs in Visual Basic, the Debug Properties page is different. Select Executable from the Launch dropdown, and then add the fully qualified path and name of the calling app in the Executable field.
- For .NET Core DLLs, the Debug Properties page is different. Select Executable from the Launch dropdown, and then add the fully qualified path and name of the calling app in the Executable field.
Add any necessary command-line arguments in the Command line arguments or Application arguments field.

Use File > Save Selected Items or Ctrl+S to save changes.
Debug from the DLL project
Set breakpoints in the DLL project.
Right-click the DLL project and choose Set as Startup Project.
Make sure the Solutions Configuration field is set to Debug. Press F5, click the green Start arrow, or select Debug > Start Debugging.
Additional tips:
If debugging does not hit your breakpoints, make sure that your DLL output (by default, the <project>\Debug folder) is the location that the calling app is calling.
If you want to break into code in a managed calling app from a native DLL, or vice versa, enable mixed mode debugging.
In some scenarios, you may need to tell the debugger where to find the source code. For more information, see Use the No Symbols Loaded/No Source Loaded pages.
Related content
Feedback
Coming soon: Throughout 2024 we will be phasing out GitHub Issues as the feedback mechanism for content and replacing it with a new feedback system. For more information see: https://aka.ms/ContentUserFeedback.
Submit and view feedback for