Visual Studio productivity guide for C# developers
Learn how Visual Studio makes .NET developers who use C# more productive than ever. Take advantage of our performance and productivity improvements like navigation to decompiled assemblies, variable name suggestions as you type, a hierarchy-view in Test Explorer, Go To All (Ctrl+T) to navigate to file/type/member/symbol declarations, an intelligent Exception Helper, code style configuration and enforcement, and many refactorings and code fixes.
For general productivity for .NET, C++, and other languages, see Productivity guide for Visual Studio. For information about helpful keyboard shortcuts, see Productivity shortcuts. For a complete list of command shortcuts, see Default keyboard shortcuts.
Use keyboard shortcuts from a different editor
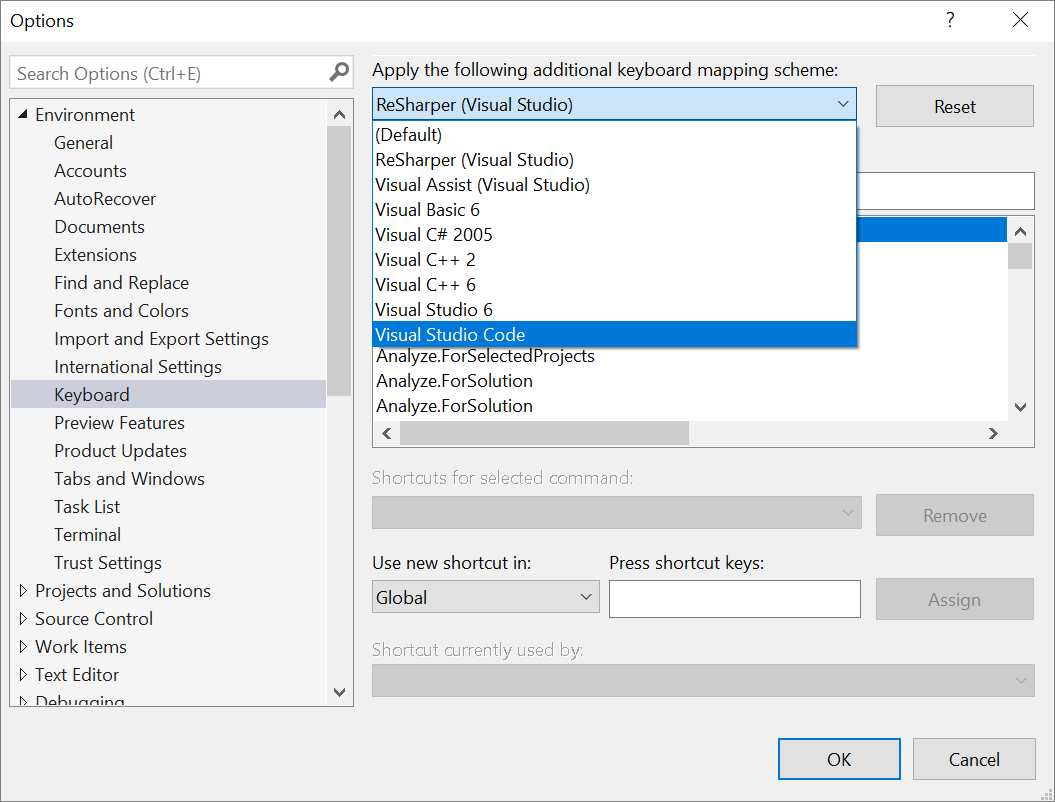
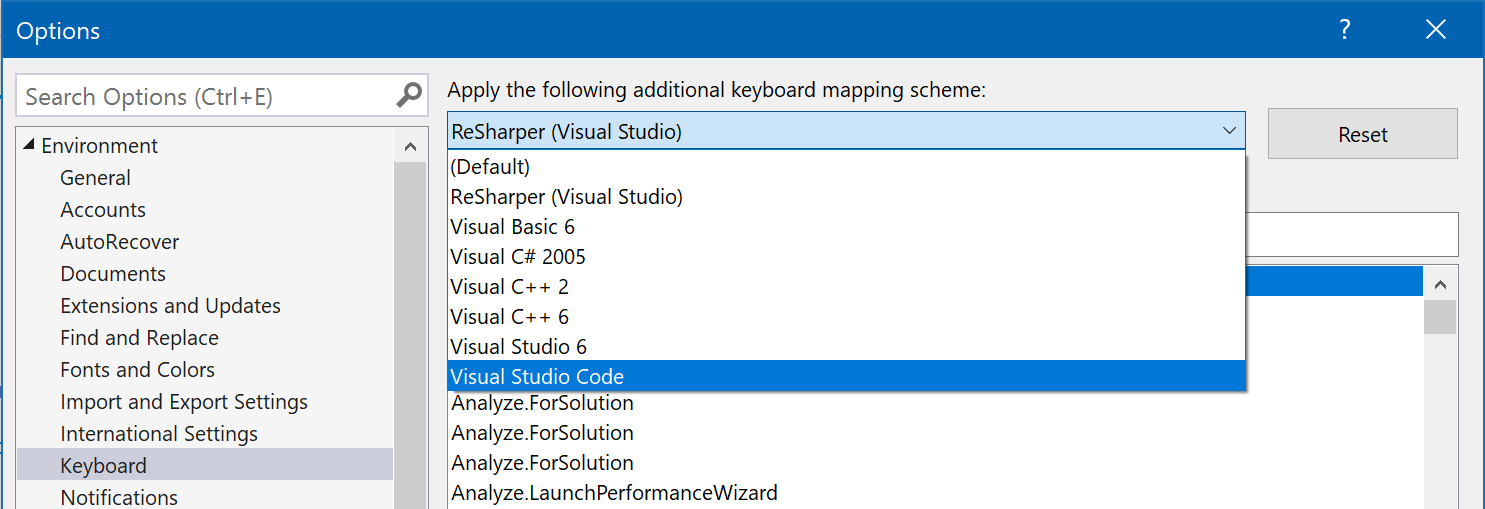
If you're coming from another IDE or coding environment, you can change your keyboard scheme to Visual Studio Code or ReSharper (Visual Studio):
Some extensions also offer keyboard schemes:
The following are popular Visual Studio shortcuts:
| Shortcut (All Profiles) | Command | Description |
|---|---|---|
| Ctrl+T | Go To All | Navigate to any file, type, member, or symbol declaration |
| F12 (also Ctrl+Click) | Go To Definition | Navigate to where a symbol is defined |
| Ctrl+F12 | Go To Implementation | Navigate from a base type or member to its various implementations |
| Shift+F12 | Find All References | See all symbol or literal references |
| Alt+Home | Go To Base | Navigate up the inheritance chain |
| Ctrl+. (also Alt+Enter in C# Profile) | Quick Actions and Refactorings | See what code fixes, code generation actions, refactorings, or other quick actions are available at your cursor position or code selection |
| Ctrl+D | Duplicate line | Duplicates the line of code that the cursor is in |
| Shift+Alt++/- | Expand/Contract selection | Expands or contracts the current selection in the editor |
| Shift + Alt + . | Insert Next Matching Caret | Adds a selection and caret at the next location that matches the current selection |
| Ctrl+Q | Search | Search all Visual Studio settings |
| F5 | Start Debugging | Start debugging your application |
| Ctrl+F5 | Run without Debug | Run your application locally without debugging |
| Ctrl+K,D (Default Profile) or Ctrl+E,D (C# Profile) | Format Document | Cleans up formatting violations in your file based on your newline, spacing, and indentation settings |
| Ctrl+\,Ctrl+E (Default Profile) or Ctrl+W,E (C# Profile) | View Error List | See all errors in your document, project, or solution |
| Alt + PgUp/PgDn | Go to Next/Previous Issue | Jump to the previous/next error, warning, suggestion in your document |
| Ctrl+K,/ | Toggle single line comment/uncomment | This command adds or removes a single line comment depending on whether your selection is already commented |
| Ctrl+Shift+/ | Toggle block comment/uncomment | This command adds or removes block comments depending on what you've selected |
Note
Some extensions unbind the default Visual Studio keybindings. You can restore your keybindings to their defaults by going to Tools > Import and Export Settings > Reset all settings or Tools > Options > Keyboard > Reset.
For more information about keyboard shortcuts and commands, see Productivity shortcuts. Or, see Keyboard shortcuts in Visual Studio for a comprehensive list along with a downloadable cheat sheet.
Navigate quickly to files or types
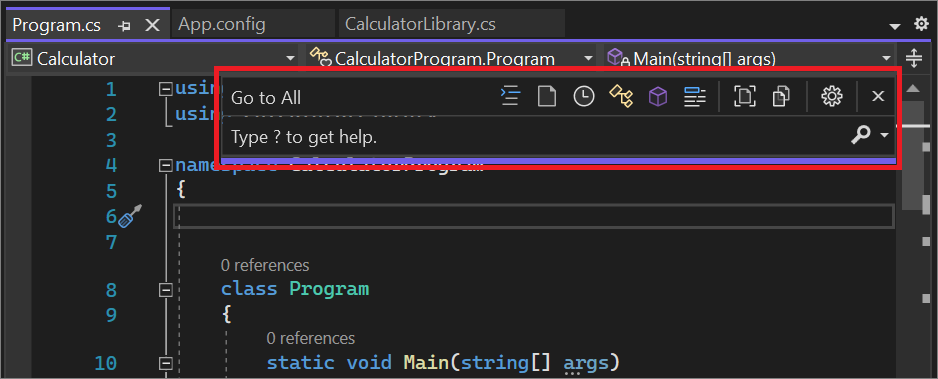
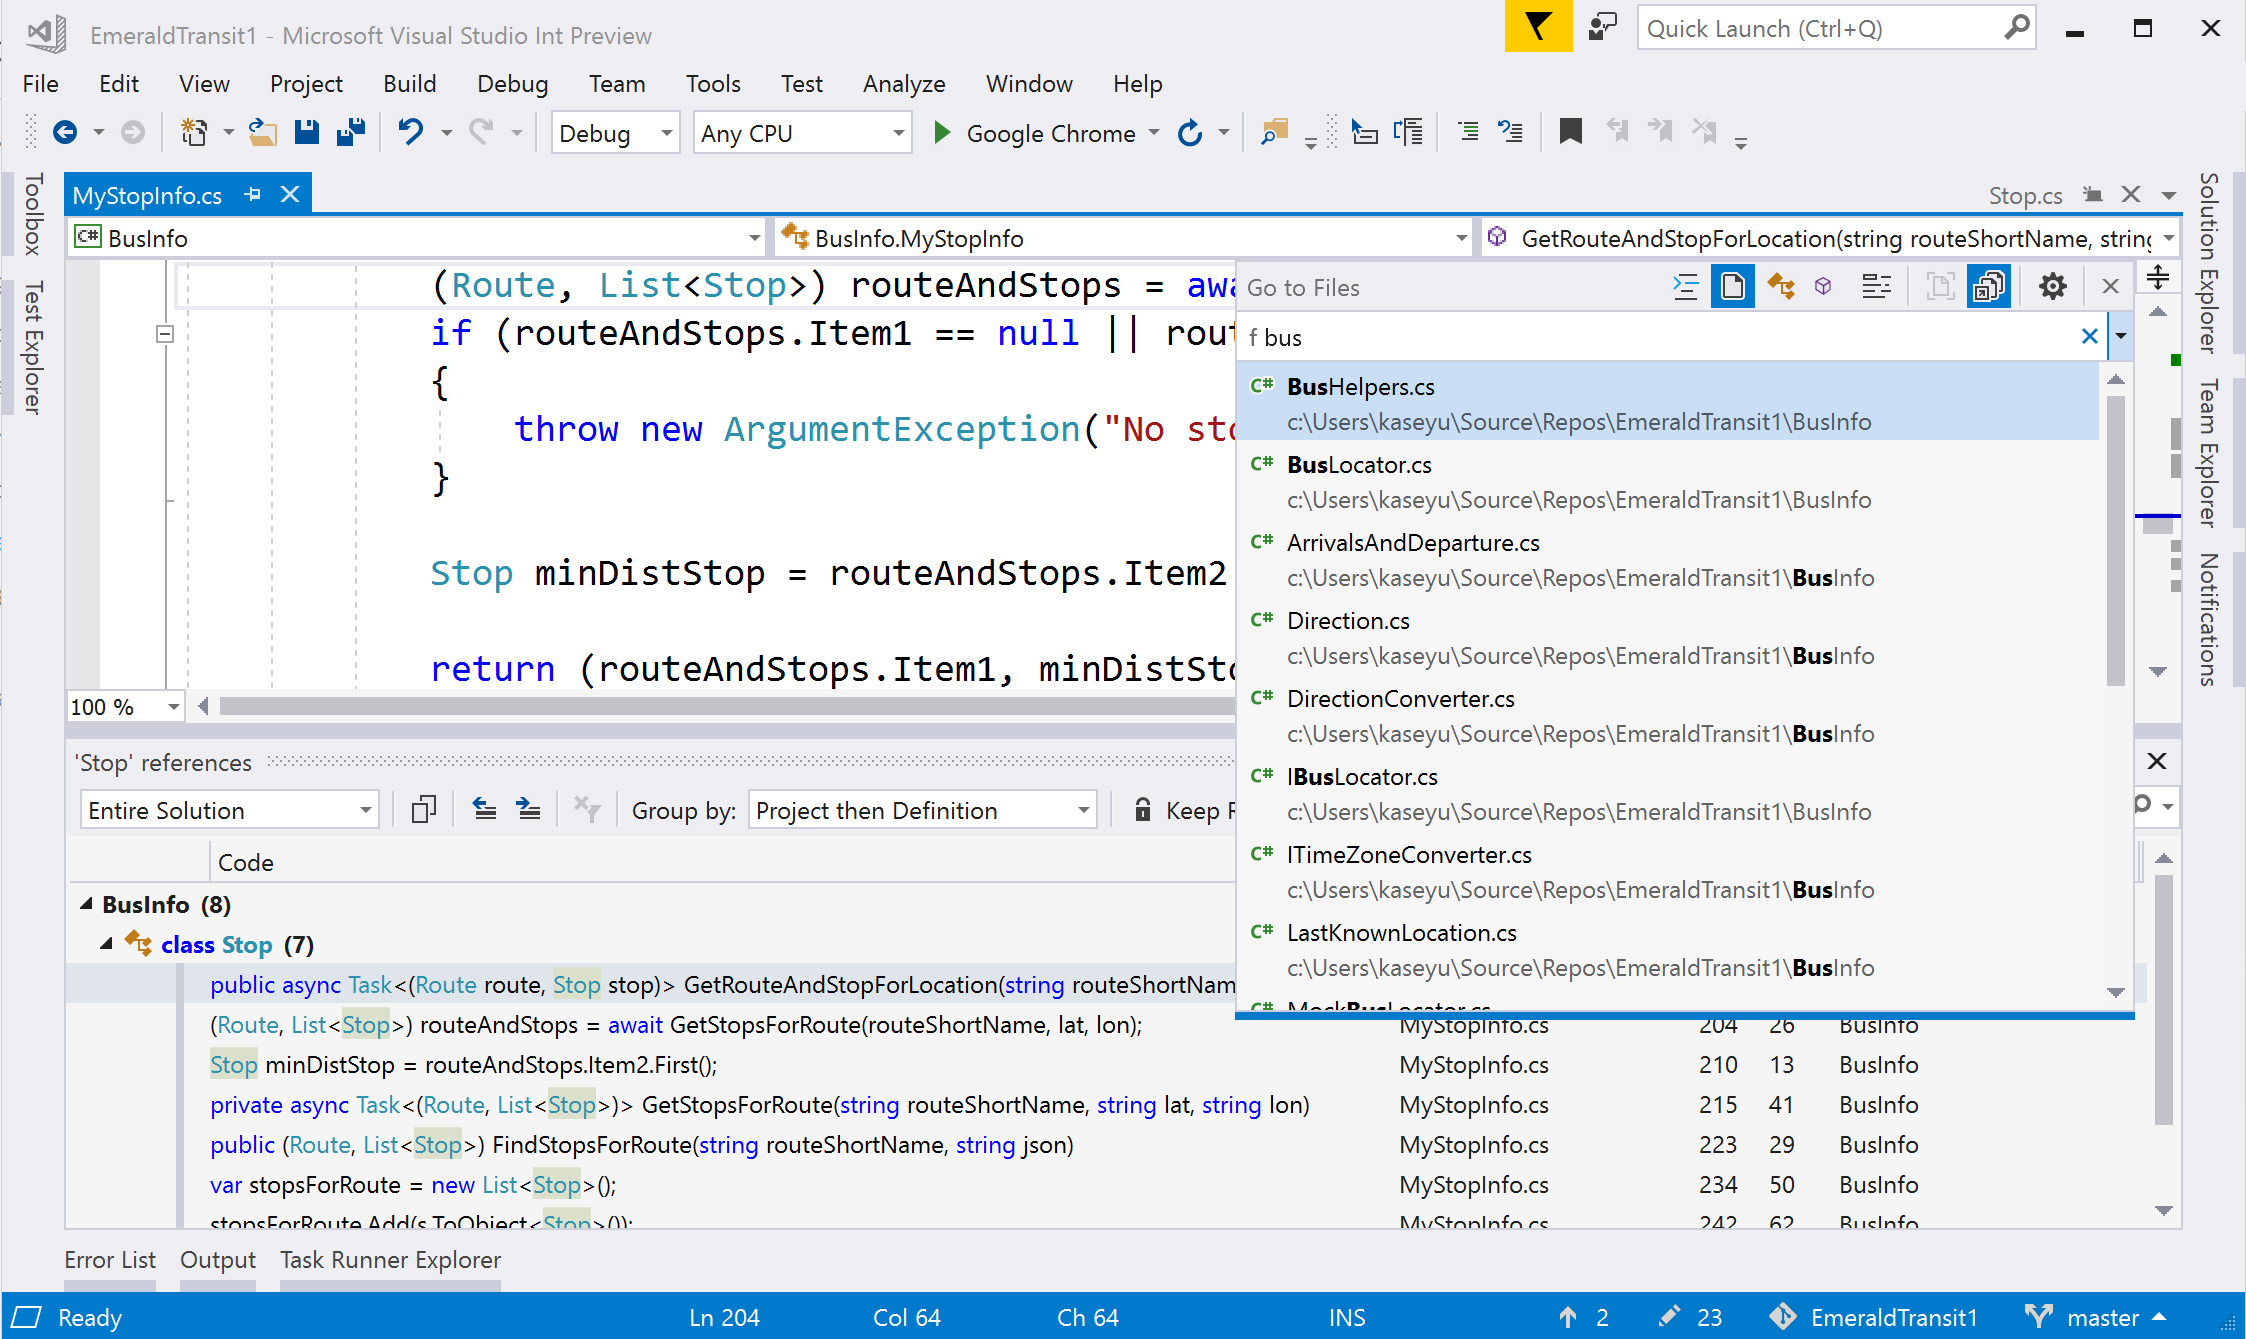
Visual Studio has a feature called Go To All that you can use to quickly jump to any file, type, member, or symbol declaration. To open it from the menu bar, select Edit > Go To > Go To All. Or, you can open it by using the Ctrl+T keyboard shortcut.
A small window is displayed at the top right of your code editor.
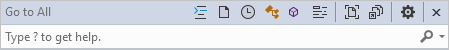
You can use this feature to perform the following actions:
- Change the location of its search bar or turn off the live navigation preview by using the gear icon.
- Filter results by using syntax such as
t mytype. - Scope your search to just the current document.
- Camel case matching is supported.
For more information about Go To All, see Find code by using Go To commands.
Enforce code style rules
You can use an EditorConfig file to codify coding conventions and have them travel with your source.
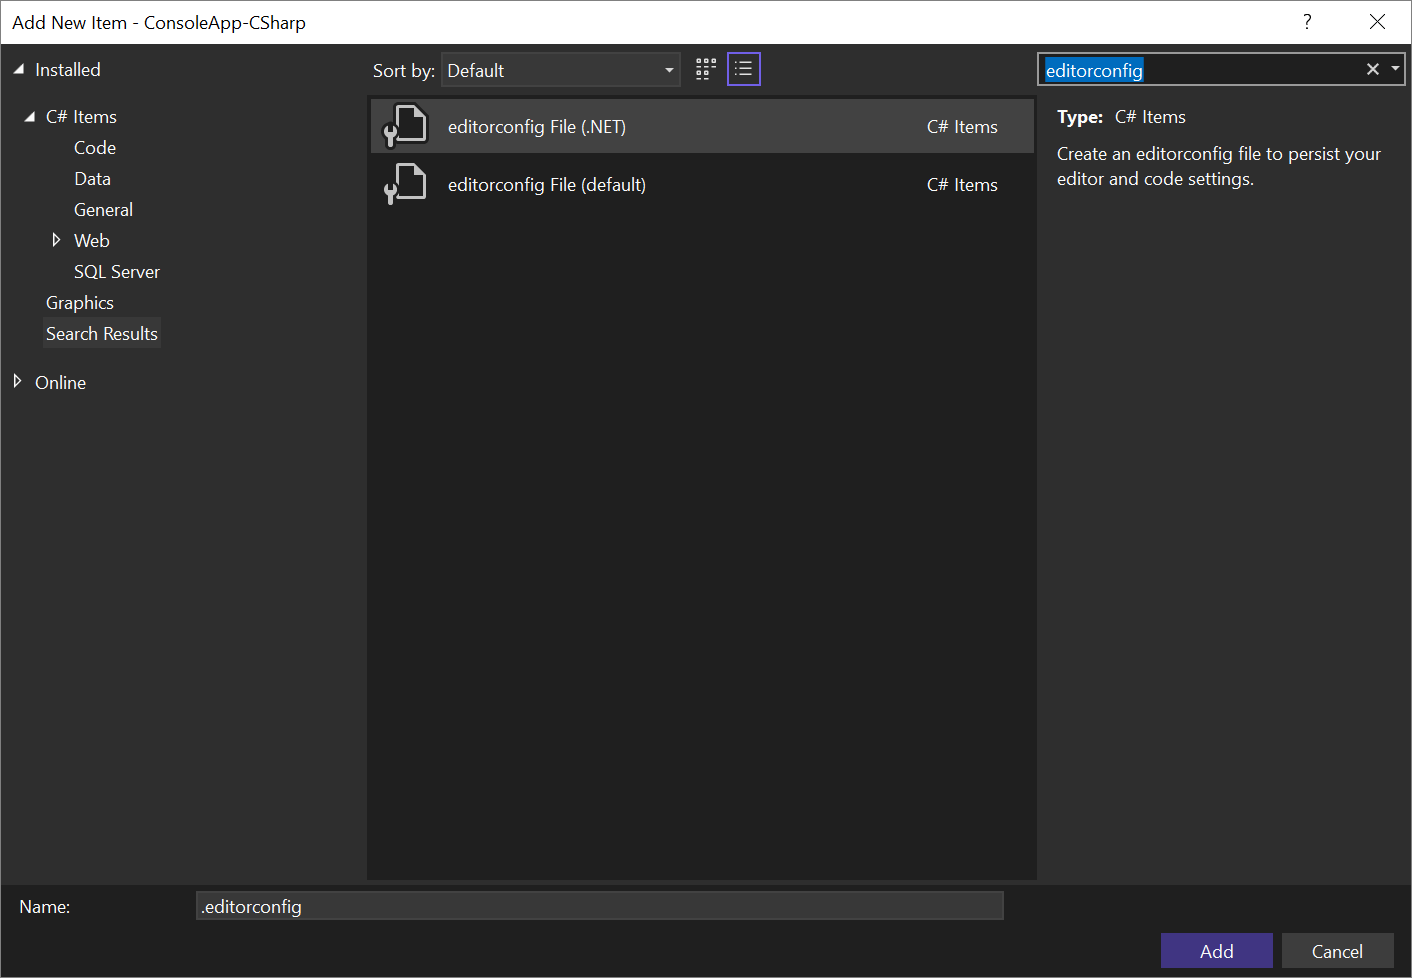
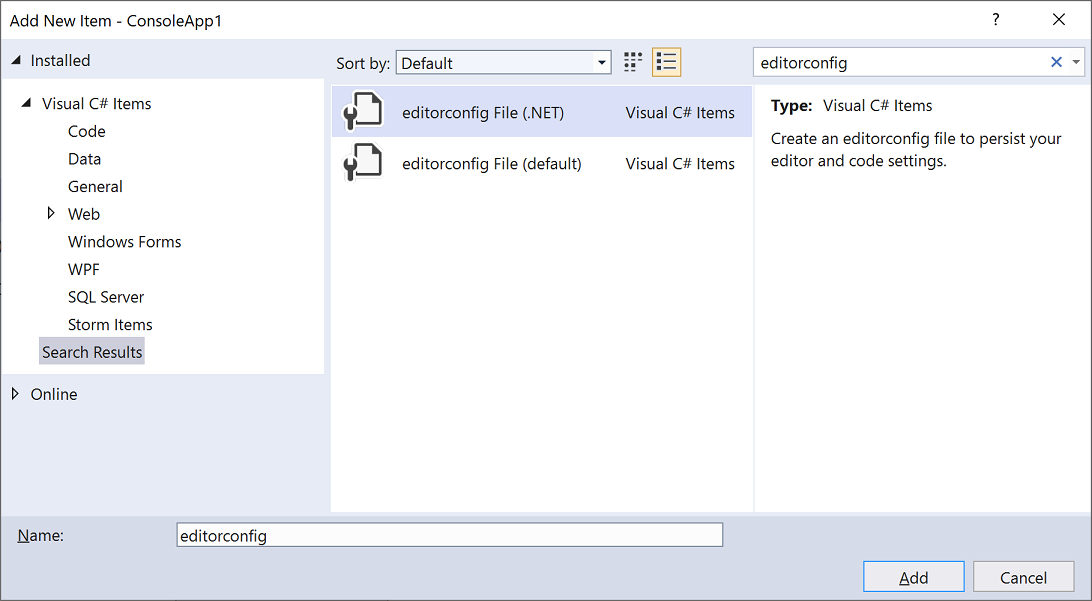
- Add a default or .NET-style EditorConfig file to your project by choosing Add > New Item from the Add context menu fly-out in Solution Explorer. Then, in the Add New Item dialog box, search for "editorconfig". Select either of the editorconfig File item templates and then choose Add.
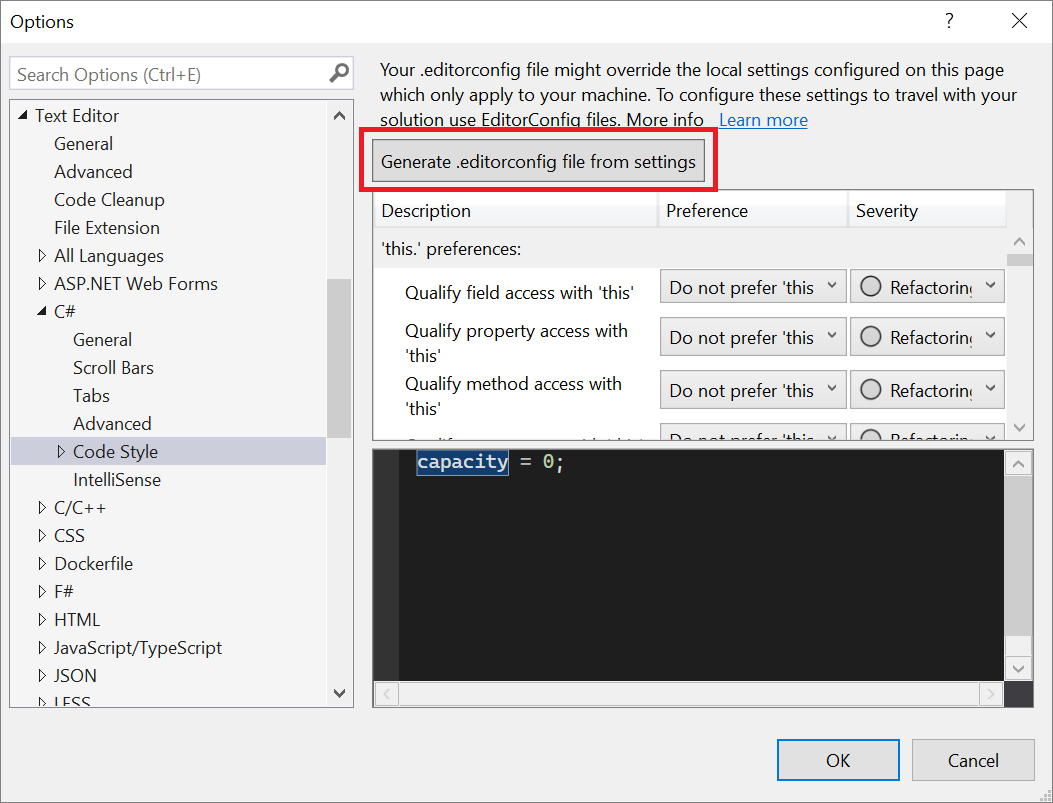
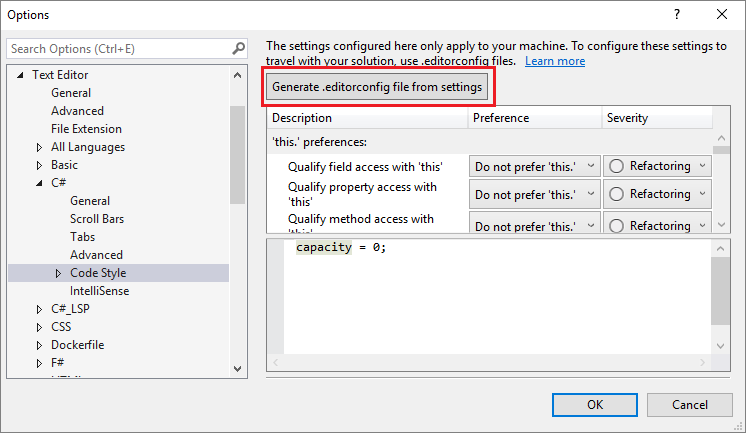
- Automatically create an .editorconfig file based on your code style settings in Tools > Options > Text Editor > C# > Code Style.
The code inference feature of IntelliCode for Visual Studio infers your code styles from existing code. It then creates a nonempty EditorConfig file with your code-style preferences already defined.
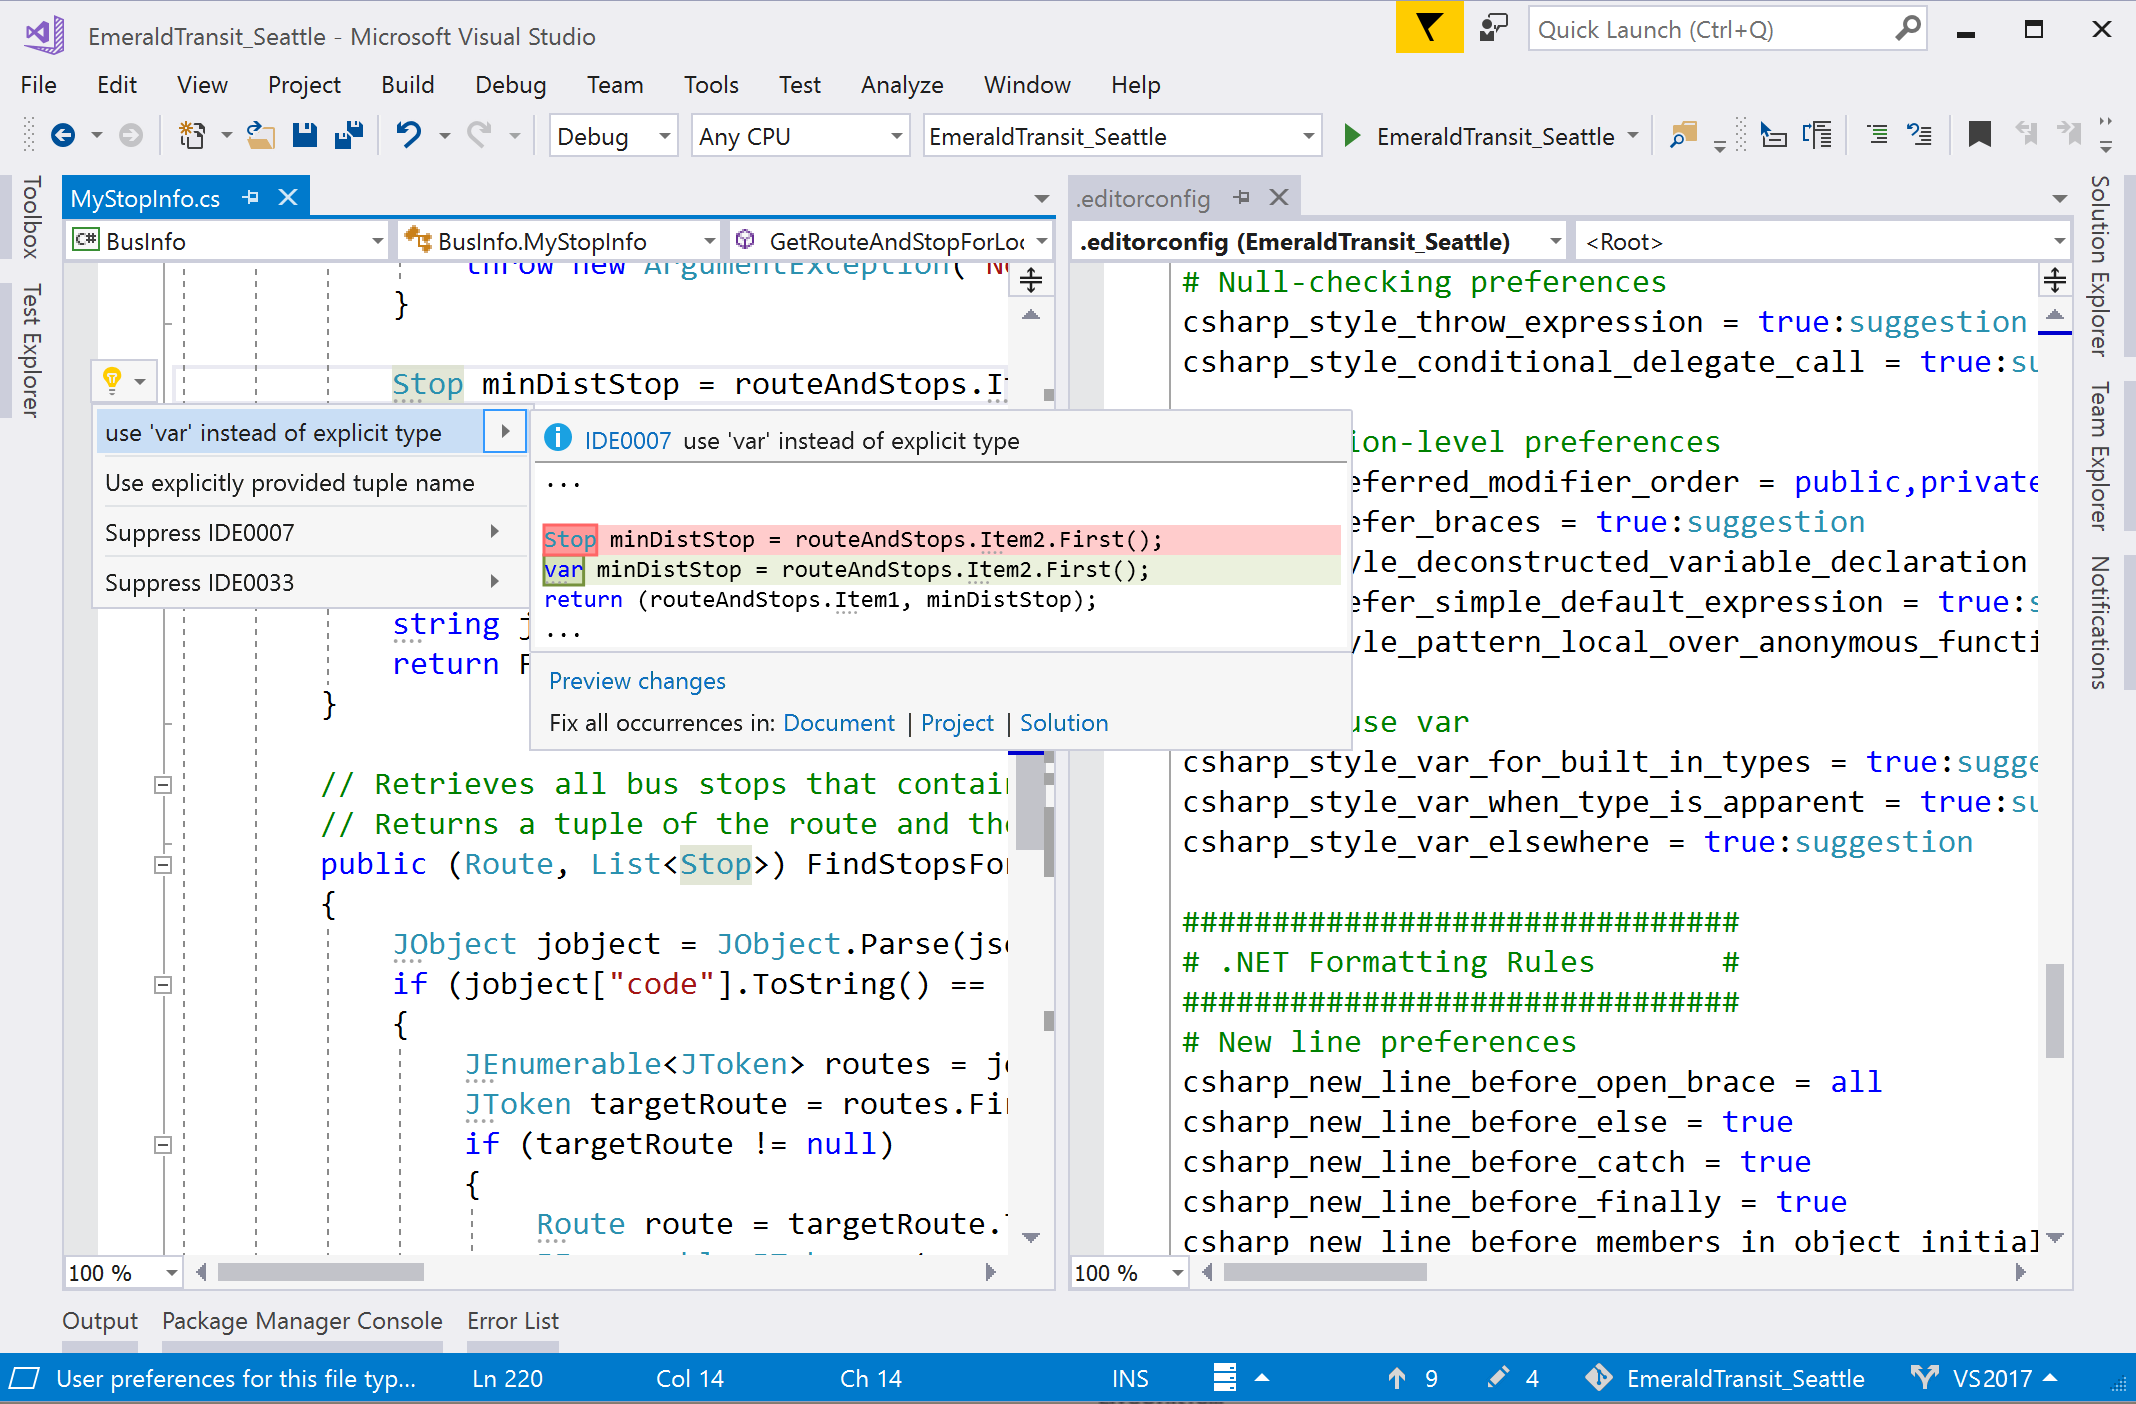
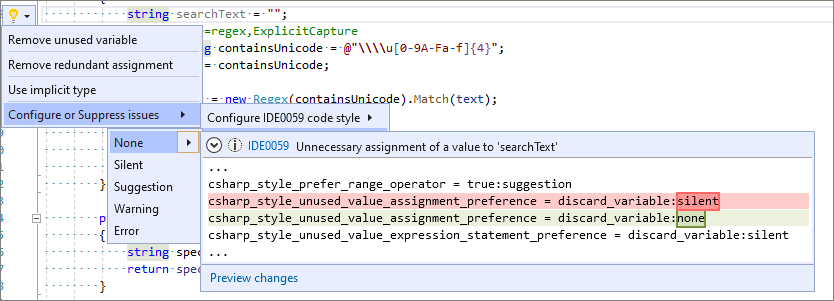
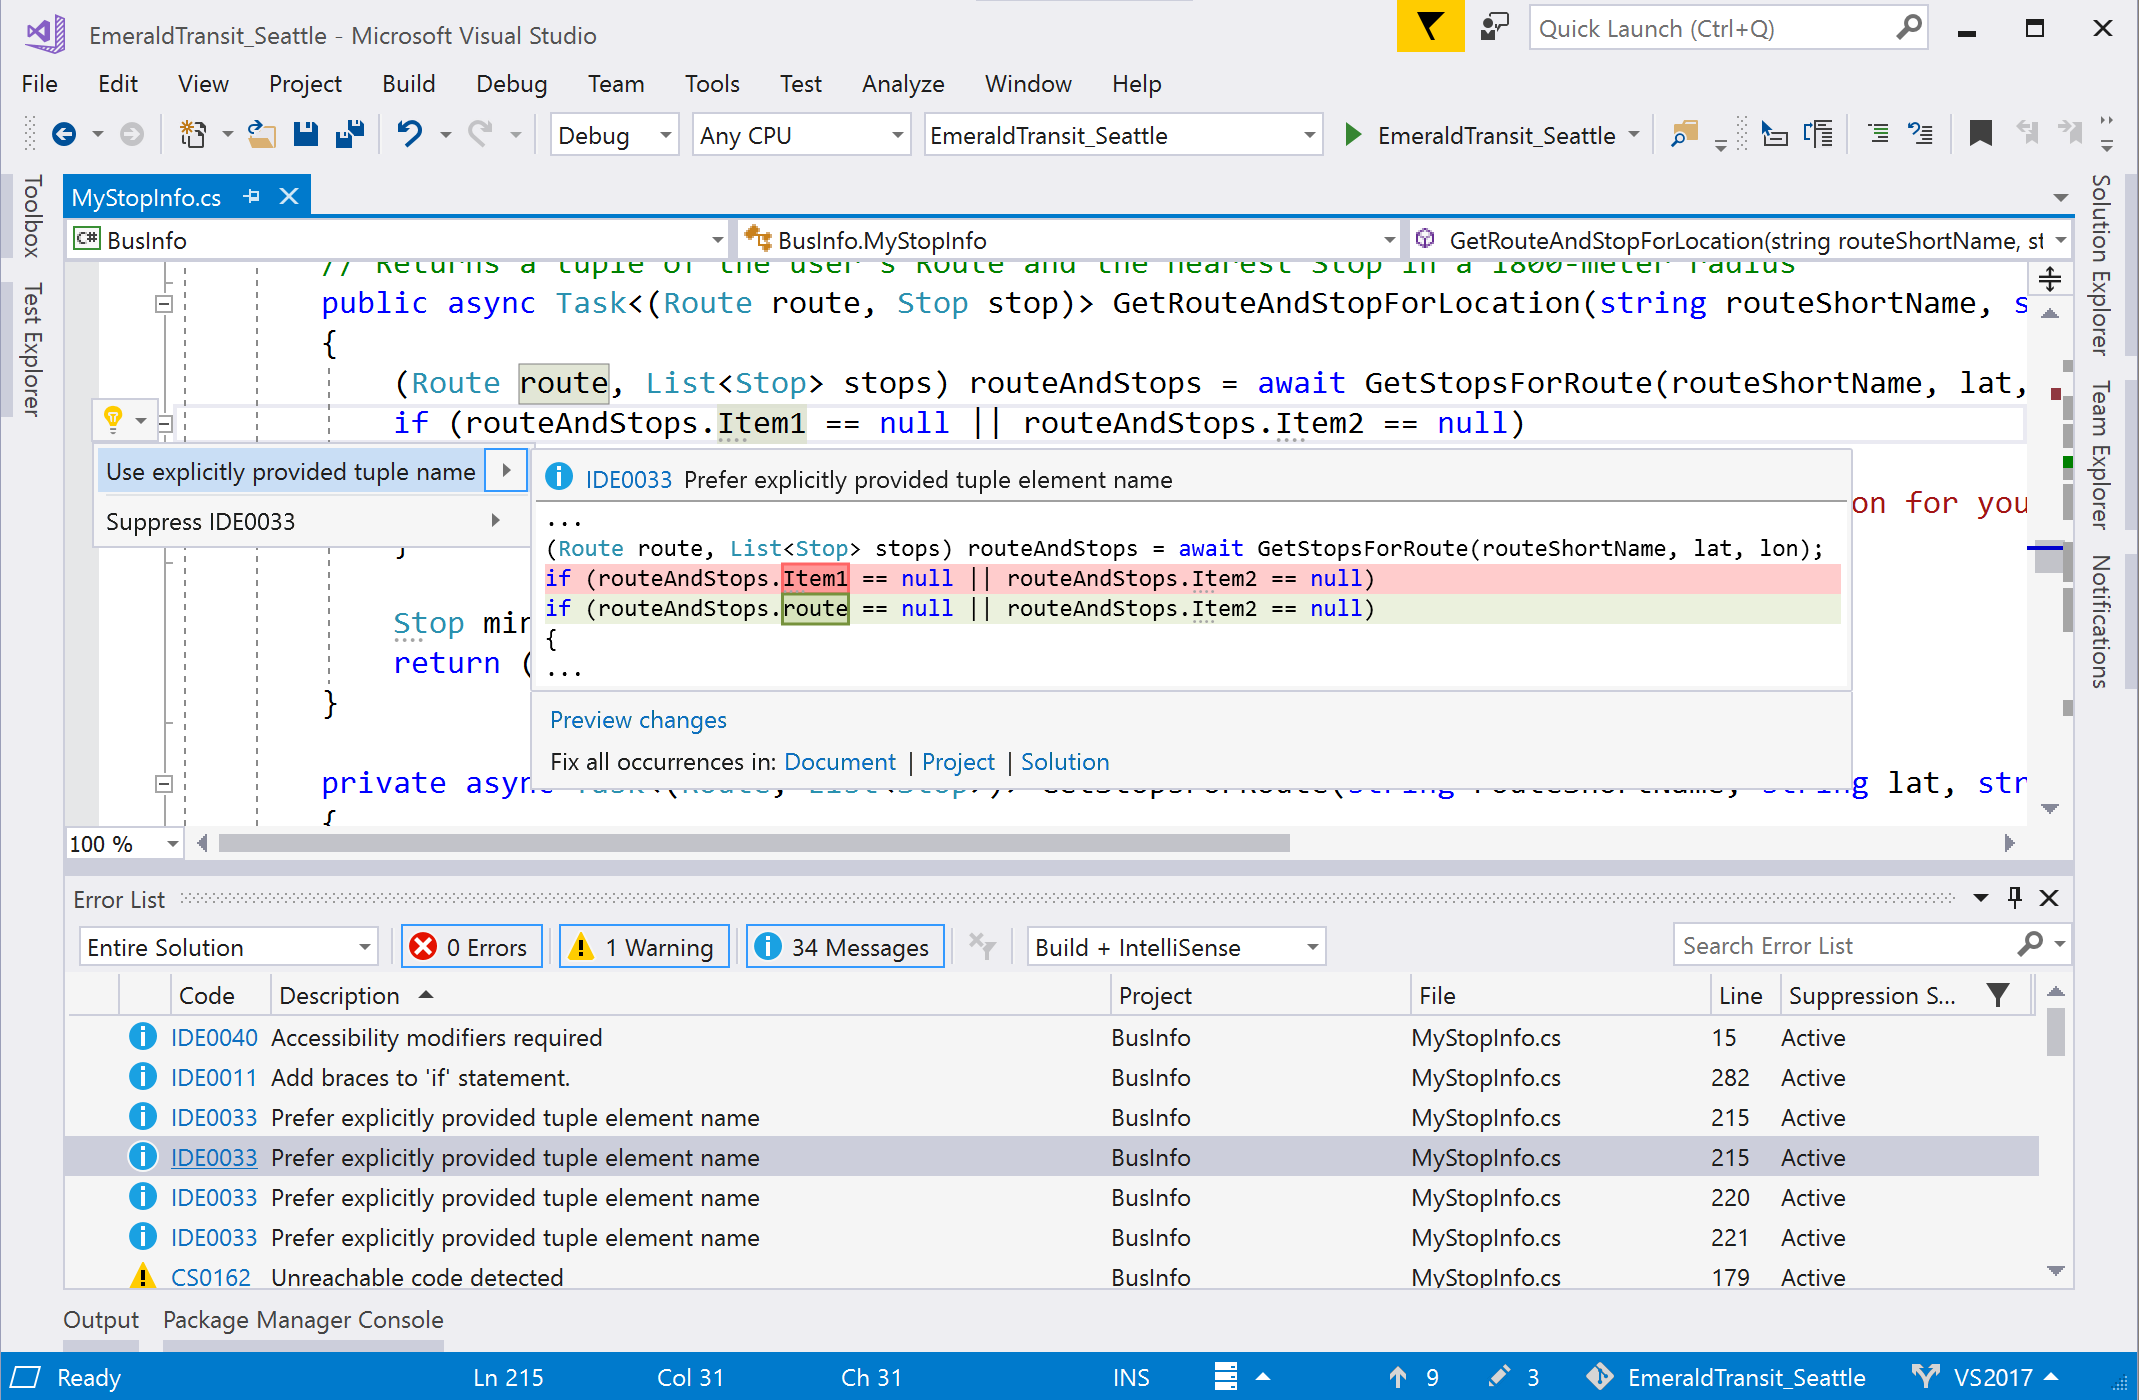
Configure the severity level of a code style rule directly through the editor. If you don't have an .editorconfig file, Visual Studio generates one for you. Place your cursor on the error, warning, or suggestion and type Ctrl+. to open the Quick Actions and Refactorings menu. Select Configure or Suppress issues. Then select the rule and choose the severity level you would like to configure for that rule. This action updates your existing EditorConfig with the rule’s new severity.

Check out the .NET code-style rule options documentation, which also includes an example of a complete EditorConfig file.
Code Cleanup
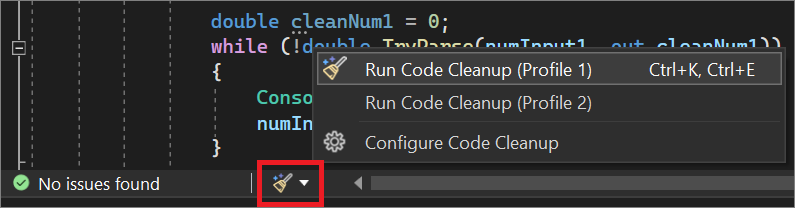
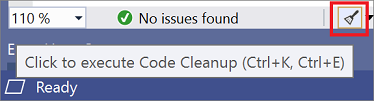
Visual Studio provides on-demand formatting of your code file, including code style preferences, through the Code Cleanup feature. To run Code Cleanup, select the broom icon at the bottom of the editor or press Ctrl+K, Ctrl+E.
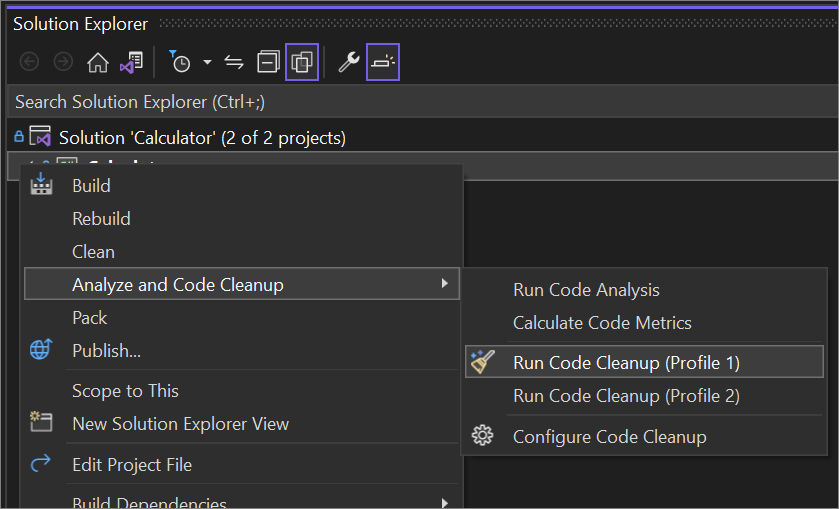
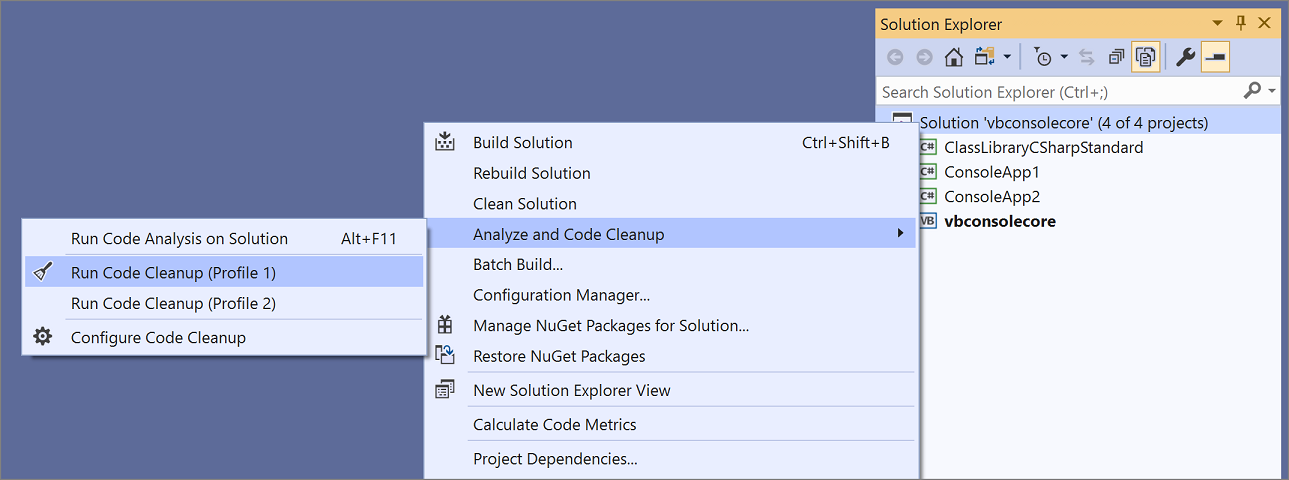
You can also run code cleanup across your entire project or solution. Right-click the project or solution name in Solution Explorer, select Analyze and Code Cleanup, and then select Run Code Cleanup.
In addition to formatting your file for spaces, indents, et cetera, Code Cleanup also applies selected code styles. Your preferences for each code style are read from the EditorConfig file, if you have one for the project, or from the code style settings in the Options dialog box.
Refactorings and code fixes
Visual Studio comes with numerous refactorings, code generation actions, and code fixes. Red squiggles represent errors, green squiggles represent warnings, and three gray dots represent code suggestions. You can access code fixes by selecting the light bulb or screwdriver icon, or by pressing Ctrl+. or Alt+Enter. Each fix comes with a preview window that shows a live code diff of how the fix works.
Popular quick fixes and refactorings include:
- Rename
- Extract Method
- Change Method Signature
- Generate Constructor
- Generate Method
- Move Type to File
- Add Null-Check
- Add Parameter
- Remove Unnecessary Usings
- Foreach Loop to LINQ Query or to LINQ method
- Pull Members Up
For more information, see code generation features.
You can install .NET analyzers to flag code issues. Or, write your own refactoring or code fix with Roslyn analyzers.
Several community members have written free extensions that add more code inspections:
Find Usages, Go To Implementation, and Navigate To Decompiled Assemblies
Visual Studio has many features to help you search and navigate your code.
| Feature | Shortcut | Details/Improvements |
|---|---|---|
| Find All References | Shift+F12 | Results are colorized and can be grouped by project, definition, and reference type, such as read or write. You can also "lock" results. |
| Go To Implementation | Ctrl+F12 | You can use Go To Definition on the override keyword to navigate to the overridden member |
| Go To Definition | F12 or Ctrl+Click | Press Ctrl while clicking to navigate to definition |
| Peek Definition | Alt+F12 | Inline view of a definition |
| Structure Visualizer | Gray, dotted-lines between braces | Hover to see your code structure |
| Navigation to decompiled assemblies | F12 or Ctrl+Click | Navigate to external source (decompiled with ILSpy) by enabling the feature: Tools > Options > Text Editor > C# > Advanced > Enable navigation to decompiled sources. |
Improved IntelliSense
Use IntelliCode for Visual Studio to get context-aware code completions instead of just an alphabetical list.
Unit testing
We've made numerous improvements to the testing experience. You can test with the MSTest (MSTest v1 or MSTest v2), NUnit, and XUnit test frameworks.
Test Explorer test discovery is fast.
Organize your tests in Test Explorer with hierarchical sorting.
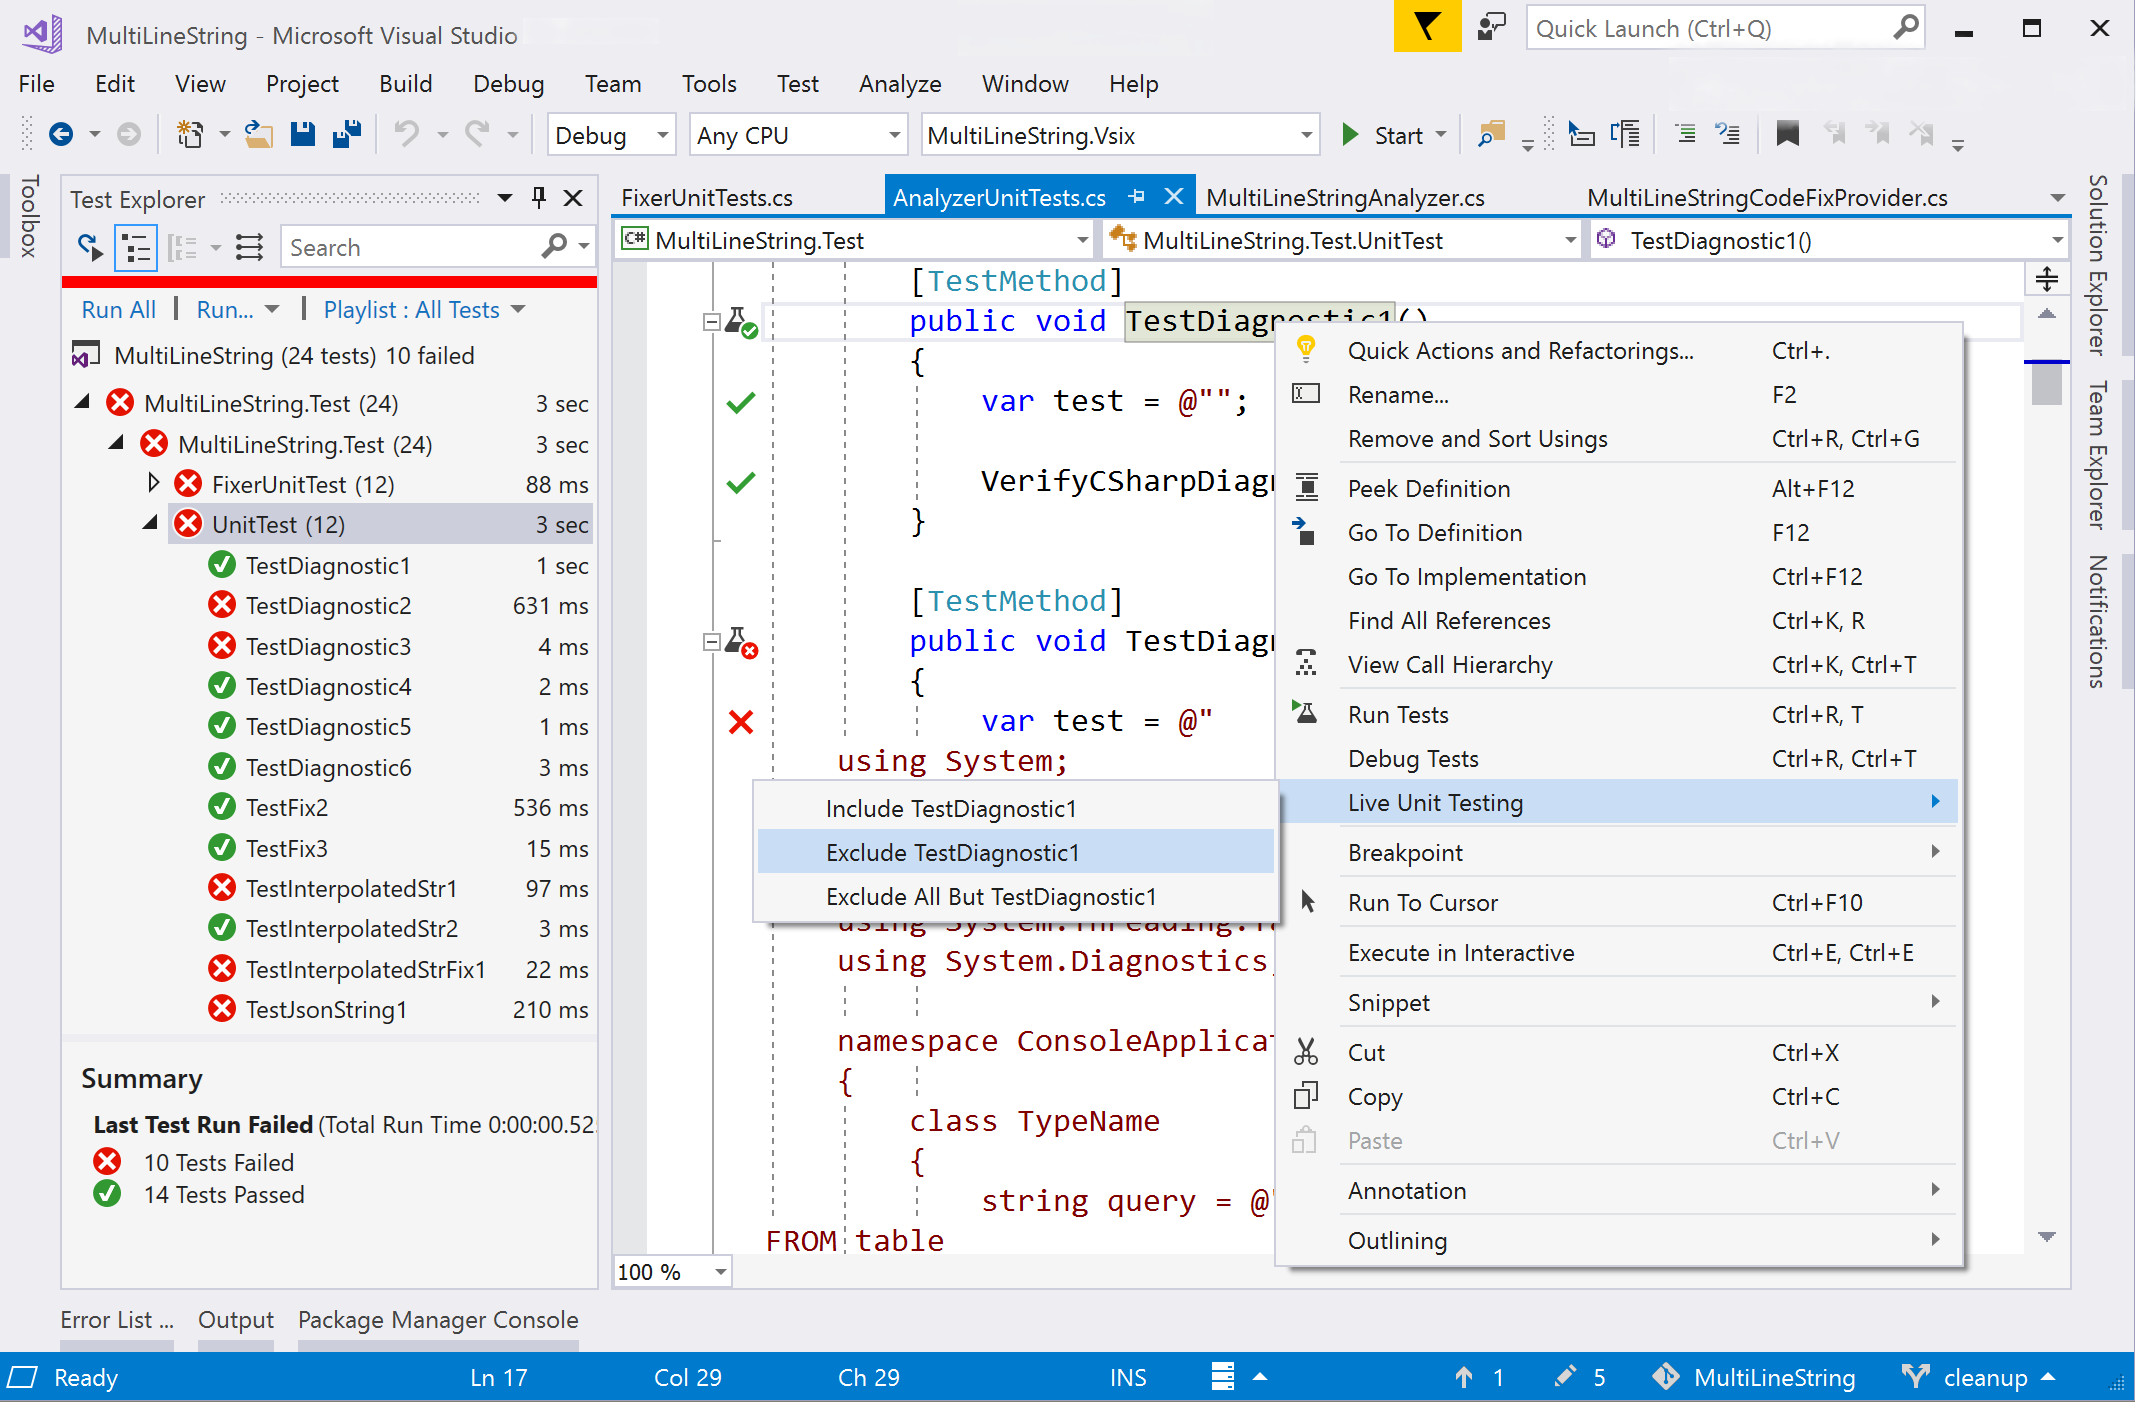
- Live unit testing continuously runs tests impacted by your code changes and updates inline editor icons to let you know the status of your tests. Include or exclude specific tests or test projects from your live test set. (Visual Studio Enterprise edition only.)
For more information, see Unit test basics.
Debugging
Visual Studio includes the following debugging capabilities:
- The ability to search for a string within the Watch, Autos, and Locals windows.
- Run to click, which lets you hover next to a line of code, hit the green 'play' icon that appears, and run your program until it reaches that line.
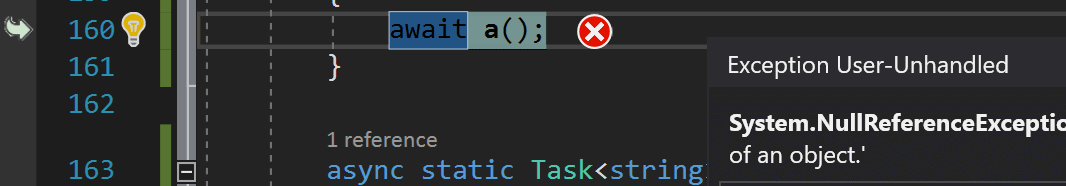
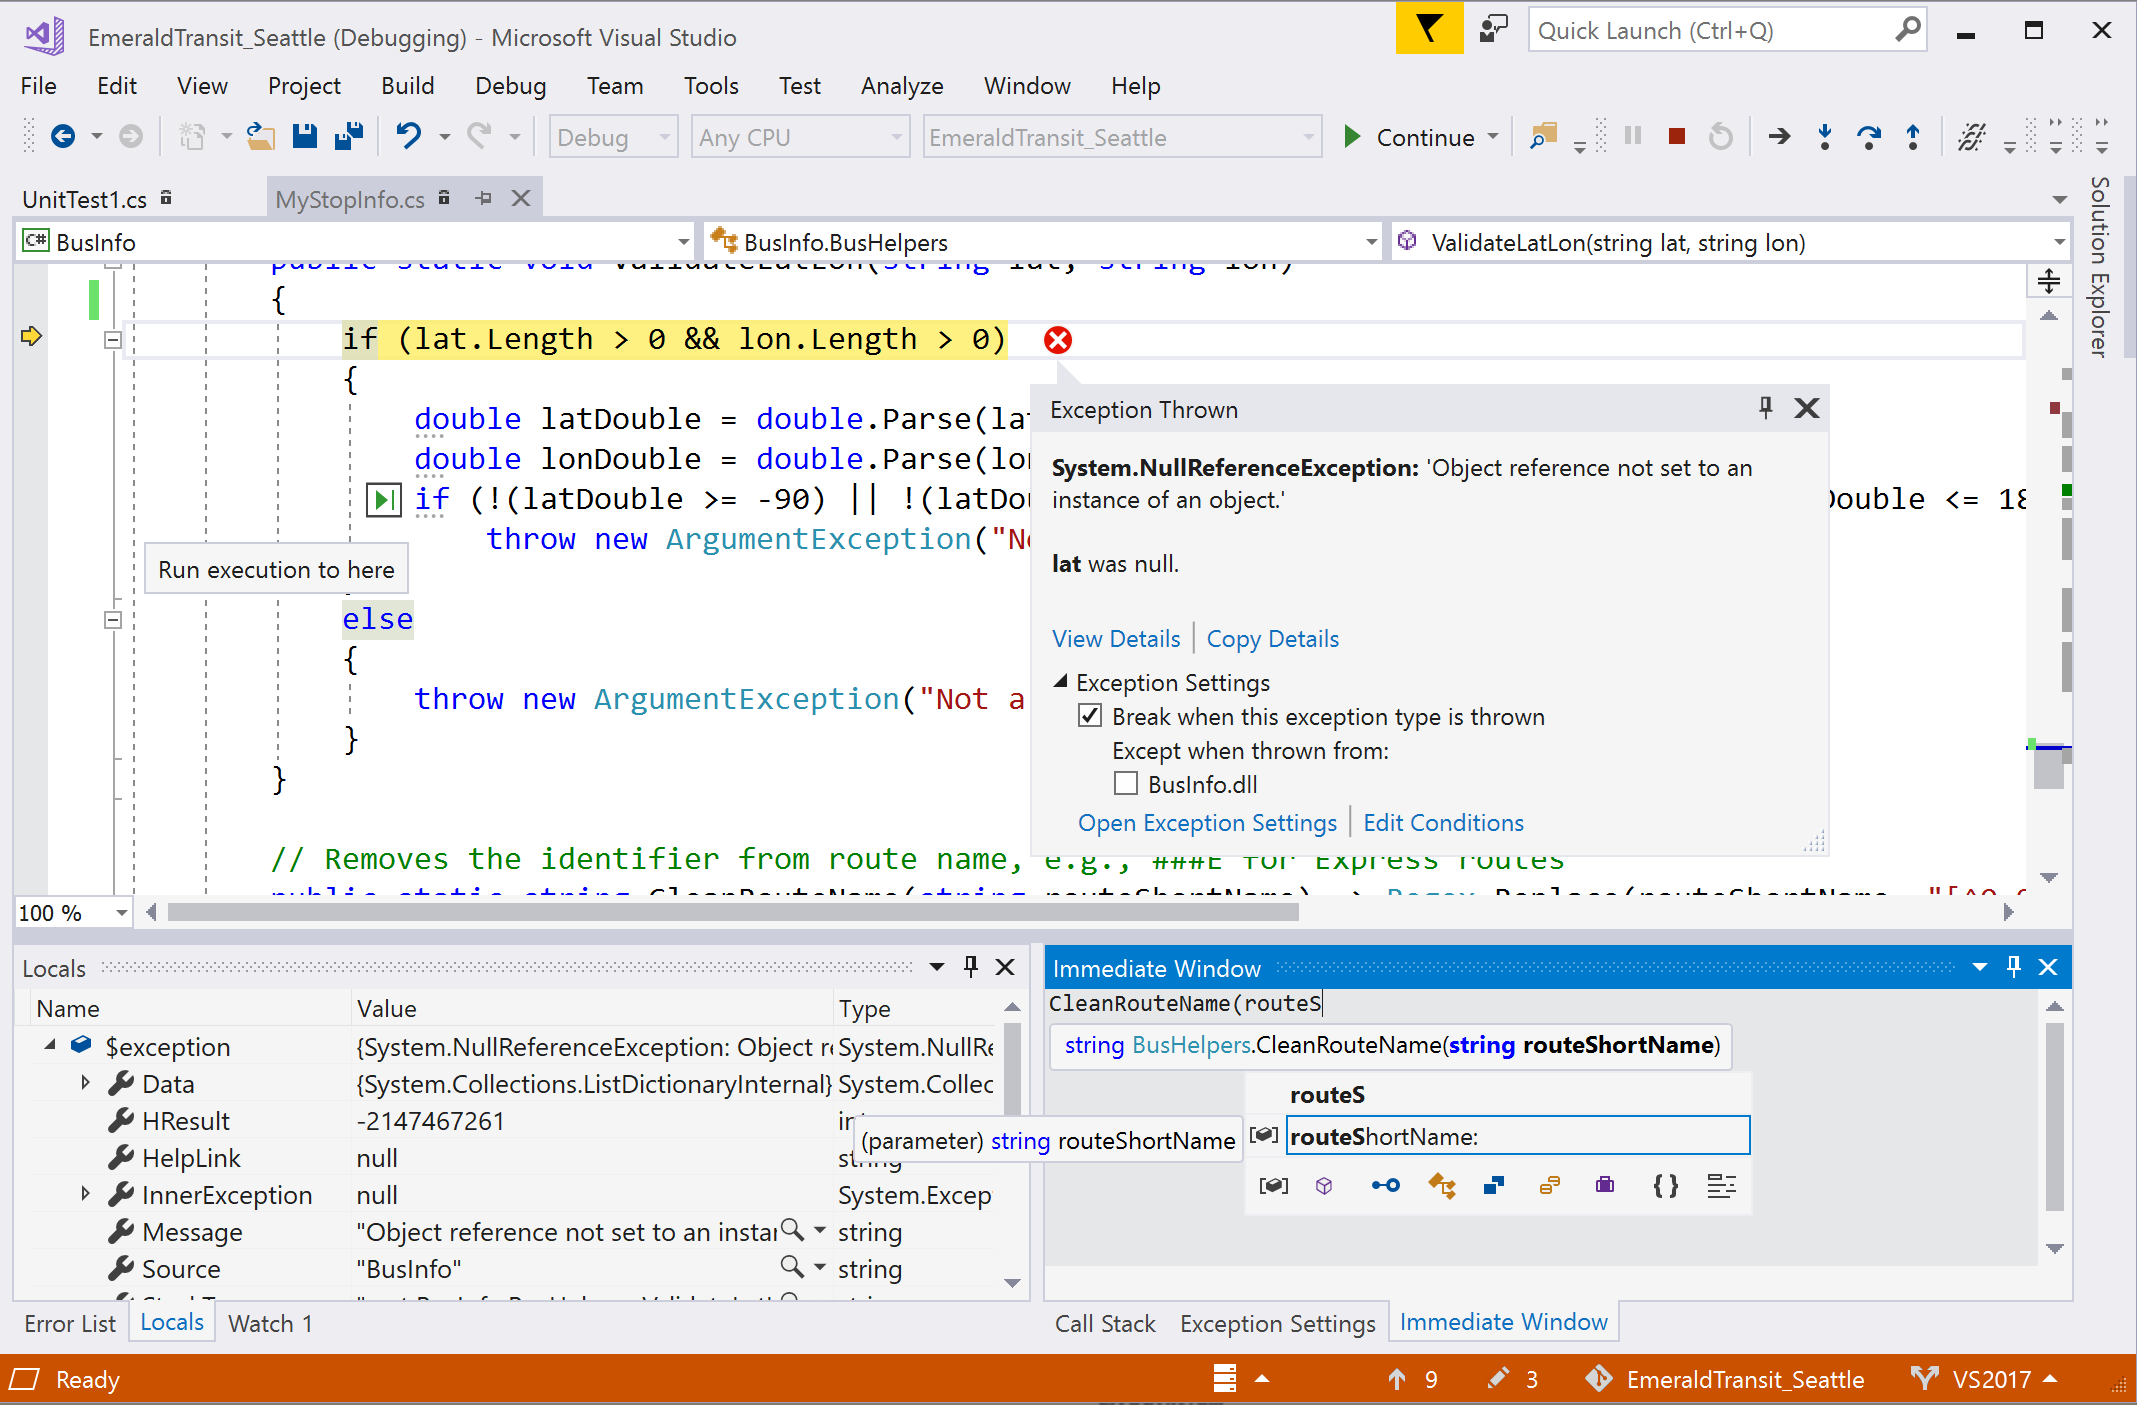
- The Exception Helper, which puts the most important information at the top level in the dialog, for example, which variable is
nullin aNullReferenceException. - Step back debugging, which lets you go back to previous breakpoints or steps and view the state of the application as it was in the past.
- Snapshot debugging, which lets you investigate the state of a live web application at the moment an exception was thrown (must be on Azure).
Version control
In Visual Studio 2022, you can use Git directly from the IDE to create, review, check out, and run pull requests. To learn more, see How Visual Studio makes version control easy with Git.
You can use Git or TFVC to store and update your code in Visual Studio.
In Visual Studio 2019 version 16.8 and later, you can use Git from directly within the IDE to create, review, check out, and run pull requests.
In Visual Studio 2019 version 16.7 and earlier, install the Pull requests for Visual Studio extension to create, review, check out, and run pull requests without leaving Visual Studio.
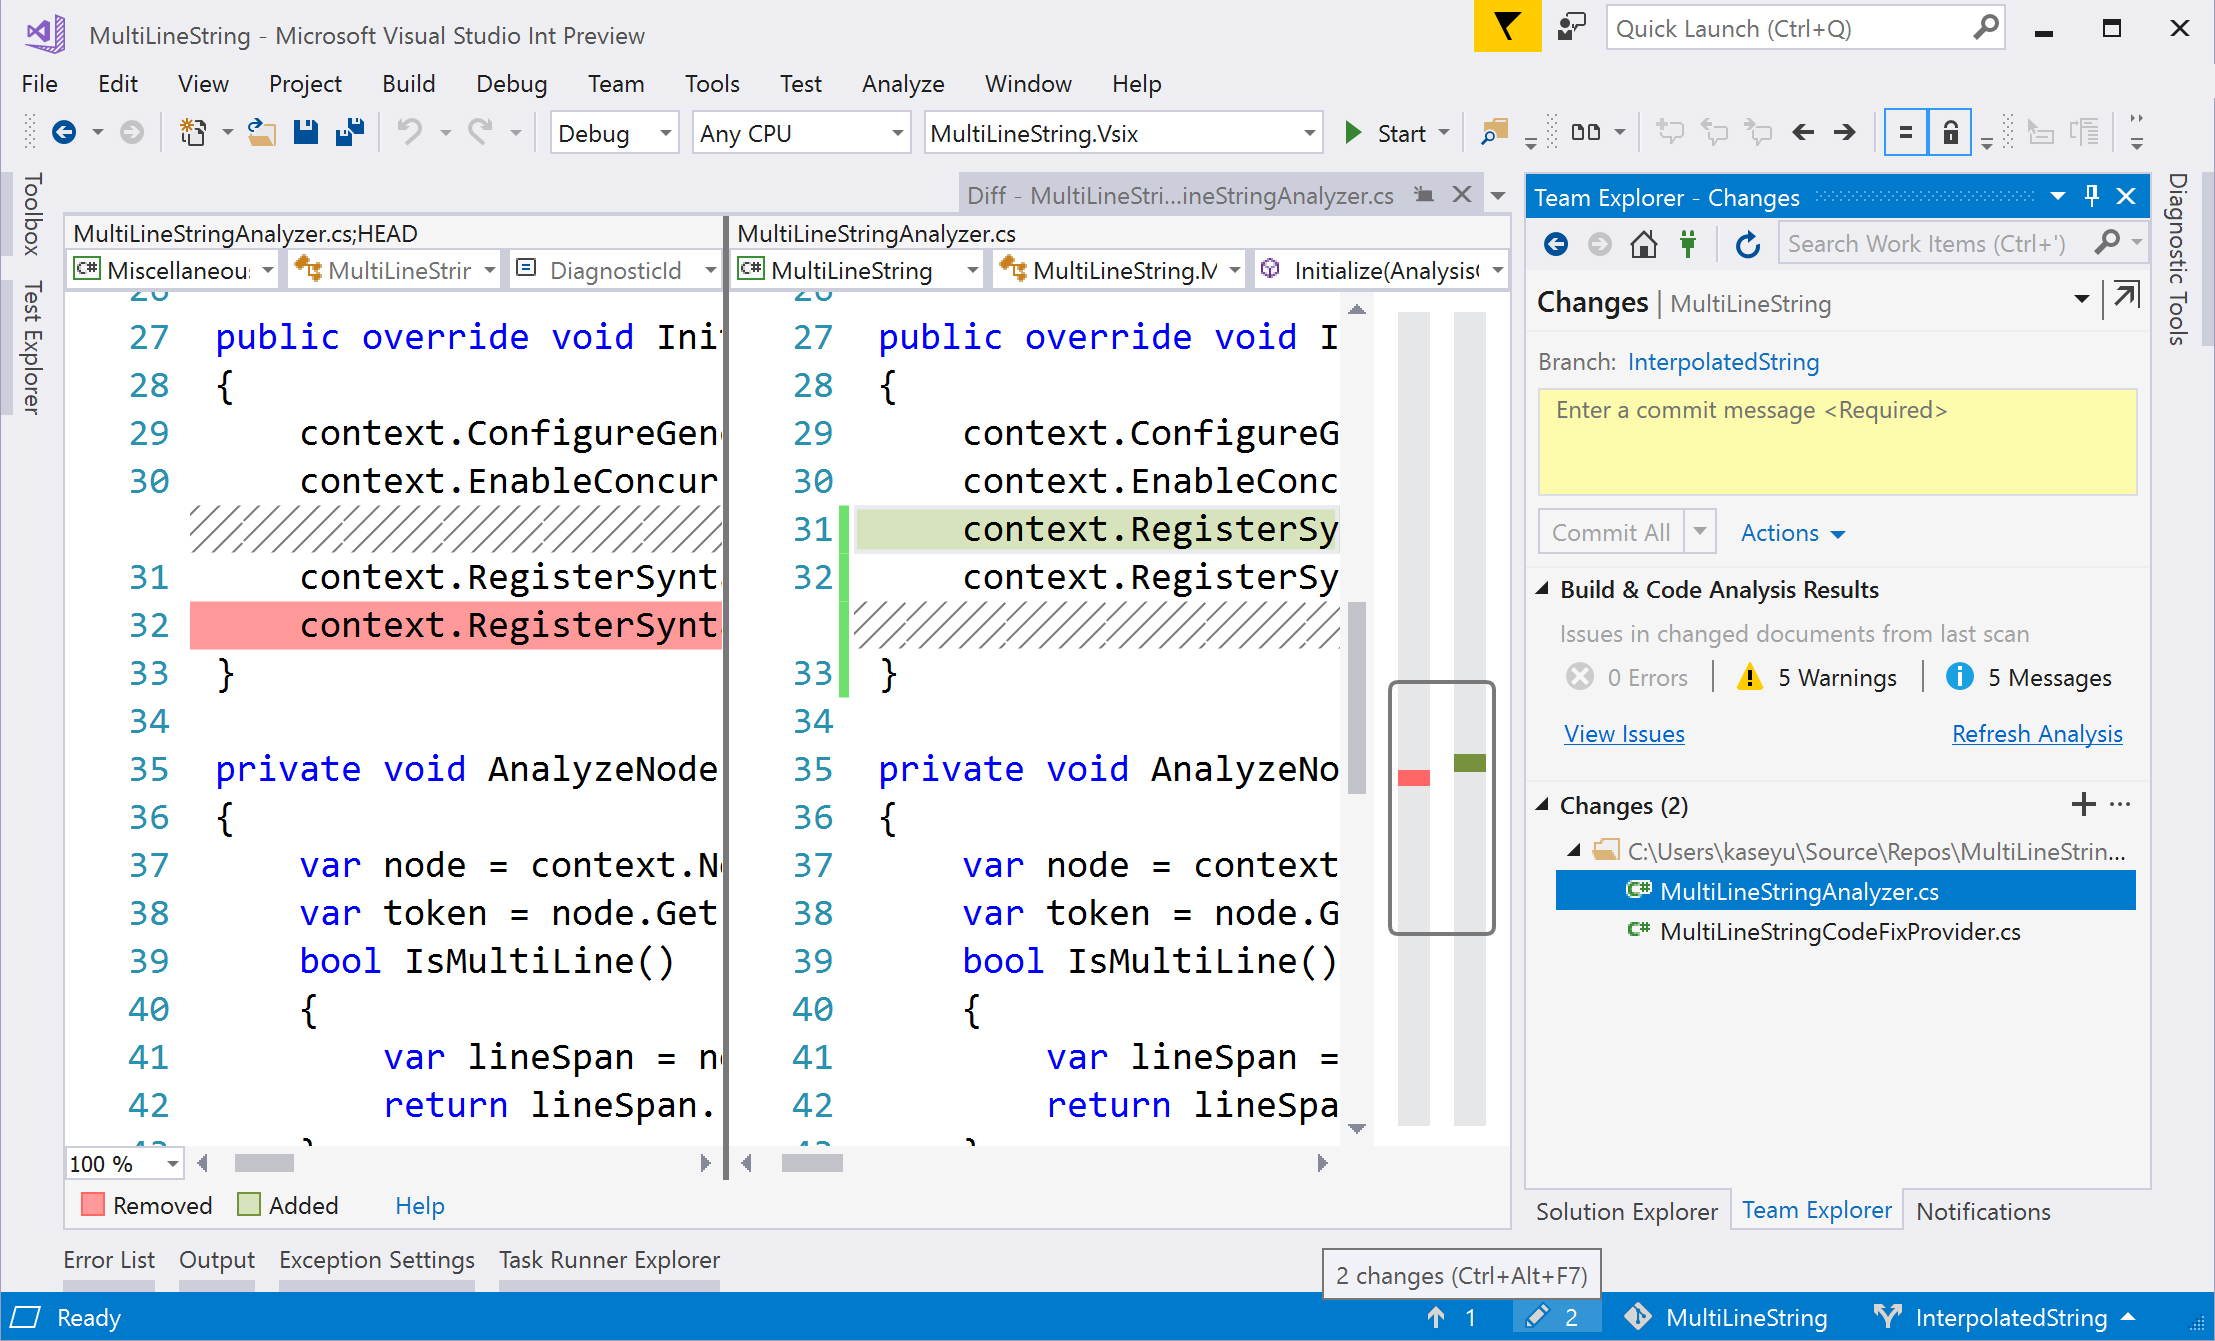
Organize your local changes in Team Explorer and use the status bar to track pending commits and changes.
Set up continuous integration and delivery for your ASP.NET projects inside of Visual Studio with the Continuous delivery tools for Visual Studio extension.
What other features should I know about?
Here's a list of editor and productivity features to make writing code more efficient. Some features might need to be enabled because they're off by default.
| Feature | Details | How to enable |
|---|---|---|
| Locate File in Solution Explorer | Highlights the active file in Solution Explorer | Tools > Options > Projects and Solutions > Track Active Item in Solution Explorer |
| Add usings for types in reference assemblies and NuGet packages | Shows an error light bulb with a code fix to install a NuGet package for an unreferenced type | Tools > Options > Text Editor > C# > Advanced > Suggest usings for types in reference assemblies and Suggest usings for types in NuGet packages |
| Enable full solution analysis | See all errors in your solution in the Error List | Tools > Options > Text Editor > C# > Advanced > Enable full solution analysis |
| Enable navigation to decompiled sources | Allow Go To Definition on types/members from external sources and use the ILSpy decompiler to show method bodies | Tools > Options > Text Editor > C# > Advanced > Enable navigation to decompiled sources |
| Completion/Suggestion Mode | Changes the completion behavior in IntelliSense. Developers with IntelliJ backgrounds tend to use a nondefault setting here. | Edit > IntelliSense > Toggle Completion Mode (or press Ctrl+Alt+Space in the editor) |
| CodeLens | Displays code reference information and change history in the editor. (Source control CodeLens indicators aren't available in Visual Studio Community edition.) | Tools > Options > Text Editor > All Languages > CodeLens |
| Code snippets | Help stub out common boilerplate code | Type a snippet name and press Tab twice. |
| Paste JSON or XML as classes | Copy any JSON or XML text fragment to the clipboard and paste it as strongly typed .NET classes into any C# code file. | Edit > Paste Special > Paste JSON As Classes (or Paste XML As Classes) |
| Copy and trim indentation | Copy code from Visual Studio to another program (Outlook, Teams, etc.), without having to manually fix indentation after you paste your code. Available in Visual Studio 2022 version 17.7 and later. |
Related content
Feedback
Coming soon: Throughout 2024 we will be phasing out GitHub Issues as the feedback mechanism for content and replacing it with a new feedback system. For more information see: https://aka.ms/ContentUserFeedback.
Submit and view feedback for