Diagnose high latency with CPU Insights
CPU insights is a sub-feature of the CPU Usage tool that shows common potential latency issues like concatenating strings inefficiently.
View top insights
The Top Insights section in the CPU Usage tool shows quick CPU details, insights, and suggestions in the description so that you can continue diagnosing the issue. The Learn more link shows you in-depth documentation that explains your issue. If you need more information, View source code shows more details. Once selected, you can see the call tree view, showing the process, functions, and which callers use the most CPU.

View top functions
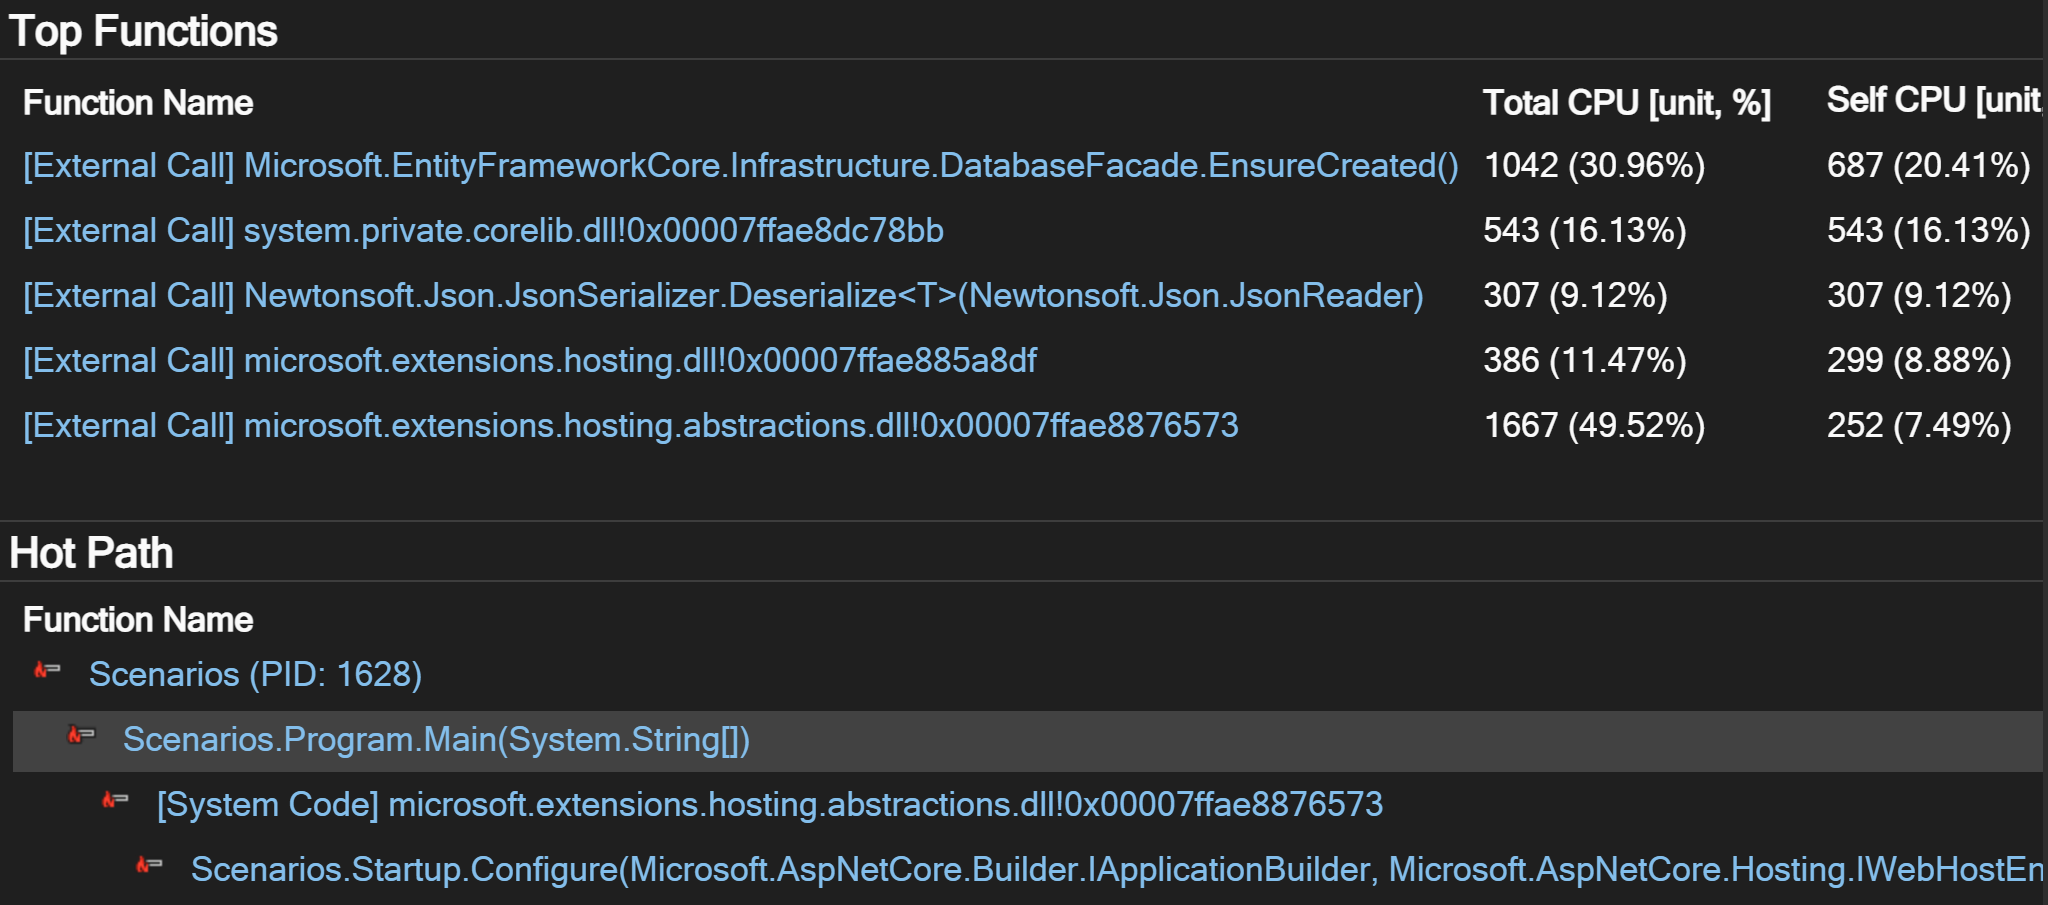
On the summary page under Top Functions, you can find the top functions called with the time spent in descending order. Total CPU time is the amount of time spent inside a function, including any functions it calls, whereas Self CPU is time spent exclusively in the function.
View the hot path
Hot Path shows where most of the CPU time was being spent in your application and helps focus investigation on the area that would have the most impact. Analyzing this code path by using other tools in the Performance Profiler can help identify ways to improve the code as well. For example, it may help identify how to minimize allocations on the hot path to reduce GC frequency and time spent in GC.

Get AI asistance
If you have Copilot, you can get AI assistance while you're looking at CPU insights. Just look for the Ask Copilot  button. In these scenarios, Copilot already knows the context for your questions, so you don't need to provide context yourself in chat. For more information, see Debug with Copilot.
Related content
Feedback
Coming soon: Throughout 2024 we will be phasing out GitHub Issues as the feedback mechanism for content and replacing it with a new feedback system. For more information see: https://aka.ms/ContentUserFeedback.
Submit and view feedback for