 Visual Studio 2022 release notes
We're excited to announce the availability of Visual Studio 2022 v17.12. This update focuses on providing fantastic developer experiences for working with .NET 9 projects and new AI productivity features, along with continuous improvements all-around.
Features
Feature list for 17.12 which was released on November 12, 2024.
Productivity
Copy from the Error List 📣
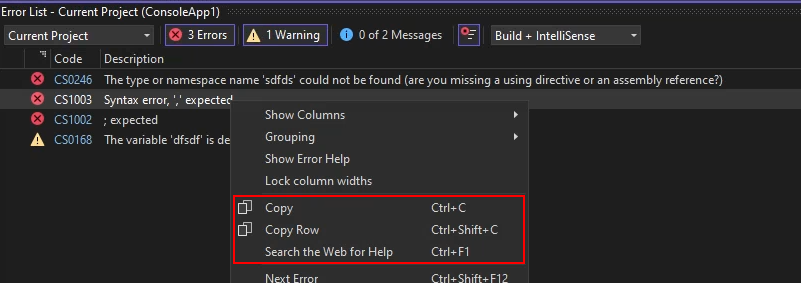
Copying an error from the Error List now copies just the description instead of the entire row to the clipboard.
You see an error in the Error List that you don't know how to fix. So, you select it and hit Ctrl+C to copy the description for a web search. After you've pasted it into the search engine, you realize it copied all column headers and row values instead of just the description. Now you must delete everything except the error description before you can perform the web search. This is cumbersome, but now we have a fix!
When you copy an error from the Error List using Ctrl+C, only the description is copied to the clipboard. This makes it easier to search for the error online or share it with others.
You can still copy the entire row by right-clicking the error and selecting Copy Row from the context menu or hitting Ctrl+Shift+C.
If what you wanted to do with the error description was to do a web search, then just hit Ctrl+F1 to search for information about the error online.
📣 See feature ticket to share your feedback and continue the conversation.
Go to line anywhere in Code Search 📣
In Code Search, you can now navigate to a specific line in the current document or other specified document.
Sometimes you know that there's an issue on a certain line in your code and you want to get to it quickly. Maybe you were told about an error being thrown on line 43 of some file, or you want to get to the bottom of a specific file.
Code Search now supports quick navigation to a specific line in your code.
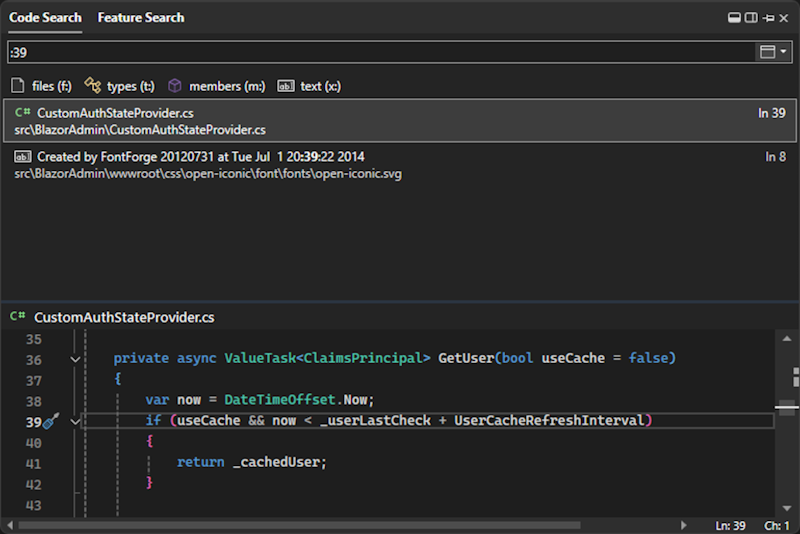
Open Code Search and go to a line in the current document by using colon + line number. For example,
:39will navigate to line 39 in the active file.
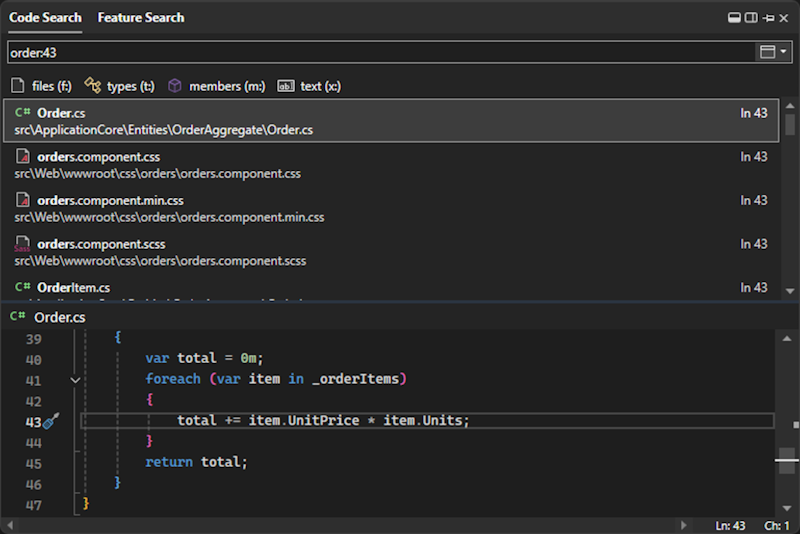
You can also go to a line in a different document by using file name + colon + line number. For example,
Order:43will navigate to line 43 in Order.cs. If you don't specify the exact file name, then the search will try to find the best match.
📣 See feature ticket to share your feedback and continue the conversation.
Dock the Code Search window 📣
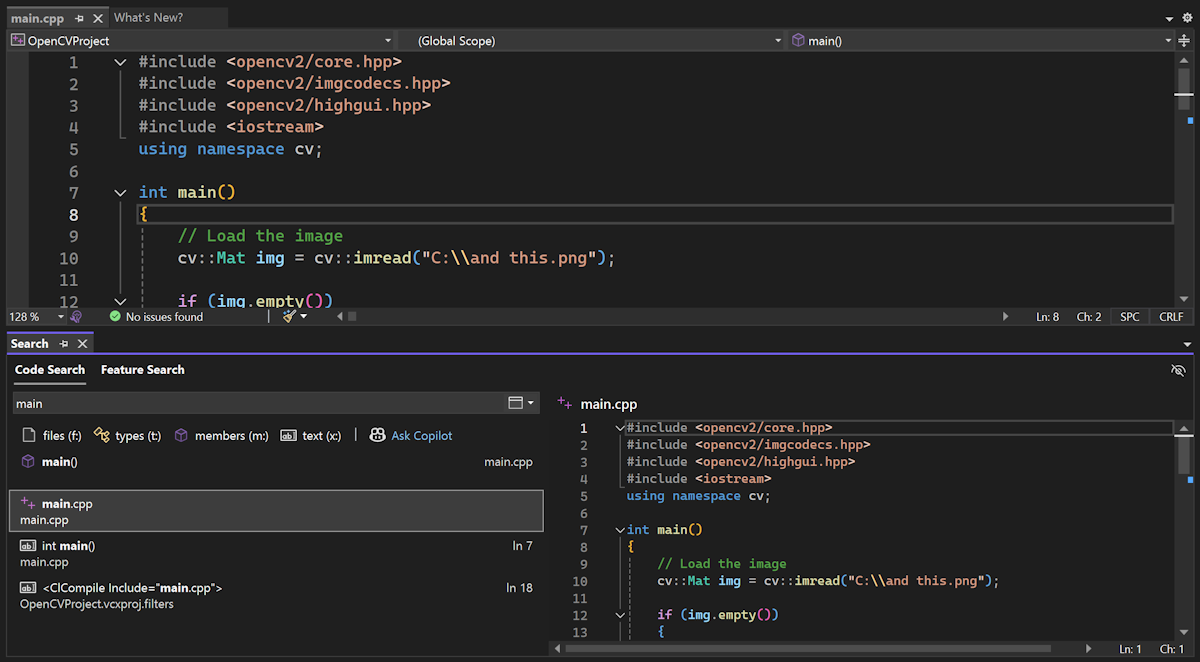
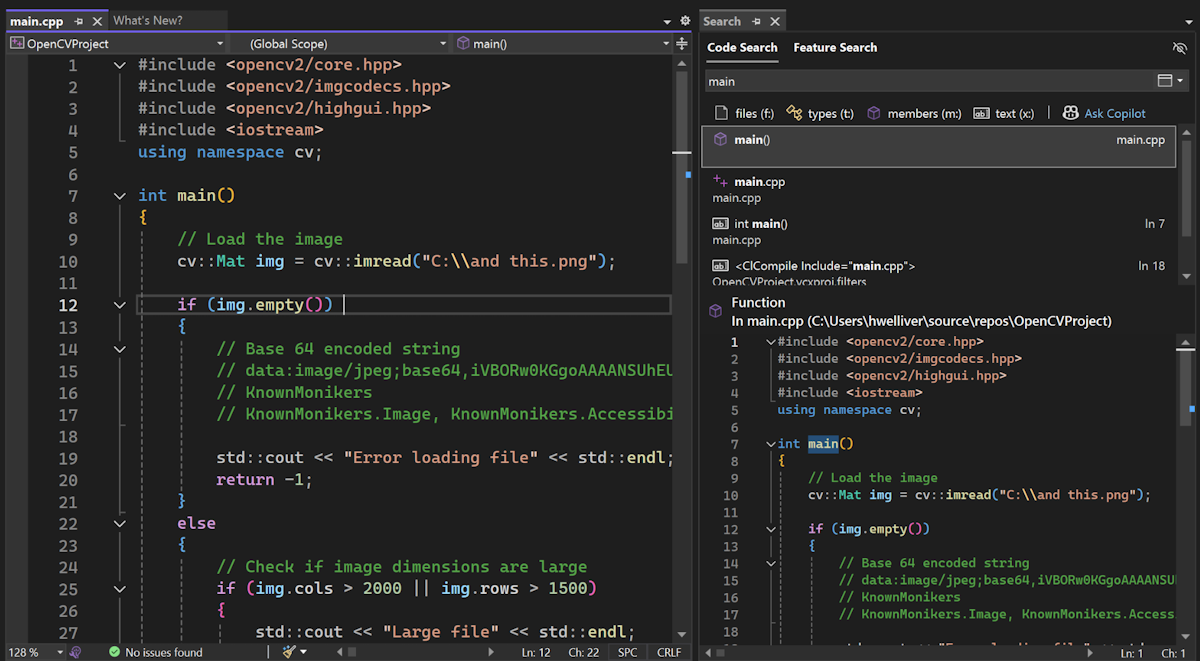
You can now freely position the Code Search window with capabilities like docking and auto-hiding.
If you need Code or Feature Search to stay out of your way, you now have more control over the behavior of the search window.
You can now dock the search window and perform tool window actions with it, like Solution Explorer and others.
After opening Code Search or Feature Search, click on the box icon at the top right to convert it into a tool window. You may choose to dock it elsewhere, pop it out, auto-hide, etc. You can revert to the dismissible popup window by clicking on the icon on the top right.
We've also simplified and cleaned up the previewing experience in search. There is now one button, indicated with an eye icon, to toggle the preview on and off.
The position of the preview panel will also adjust based on the dimensions of the search window.
📣 See feature ticket to share your feedback and continue the conversation.
Customize collapsed text indicator 📣
Set custom colors for the collapsed text indicator in the Visual Studio editor.
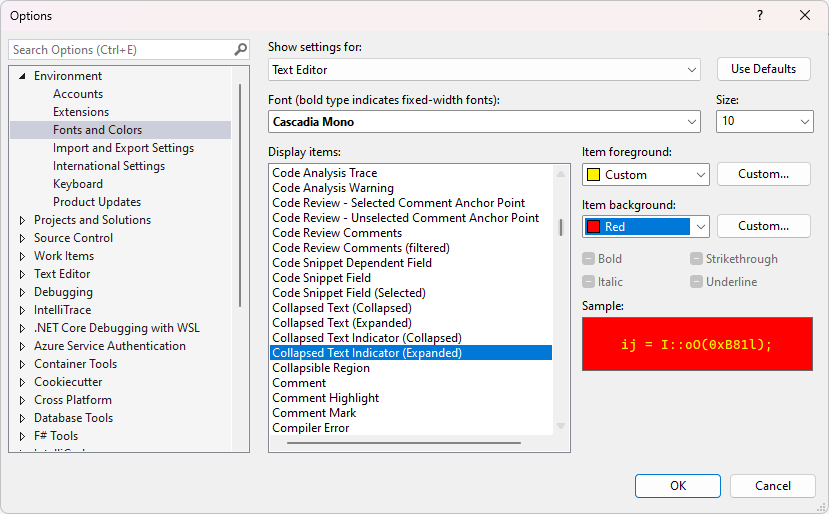
You can now customize your editor experience even further with new options for customizing the collapsed text indicator:
To try it out and set custom foreground and background colors for each, navigate to Tools > Options > Environment > Fonts and Colors.
There, you'll find two new items for customization:
- Collapsed Text Indicator (Collapsed)
- Collapsed Text Indicator (Expanded)
You can set the colors for the collapsed and expanded indicators independently from one another using predefined colors or custom colors of your choosing.
📣 See feature ticket to share your feedback and continue the conversation.
Refresh your Find results 📣
You can now refresh the results to a previous Find to get up-to-date search matches.
We heard from a lot of users that it's frustrating having to reopen the Find window and go through the motions of redoing a search to get updated results. Maybe you just refactored some code and want to confirm everything has been changed as expected, or you pulled some recent changes and need your recent Find operation to reflect those updates.
After completing Find in Files, you will now have the option to Refresh the Find results in the window. You'll get your updated results without having to redo the search.
We've also redesigned the former Repeat Find option to distinguish it from Refresh. It is now represented as Modify Find with a pencil icon. This button will still reopen Find in Files with the same search criteria you used for that results window.
📣 See feature ticket to share your feedback and continue the conversation.
More space for horizontal scrollbar 📣
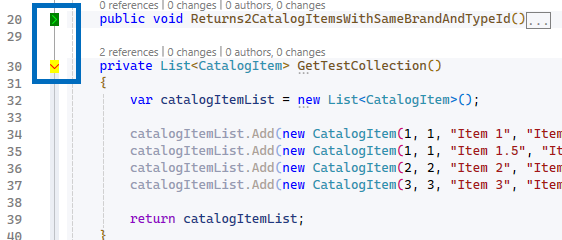
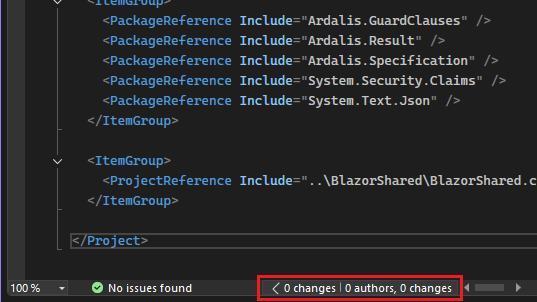
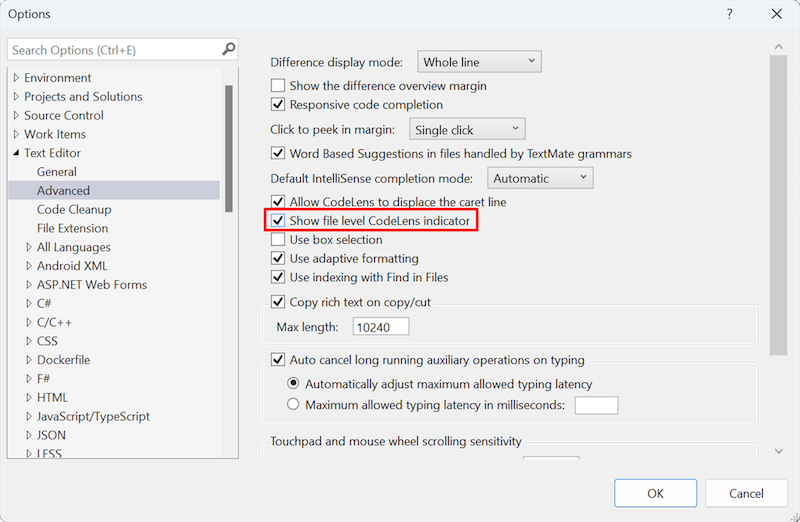
You can now control the visibility of the file level indicators in CodeLens.
The area with the horizontal scrollbar can get pretty cluttered up in Visual Studio. We're helping make it easier to clean it up by turning off the file level indicators in CodeLens by default.
If you do want the option on, you can find the Show file level CodeLens indicator option under Tools > Options > Text Editor > Advanced. This option affects visibility for file types that have the file level CodeLens control in the bottom editor margin such as XAML, HTML, and CSS, and does not affect files that contain inline CodeLens.
📣 See feature ticket to share your feedback and continue the conversation.
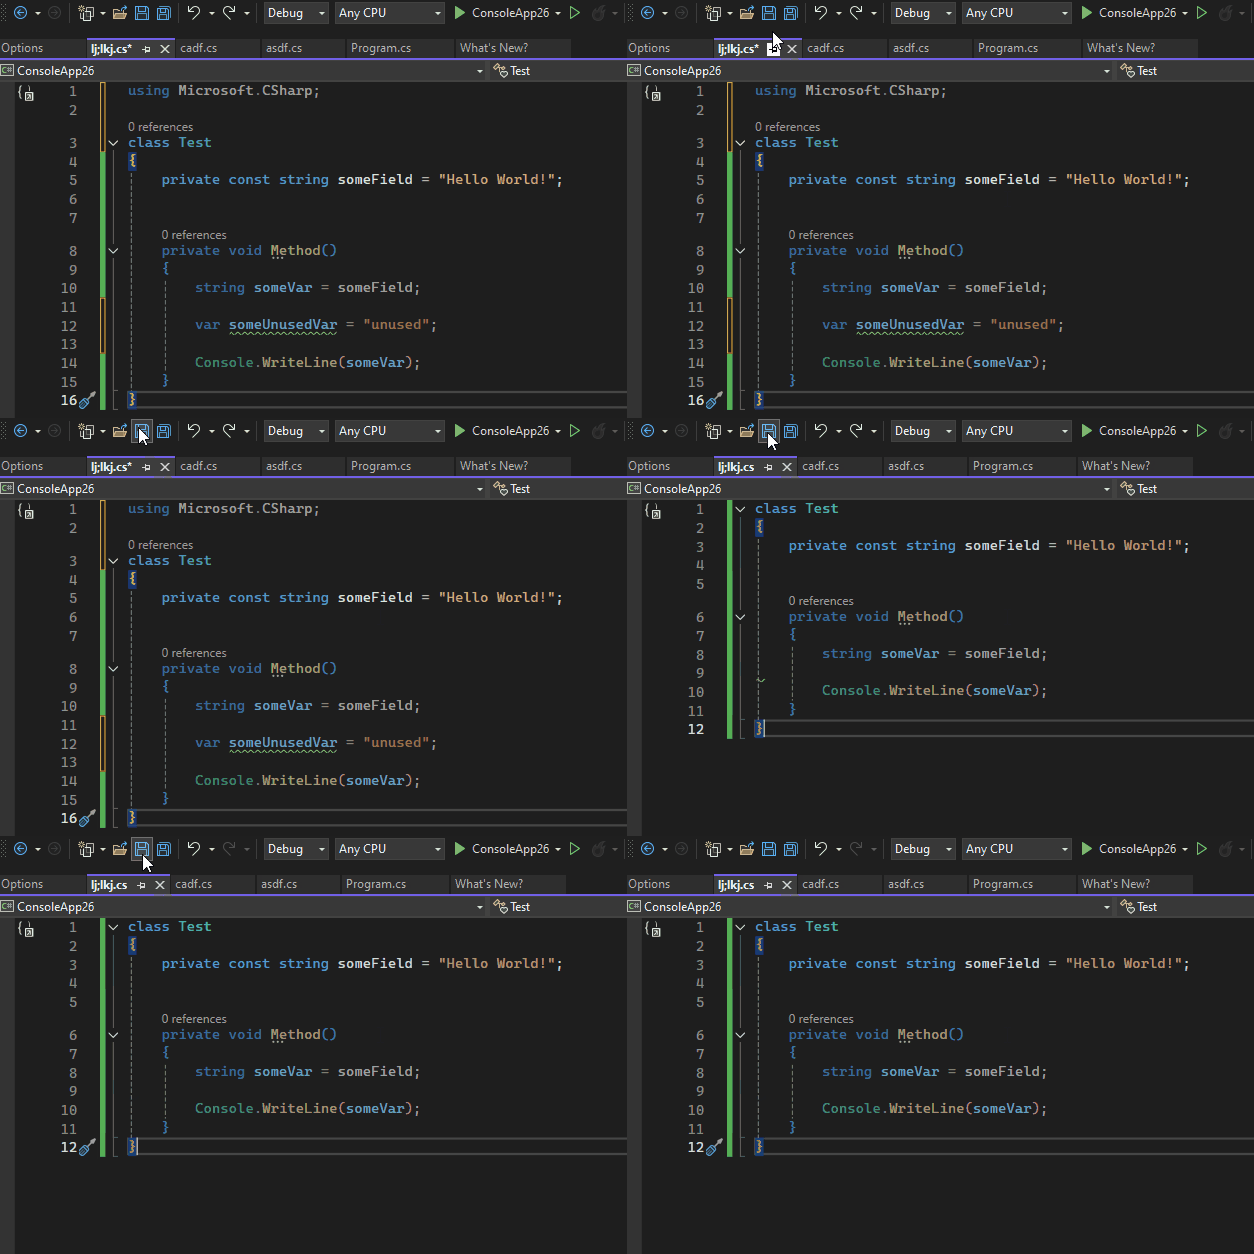
Non-blocking Code Cleanup on save
When Code Cleanup is run on Save, it now operates in a non-blocking manner, for a smoother coding experience.
Previously when a Code Cleanup is run on Save, you can't perform any actions in the IDE. We've now enhanced this to operate in a non-blocking manner.
The cleanup process will run in the background and can be automatically canceled if you resume typing, ensuring a smoother and more responsive coding experience.
Transitive dependencies in Solution-level Package Manager UI
When you look at the Installed tab in Visual Studio’s package manager UI on the Solution-level, it will now show both direct and transitive packages.
Previously on the Installed tab in Visual Studio’s package manager UI you could see both direct and transitive dependencies only for your projects. With this release we have added the ability to see transitive dependencies for the Solution-level as well.

Transitive dependencies with vulnerabilities in Solution Explorer
When setting
NuGetAuditModetoall, Solution Explorer will show indicators for transitive dependencies with vulnerabilities.NuGet Audit, first added in Visual Studio 17.8 (and .NET 8), provides warnings during restore if any packages used by your project have known vulnerabilities.
For more information on NuGet Audit, including all configuration options, see the documentation on NuGet Audit.
Those vulnerabilities can be in your direct dependencies as well as in the transitive dependencies (packages your dependencies depend on). Now if you set
NuGetAuditModetoall, Solution Explorer will show indicators not just for direct but also for transitive dependencies with vulnerabilities.

GitHub Copilot
Ask GitHub more questions
Search across GitHub to find commits, issues, pull requests, repositories, and topics, right from Visual Studio.
You can now use the GitHub Copilot Chat to search across GitHub to find commits, issues, pull requests, repositories, and topics.
You can ask questions like:
- @github What are all of the open PRs assigned to me?
- @github What are the latest issues assigned to me?
- @github When was the latest release?
- @github Show me the recent merged PRs from @davidfowl
This functionality is available to all GitHub Copilot users. Learn more about available GitHub Skills in the GitHub Copilot documentation.
Important
To use this feature, make sure to activate GitHub Copilot
Custom instructions for GitHub Copilot
Create a file that automatically adds information to all questions you ask GitHub Copilot Chat.
With GitHub Copilot, you can receive chat responses tailored to your team'ss workflow, preferred tools, and project specifics - simply by providing context. Instead of adding this contextual detail to each chat query, you can create a file that supplies this information automatically. While this additional context won't appear in the chat, it is available to GitHub Copilot, allowing it to generate more accurate and relevant responses.
How to Enable Custom Instructions
- Enable the feature via Tools > Options > GitHub > Copilot > and check (Preview) Enable custom instructions to be loaded from .github/copilot-instructions.md files and added to requests.
- Add copilot-instruction.md in the root of your respository inside the .github file, create the file if it doesn't already exist.
Learn more about creating custom instructions here
Important
To use this feature, make sure to activate GitHub Copilot
Model selection in GitHub Copilot Chat
GitHub Copilot now allows you the ability to pick your model.
OpenAI o1-preview and o1-mini are now available to all users in GitHub Copilot Chat in Visual Studio.
You can now try these models firsthand by using o1-preview, o1-mini, or the default GPT-4o model to power GitHub Copilot Chat. With model-switching available, you can seamlessly shift from explaining APIs or generating basic code to crafting intricate algorithms or debugging logic errors.
Visit the GitHub Changelog to learn more about this feature.
Important
To use this feature, make sure to activate GitHub Copilot
Enhanced contextual understanding
Enhanced contextual understanding in GitHub Copilot offers more precise responses.
Enhanced Contextual Understanding in GitHub Copilot
GitHub Copilot now offers enhanced contextual understanding to offer an even more precise responses. With this update, GitHub Copilot can intuitively interpret key characteristics in your code, tailoring suggestions to the unique needs of your project. This smarter approach to code assistance is designed to help you work more efficiently, without the need for frequent context adjustments.
Try it out with GitHub Copilot today!
Important
To use this feature, make sure to activate GitHub Copilot
Content Exclusion updates
Content Exclusion now supports submodules and nested repositories.
We've enhanced how our system handles submodules and nested repositories, making it easier for you to work with complex project structures.
Additionally, we have added support for non-Git repositories, expanding the flexibility of your workflow and allowing you to seamlessly integrate a wider range of projects.
Important
To use this feature, make sure to activate GitHub Copilot
AI smart variable inspection
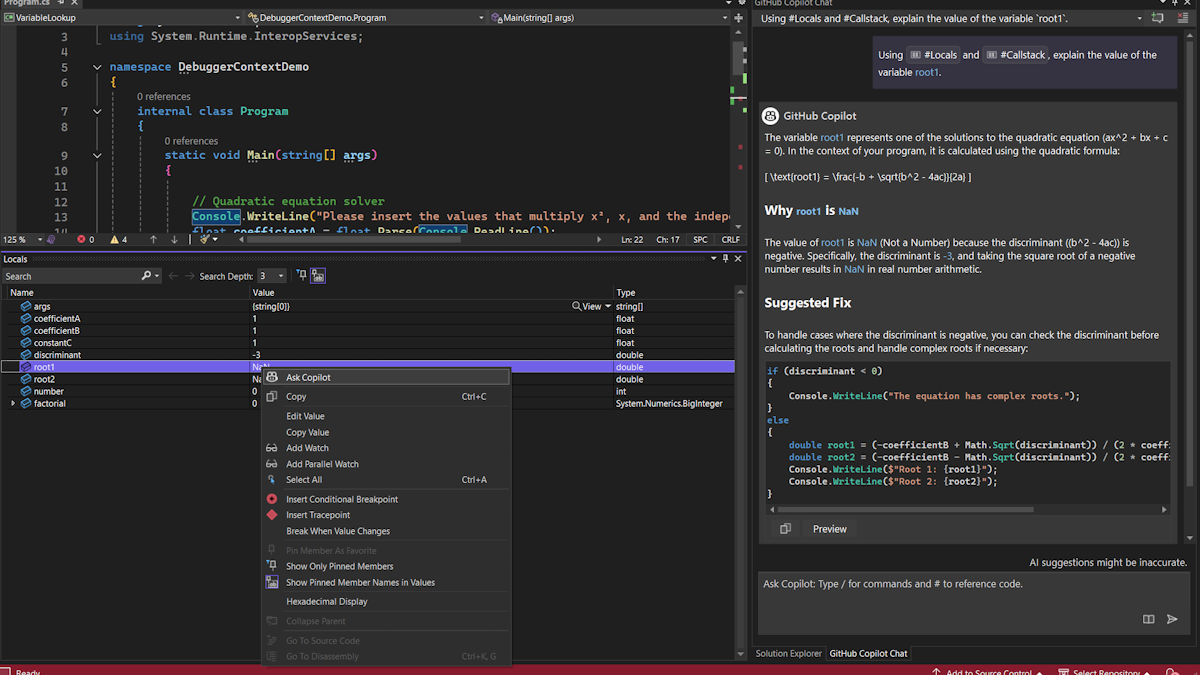
Optimize your debugging workflow with Integrated AI variable inspection.
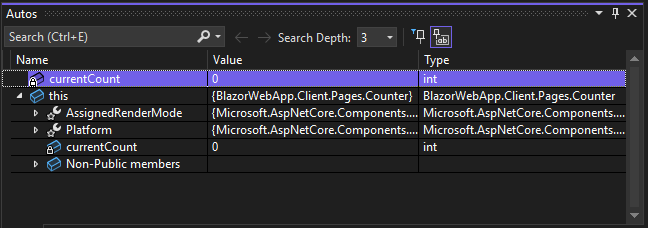
Inspecting and analyzing values from Locals, Autos, and DataTips has never been easier with Ask GitHub Copilot in Visual Studio. Simply right-click on any value to get detailed AI-driven insights on errors, unexpected outcomes, or anomalies - all without ever leaving your IDE.
This feature will significantly enhance your troubleshooting speed by analyzing variables in real-time within your IDE whenever unexpected values arise.
Important
To use this feature, make sure to activate GitHub Copilot
AI-powered IEnumerable Visualizer
AI-powered LINQ Editable Expressions in the IEnumerable Visualizer.
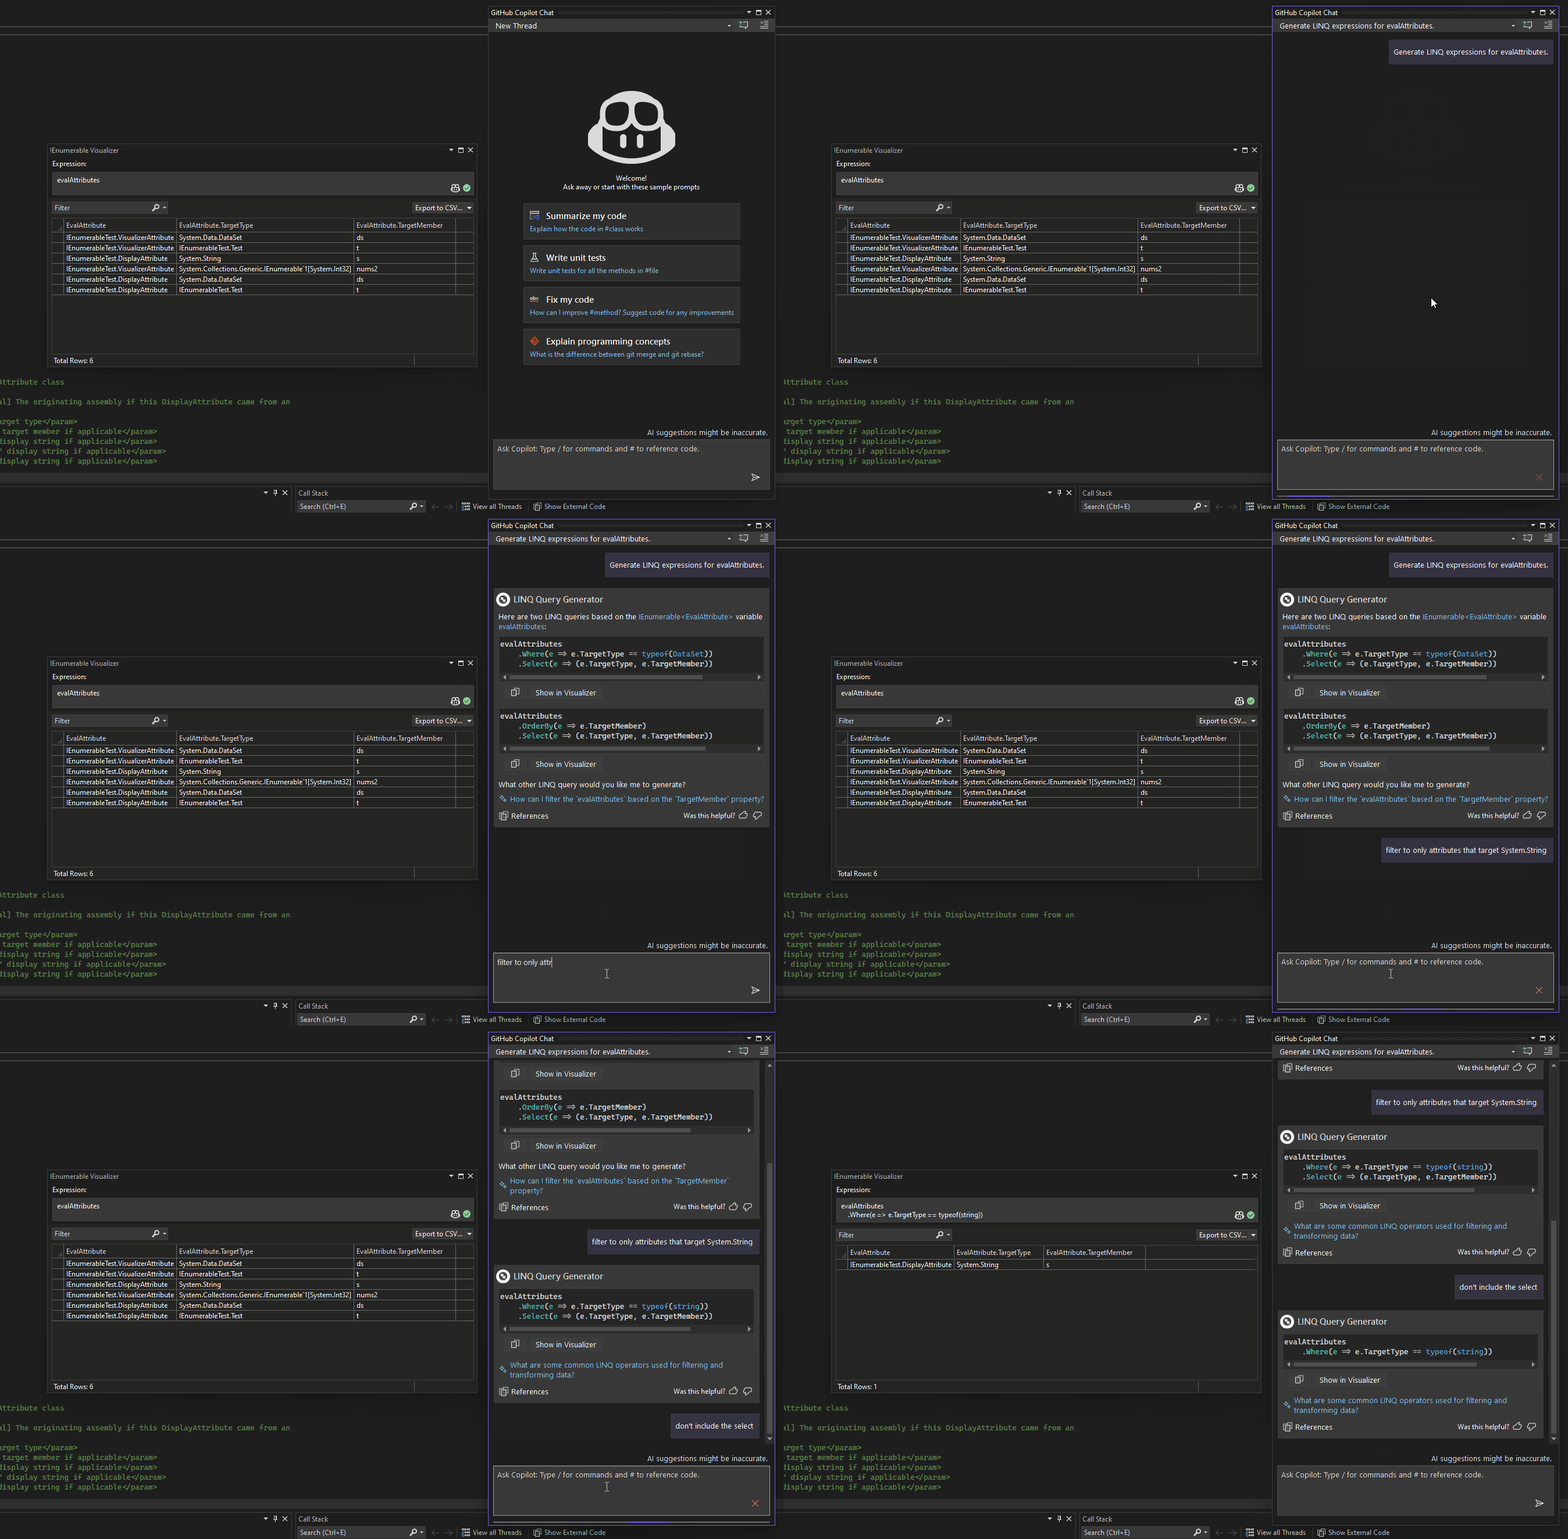
We have enhanced the editable expression feature in the IEnumerable Visualizer with AI assistance. The new Ask Copilot feature allows users to leverage AI directly within the editable expression textbox to craft complex LINQ expressions.
To access the GitHub Copilot chat, simply click the GitHub Copilot icon located in the bottom right corner of the editable expression section. In the chat, you'll find sample LINQ syntax examples. Additionally, you can describe your query in natural language, and GitHub Copilot will generate the corresponding LINQ query. To apply LINQ query filtering to the visualizer, use the Show in Visualizer button in the chat.
It provides instant feedback and guidance, making the process of creating complex filters and transformations more intuitive and efficient.
Important
To use this feature, make sure to activate GitHub Copilot
Debug tests with GitHub Copilot
Get help with debugging failed tests by using Debug Tests with GitHub Copilot.
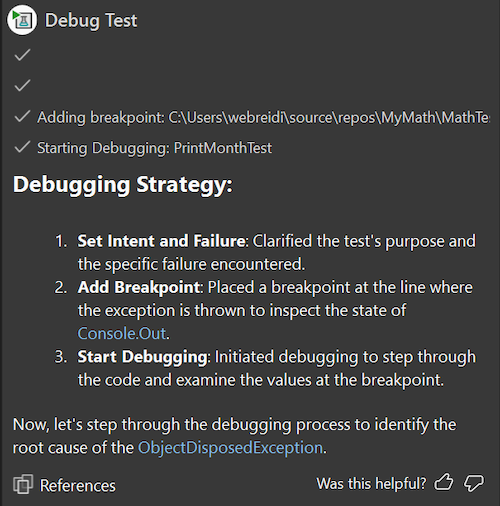
Need help debugging your failing unit tests. Now GitHub Copilot can help by providing you with a debug plan and guiding you through debugging the failed test to get you closer to passing by clicking on the Debug with Copilot button in Test Explorer.
Once you launch the feature, GitHub Copilot will provide you with a debug plan, set appropriate breakpoints and watch variables and launch the debug session. When it hits the breakpoint, it provides GitHub Copilot with values for the watched variables and determines your next step, continue debugging or fix the problem code. You can continue with this conversation until you have a passing test.
Important
To use this feature, make sure to activate GitHub Copilot
Fix code with GitHub Copilot 📣
GitHub Copilot assists you in resolving code issues.
GitHub Copilot is now integrated into the lightbulb and error list, providing you with quick fixes and insightful explanations for code issues. Whether you're developing in C# or C++, this feature helps you understand and resolve problems in your codebase more efficiently.
To get started, simply invoke the lightbulb and select Fix with Copilot. This will launch an inline chat with GitHub Copilot, offering you an available fix.
You can also select the GitHub Copilot icon from the error list to open the chat panel, where you'll find detailed explanations and solutions for the error at hand.
By leveraging LLMs, GitHub Copilot provides helpful explanations and fixes directly within the lightbulb and error list, enhancing your coding experience.
📣 See feature ticket to share your feedback and continue the conversation.
Important
To use this feature, make sure to activate GitHub Copilot
Better AI completions for C#
GitHub Copilot brings in additional context from relevant source files to improve completions for C#.
GitHub Copilot code completions provide autocomplete suggestions inline as you code. These suggestions are generated based on the content from your currently active file and any other open files in your editor. However, we have discovered that incorporating more relevant context significantly improves these suggestions.
To enhance the experience for C# developers, we've updated GitHub Copilot to include additional C# context, such as available types and methods in completions.
With the latest version of Visual Studio, GitHub Copilot now automatically considers semantically relevant files for additional context, even if these files are not open in your editor. This improvement helps reduce hallucinations while offering more relevant and accurate suggestions.
Before: Semantically relevant files are not considered as context for GitHub Copilot Completions
After: Semantically relevant files are considered as context for GitHub Copilot Completions
Important
To use this feature, make sure to activate GitHub Copilot
Reference code in GitHub Copilot
Introducing code referencing in GitHub Copilot, allowing you to permit code suggestions containing public code matches while receiving detailed information about the match.
We're excited to announce that code referencing is now available in GitHub Copilot within Visual Studio!
This new capability provides transparency for developers by notifying them when GitHub Copilot suggestions match public code. You can now see the matching code, its source file, and any associated licensing information, helping them make more informed decisions while coding.
Code referencing allows you to either block or allow suggestions containing public code matches, enhancing control and customization.
By integrating code referencing in GitHub Copilot, we're fostering knowledge sharing, enhancing transparency, and empowering you to create with confidence. Whether you're an individual developer or part of a larger team, this feature enhances your workflow and helps you navigate the complexities of public code with ease.
Try out GitHub Copilot in Visual Studio today and take control of your development process with greater transparency and confidence!
Important
To use this feature, make sure to activate GitHub Copilot
Guided chat in GitHub Copilot
Introducing a new, more conversational way to chat with GitHub Copilot.
We're introducing a new, more conversational way to interact with GitHub Copilot Chat!
We've introduced a more interactive and conversational way to use GitHub Copilot Chat. Now, instead of feeling stuck or unsure, GitHub Copilot will guide you with clarifying questions when context is unclear, ensuring more accurate and helpful responses.
This guided chat experience helps refine your queries, offers suggestions, and ensures smoother, more productive interactions. With this new chat modality, you'll enjoy a smarter, more intuitive GitHub Copilot that adapts to your needs as you code.
Give the new guided chat experience a try today and see the difference for yourself!
Important
To use this feature, make sure to activate GitHub Copilot
GitHub Copilot onboarding
Get started faster in GitHub Copilot Chat!
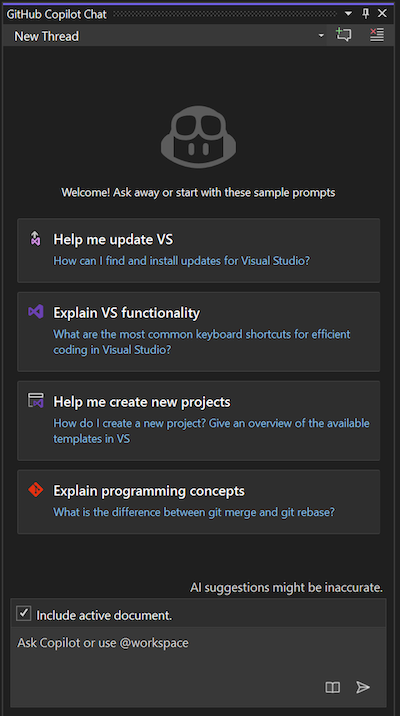
Need help getting started with GitHub Copilot Chat? We've introduced two new onboarding features to help you get started faster.
Starter prompts
Send your first message to GitHub Copilot by clicking on one of the starter prompts! Use these prompts to see what capabilities GitHub Copilot has to offer to you in your workflow.
Prompt Library
If you need to reference some pre-made prompts again, click on the Prompt Library button (book icon) to see a list of all the prompts available to you. This library holds commonly used prompts, just a click away!
Whether you're exploring new coding tasks or just looking for inspiration, our prompts are here to help you dive right in and start making the most of GitHub Copilot Chat.
Give one a try and see where it takes you!
Important
To use this feature, make sure to activate GitHub Copilot
.NET
Achieve more with .NET 9 📣
.NET 9 elevates cloud-native and intelligent app development, focusing on productivity enhancements, streamlined deployments, and accelerated AI integration.
.NET 9 elevates cloud-native and intelligent app development, focusing on productivity enhancements, streamlined deployments, and accelerated AI integration, providing superior performance across a wide range of applications. With full support for .NET 9 in Visual Studio 17.12, you can easily leverage all the latest improvements. For more details on what's new, visit What's new in .NET 9.
Additionally, you'll find updates to features around the IDE that make working with .NET and ASP.NET more productive than ever.
📣 See feature ticket to share your feedback and continue the conversation.
Suppressing warnings for specific GitHub Advisories respected in Visual Studio
NuGet allows to suppress warnings for specific GitHub Advisories and the supressions are respected in Visual Studio.
NuGet Audit provides warnings when a package used in the project has a known vulnerability. It's always recommended to upgrade to a new version of the package, but if the upgrade is impossible and you are confident that the software is not at risk, you can suppress warnings for specific GitHub Advisories by adding
NuGetAuditSuppressitems to the project file.<Project Sdk="Microsoft.NET.Sdk"> <ItemGroup> <NuGetAuditSuppress Include="https://github.com/advisories/GHA1234" /> </ItemGroup> </Project>
Ability to configure nuget.org as audit source
Now you can set nuget.org as an audit source to get vulnerability information even when using other NuGet feeds.
NuGet Audit requires a package source that provides a vulnerability database. nuget.org provides vulnerabilities information from the GitHub Advisories Database.
Starting with Visual Studio 17.12, it's now possible to specify audit sources in NuGet.Config files, so it's no longer required to use nuget.org as a package source.
If you're not using nuget.org as a package source and wish to use NuGet Audit for vulnerable package reporting during restore, add the following to a NuGet.Config file in your solution directory:
<confiuration>
  <!-- any existing config, including <packageSources> -->
  <auditSources>
    <add key="nuget.org" value="https://api.nuget.org/v3/index.json" />
  </auditSources>
</configuration>
Debugging & diagnostics
Blazor WebAssembly debugging 📣
An improved debugging experience for Blazor WebAssembly apps targeting .NET 9 or later.
Visual Studio now offers an improved debugging experience for Blazor WebAssembly apps targeting .NET 9 or later:
- Data types shown in the debugger now match the expected .NET data types.
- Type members and member visibility use expected icons.
- The displayed call stack is cleaned up to only shows the .NET call stack and correctly honors the Just My Code setting.
- The modules window is now supported.
- Expression evaluation support in the Immediate window and for watches and conditional breakpoints is expanded and improved.
To enable the new preview debugging experience:
- Enable the Enable new .NET 9+ Mono debugger setting.
- Install the latest .NET 9 SDK.
- Update your Blazor app to target .NET 9.
📣 See feature ticket to share your feedback and continue the conversation.
Meter histogram in the profiler
Enhanced performance insights using meter histogram in the profiler counter tool.
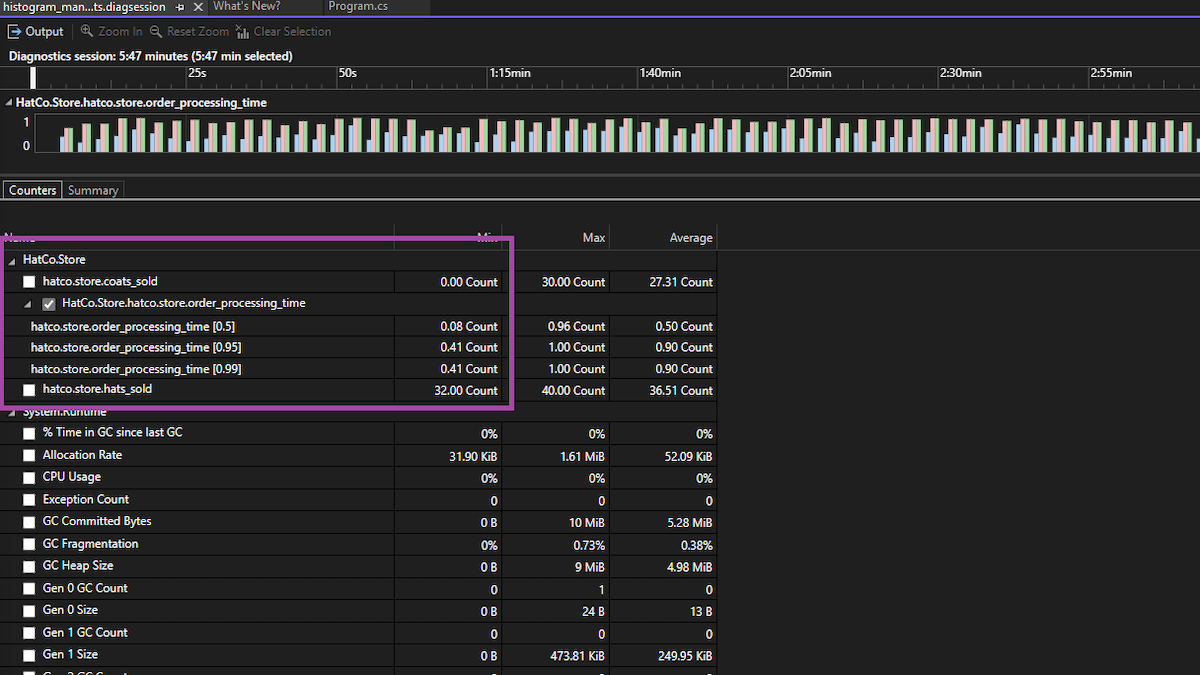
The recent enhancement to Visual Studio's performance profiling suite introduces the meter histogram feature. This tool allows you to identify and analyze histogram data generated by histogram instruments. When recording data from these instruments, the histogram results are visualized, providing a clear representation of data distribution.
Additionally, the swimlane graph offers a detailed, segmented view of performance metrics, enhancing your ability to pinpoint and address performance issues effectively.
Display method return values 📣
The debugger now shows inline return values with AI assistance for improved efficiency.
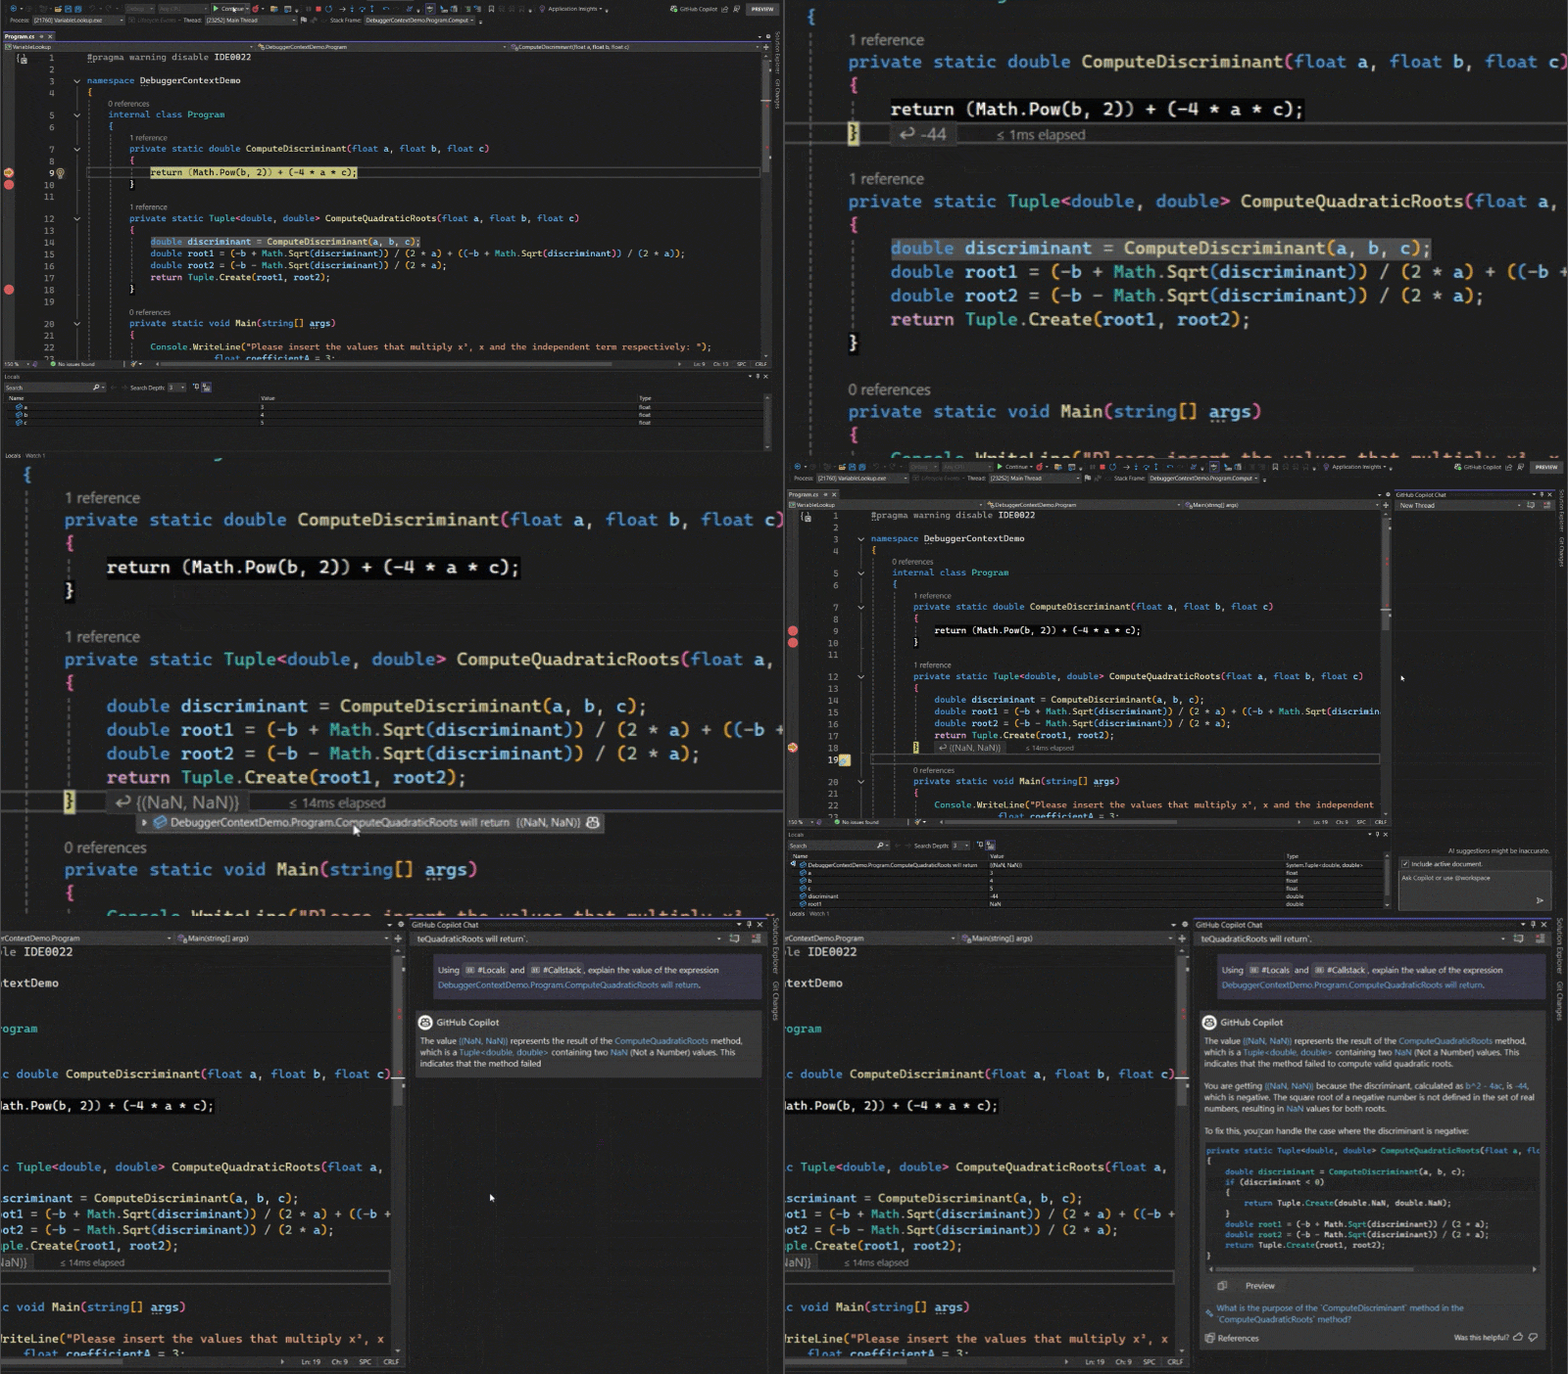
The Visual Studio debugger now displays inline values for return statements, responding to one of the most requested features from the developer community.
This enhancement allows you to see the exact values being returned by functions directly in the code, eliminating the need for additional code or temporary variables to inspect return values.
With GitHub Copilot, you can take it further by using the Ask Copilot option on hover to analyze return values directly in Visual Studio, allowing you to address issues immediately.
It is supported in both native and managed code.
📣 See feature ticket to share your feedback and continue the conversation.
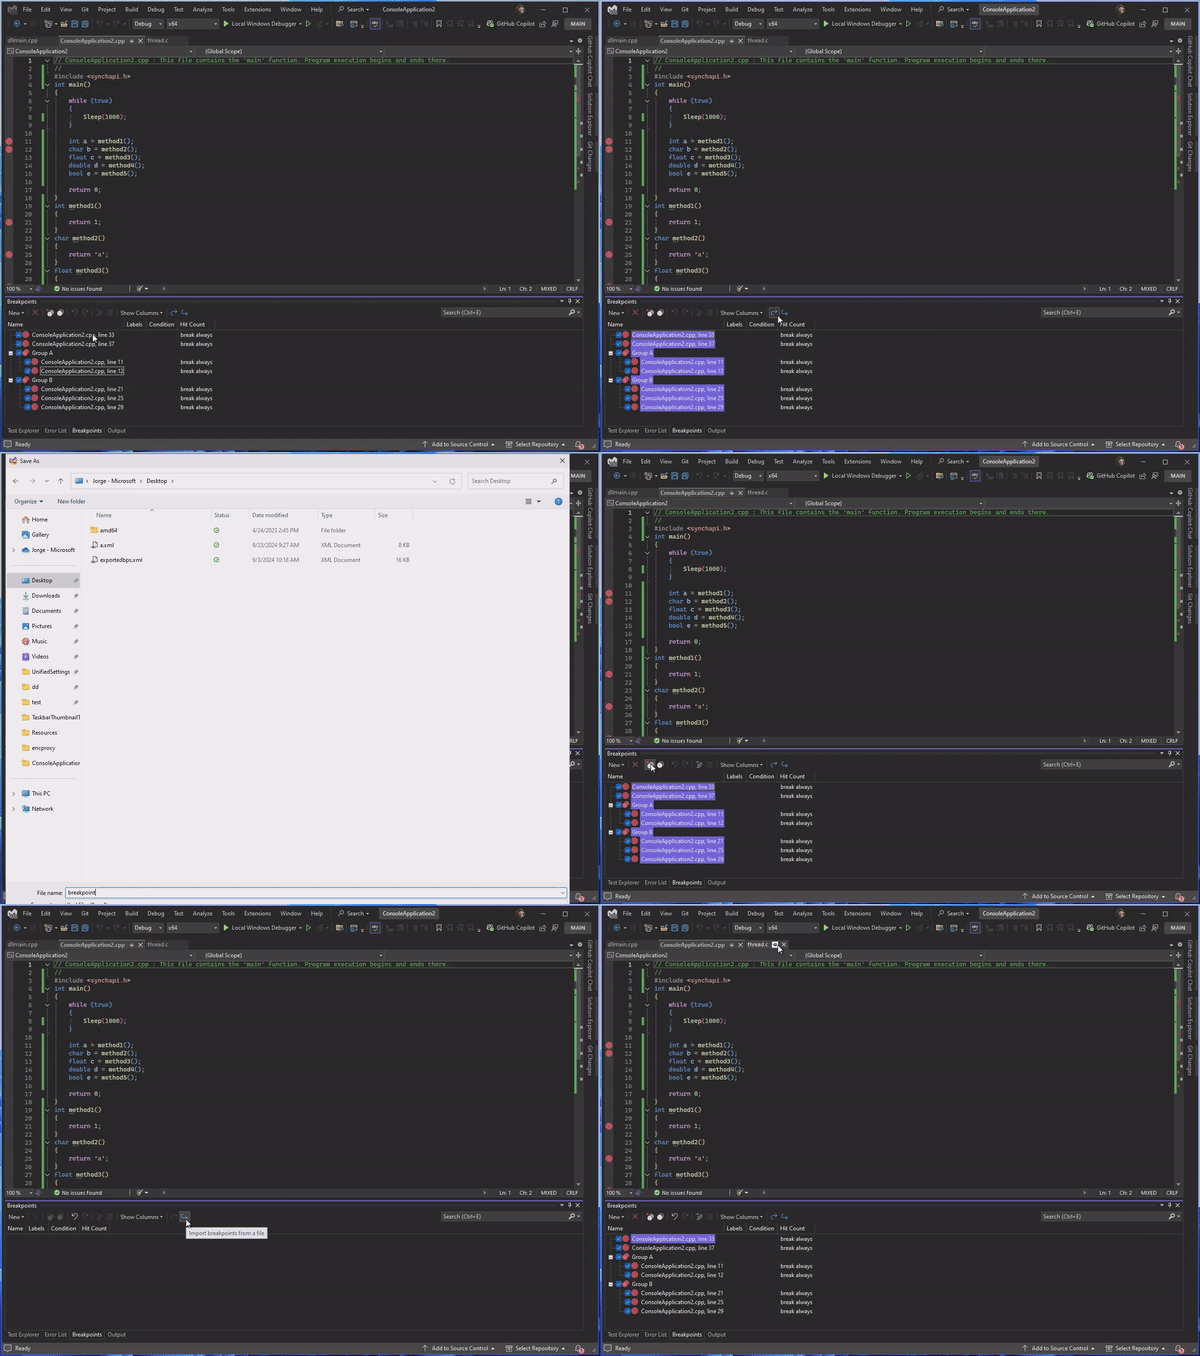
Export breakpoint groups with ease 📣
Effortless import and export of breakpoint groups.
Visual Studio Breakpoint Groups now support import and export functionality, enabling you to easily manage and maintain your breakpoint structures across multiple projects or environments.
This new feature allows you to export your breakpoint groups with their configurations and later import them into different solutions, ensuring a consistent debugging setup without the need to manually recreate breakpoints groups again.
📣 See feature ticket to share your feedback and continue the conversation.
IntelliSense for the IEnumerable Visualizer 📣
Enhanced IEnumerable Visualizer with IntelliSense for faster LINQ queries.
The IEnumerable Visualizer has been enhanced with IntelliSense, providing real-time code suggestions and autocompletion, which makes writing LINQ expressions faster and more accurate.
This improvement simplifies the process of building and editing queries by offering smart code recommendations, reducing the likelihood of errors, and speeding up development time.
📣 See feature ticket to share your feedback and continue the conversation.
Analyze memory use over time
Select and compare two memory snapshots using the Diagnostics Tool window.
The Diagnostics Tool window now supports comparing memory snapshots, making it easier to analyze memory changes over time.
To use this feature, ensure you have at least two memory snapshots captured under the Memory tab in the Diagnostics Tool window.
Selecting Snapshots for Comparison
- Hold the Ctrl key and click on the snapshot rows to select any two snapshots.
- Alternatively, hold the Shift key and use the
up/downarrow keys to select two consecutive snapshots.Unselecting Snapshots
- Hold the Ctrl key and click on the snapshot you want to unselect.
Viewing the Difference
Once you've selected the memory snapshots for comparison, click the View Diff button located above the snapshot list to view the differences between them.

Git tooling
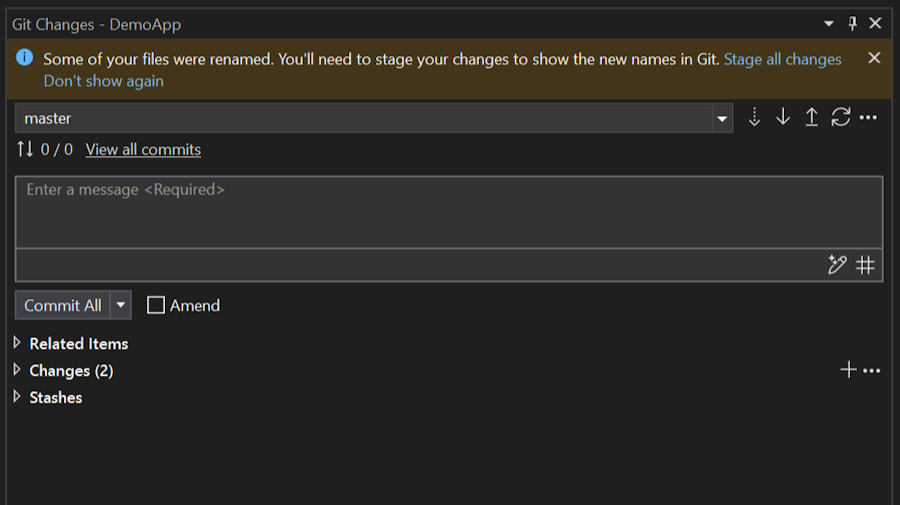
Manage file renaming with Git 📣
Get peace of mind when renaming files with a new notification.
When you rename files from solution explorer, you'll be reminded to stage your changes to see the renames in Git. This boosts your confidence that Git is recognizing your file change and tracking it correctly. We found this to be a point of confusion for many customers, so we worked with folks in the Developer Community to produce a new notification.
📣 See feature ticket to share your feedback and continue the conversation.
Pull request drafts and templates 📣
Create pull request drafts and start your descriptions with templates in Visual Studio.
You can now create pull request drafts and start your descriptions with GitHub templates in Visual Studio. These were the two top requests for the create a pull request experience.
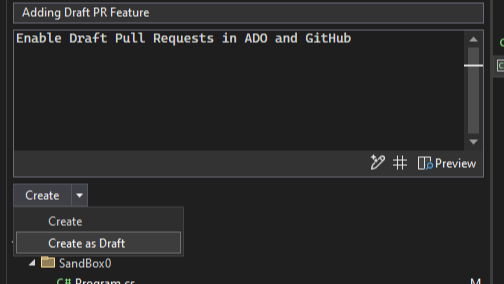
Draft PRs
Use the drop-down menu on the Create button to Create as Draft.
PR Templates
Your default PR template will be used when creating a new PR for both GitHub and Azure DevOps. Learn more about how to add a PR template to your repository in the GitHub documentation and Azure DevOps documentation.
📣 See feature ticket to share your feedback and continue the conversation. And take this survey to help make the feature even better.
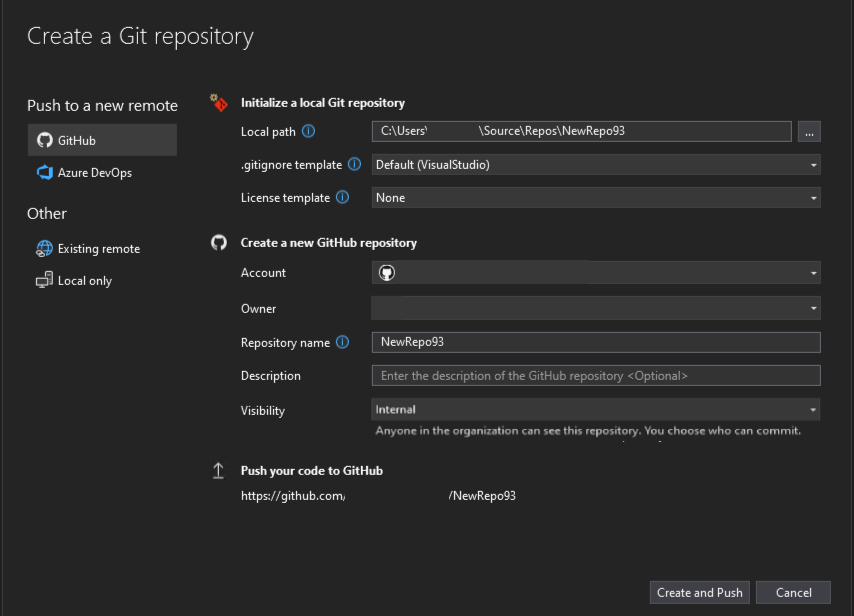
Create internal GitHub repos 📣
Visual Studio now supports creating internal repos and includes guidance for each type of repository to give you more confidence when starting a new project.
Visual Studio now supports internal repos for your GitHub organizations. We also included guidance for each type of repository to give you more clarity on the visibility of the new project depending on which account you're using.
📣 See feature ticket to share your feedback and continue the conversation.
Copy Git link 📣
You can get a GitHub or Azure DevOps link to a specific line of code to make it easy to share with your colleagues.
Whenever you share a few lines of code with a colleague, it can often be useful for them to get extra context from your repository. However, if they're working on something else it can take too long and disrupt their work to checkout your branch.
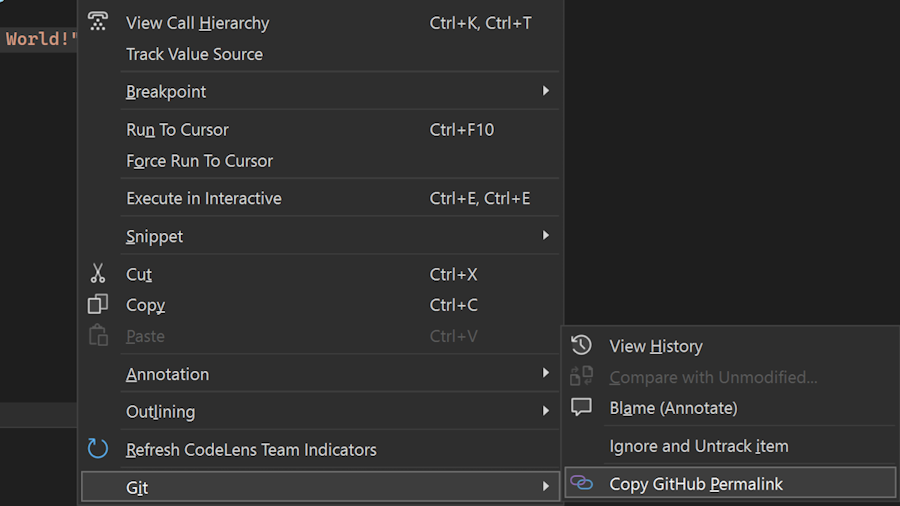
Now, you can highlight the code you want to share in your editor, open the context menu with a right click, and under the Git submenu get a shareable link to your code in GitHub or Azure DevOps. This makes it simple and easy to collaborate, and it smooths the flow between the IDE and your remote repos on the web.
You can also get shareable links directly from commit history. This allows for code not currently checked out to be referenced just as effortlessly.
📣 See feature ticket to share your feedback and continue the conversation.
Git multi-repo support 📣
You can now create pull requests and link work items in multi-repo scenarios for both GitHub and Azure DevOps.
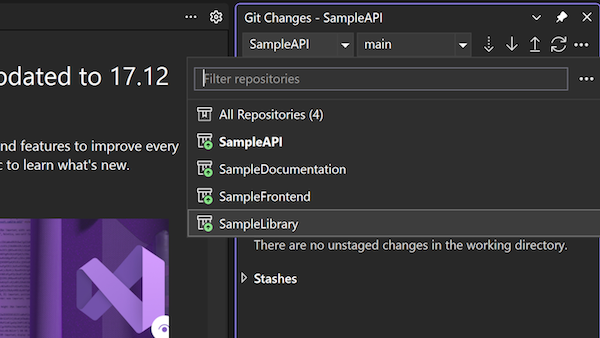
You can now create pull requests and link work items in multi-repo scenarios. For both GitHub and Azure DevOps, we support your integrations when you use the repository picker to focus on a particular repository in your multi-repo scenarios.
📣 See feature ticket to share your feedback and continue the conversation.
Customize AI Git commit message 📣
You can add additional instructions to the prompt for generating your Git commit message with GitHub Copilot.
Now you can add additional instructions to the prompt for generating your Git commit message with GitHub Copilot. This allows you to customize the commit message to better fit your workflow and team's standards. You can specify the number of lines to generate, the length of the lines, and even provide a sample commit style. Edit the message in the prompt field under Tools > Options > GitHub > Copilot > Source Control Integration.
📣 See feature ticket to share your feedback and continue the conversation.
IDE
Multi-Project Launch Configuration 📣
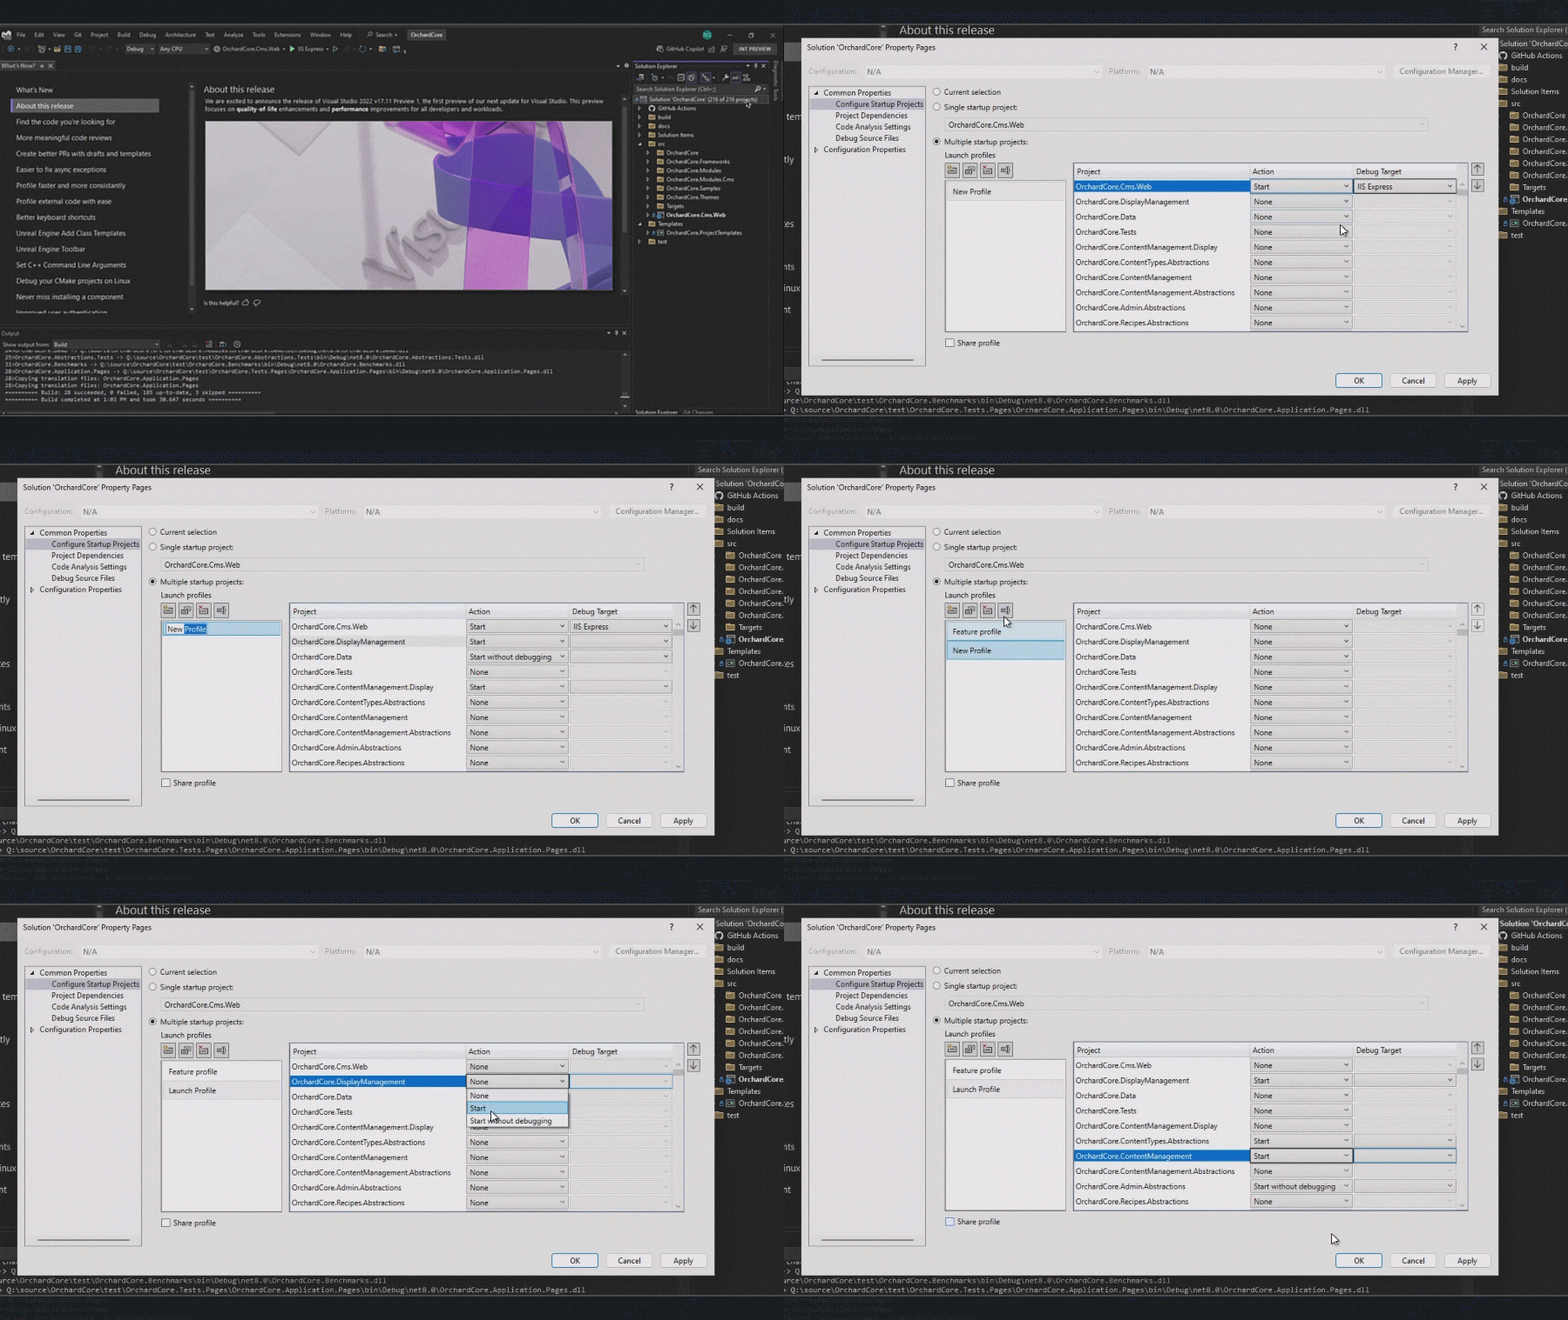
Streamline debugging by setting up and saving launch profiles for specific projects within multi-project solutions. Share configurations effortlessly with your team.
The Multi-Project Launch Configuration feature allows you to set up and save profiles for launching specific projects within a multi-project solution in predefined states for debugging.
This simplifies the process of working with complex solutions, improves debugging efficiency, and enables easy sharing of configurations among team members.
📣 See feature ticket to share your feedback and continue the conversation.
Note
This feature must be enabled under Tools -> Manage Preview Features
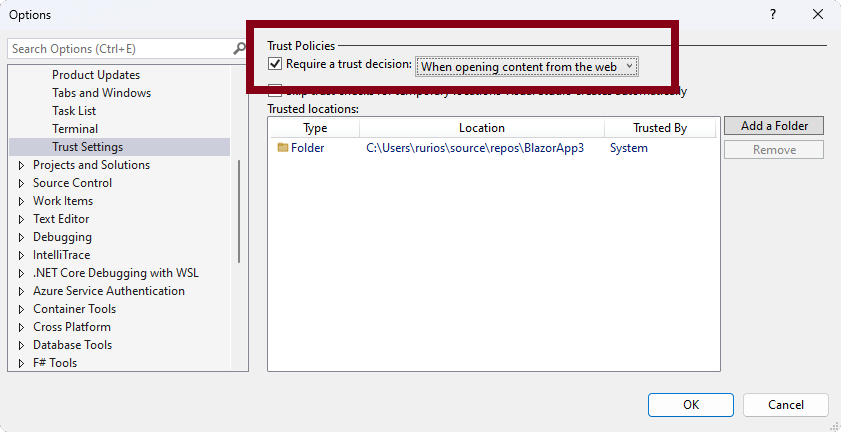
MotW security warnings
Mark of the web (MotW) security warnings are now integrated into the overall trust functionality.
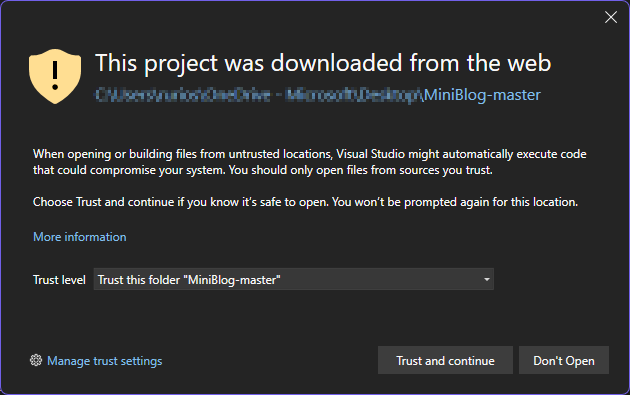
Visual Studio will show a security warning when it detects that you're attempting to open content tagged with the Mark of the Web (MotW) identifier.
This new trust-related warning conveys the risks of opening content from potentially unsafe sources like internet downloads.
You can modify the default trust experience by going to the Trust Settings under Tools > Options > Environment.
Teams Toolkit new AI templates
The Teams Toolkit onboards new AI Teams app templates.
Teams Toolkit adds three new Teams AI app templates:
They are:
Basic AI Chat Bot - your own copilots in Microsoft Teams built with Teams AI Library
Chat With Your Data - an intelligent chatbot template with domain knowledge from custom data source.
Teams Toolkit now empowers you to create Custom Copilot which is an AI-powered chatbot with RAG capability that can understand natural language and retrieve domain data to answer domain-specific questions. This template supports to access your custom data in Custom Copilot app.
When you select this template, you can select two ways to connect with your data:
a. Azure AI Search: your chatbot can access data on Azure AI search service and use it in conversation with users.
b. Custom data source: you can add whatever data source you want to Custom Copilot app, for example file system or vector DB.
AI Agent - an AI Agent in Teams that can make decisions and perform actions based on LLM reasoning.
Please try out the new AI app templates to start your AI journey in Teams!
Copy files between instances 📣
You can now copy files and folders from Solution Explorer in one instance of Visual Studio to another.
We are excited to introduce a highly requested feature in Visual Studio! You can now seamlessly copy and paste code files and folders between different Visual Studio instances using the Solution Explorer. Simply select the desired file or folder, use Ctrl+C or Ctrl+X, switch to another Visual Studio instance, and use Ctrl+V to include those files or folders in your new solution. All changes will be accurately reflected in the file system.
In addition to copy and paste, you can also drag the files and folders from one instance of Visual Studio to another.
Previously, this functionality was available only for a few project types, but we have now expanded it to include all the major project types in Visual Studio.
📣 See feature ticket to share your feedback and continue the conversation.
Cloud
Azure App Service publish security updates
Publishing to Azure App Service securely using integrated security updates.
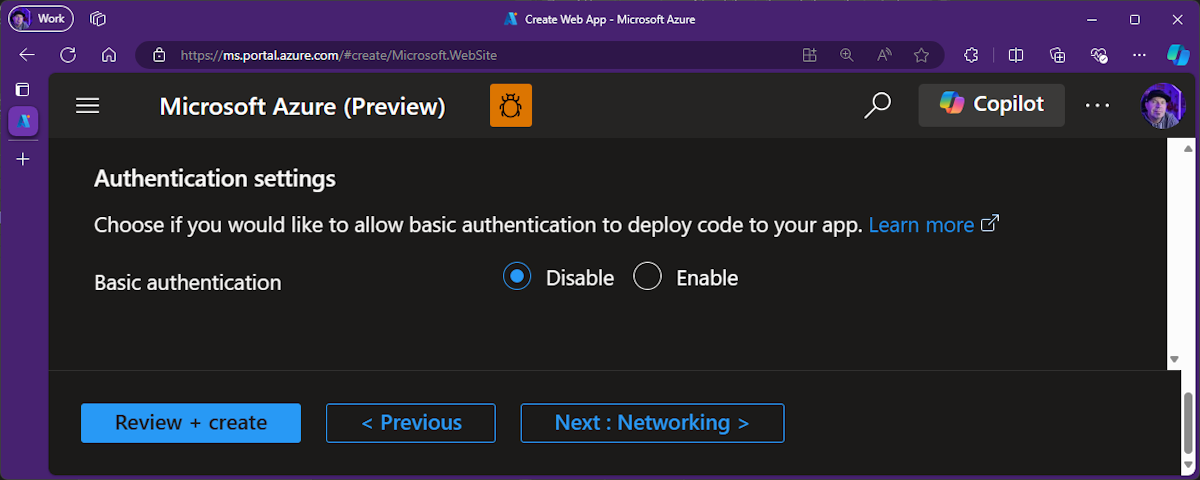
Azure App Service's publishing guidance advises customers to disable Basic Authentication and enable publishing via integrated authentication.
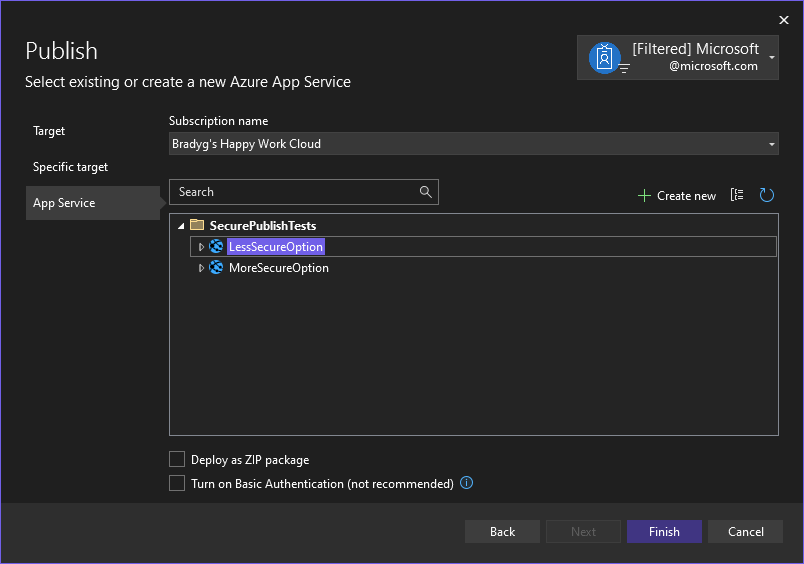
The new feature in Visual Studio 2022 disables Basic Authentication and enables integrated security for publishing to Azure App Service. This ensures that publishing credentials is handled securely, reducing the risks associated with Basic Authentication.
When publishing to an Azure App Service that has Basic Authentication enabled (which is not recommended), users will see the Turn on Basic Authentication option, and it will be unchecked by default. Customers who need to retain Basic Authentication can check the box, but given the recommendation is to disable Basic Authentication, this is unchecked by default. So you start secure if this is the first time you publish or, you get secure once you go through the publishing process after you update Visual Studio.
If you've created the Web App recently via the portal or this or any future version of Visual Studio, Basic Authentication will be disabled by default. For any Web App that's already got Basic Authentication disabled, we circumvent inadvertently making the Web App less secure by disabling the checkbox altogether, so you stay secure.

Azure WebJobs Linux support 📣
Publishing to Azure WebJobs on Linux is now supported by right-click publish in Visual Studio.
Cross-platform .NET 5.0+ Console Apps are supported on Azure WebJobs Linux, and now, you can right-click publish your code to Azure WebJobs on Linux from Visual Studio, too!
📣 See feature ticket to share your feedback and continue the conversation.
Azure Functions Flex Consumption
Publish to Azure Flex Consumption hosting plan, currently in Preview.
If you're trying the new Azure Functions Flex Consumption hosting plan, currently in Preview, you'll enjoy being able to right-click publish to Flex from Visual Studio.
Flex Consumption will further extend your apps' functionality and provide you the following:
- Virtual Network integration at no extra cost
- Fast and predictable scaling with instance size choice and per instance concurrency control
- Serverless with scale to zero and you only pay for instances while they are active
- Cold Start mitigation with the optional Always Ready instances feature
Learn more about Flex Consumption in the announcement blog post or documentation and try out one of our samples.

Connected Services security update
Making your apps and development experiences more secure.
In this update to Connected Services, you can now connect your project code to Azure resources, like Azure Storage, without the need for secrets or connection strings in your code or configuration.
Now, you'll give your connection a name, the endpoints are persisted to configuration instead of the full connection string. This means fewer secrets on disk, so your development time will be more secure by default and suffer fewer errors committing secrets to source control.
We're also using the latest Azure SDKs, so you'll get support for connecting to your Azure resources using your Visual Studio (or Azure CLI) login instead of connecting via a connection string. When running locally, your code will use your logged-in credential to access the resources. When running in Azure, the Azure SDK will use the managed identity of the app service to access the resources.
Connected Services sets it all up for you and injects the appropriate code to use integrated identity instead of secrets. During publishing, your app will be configured with the appropriate identity and roles required to access the resources.
Desktop
Improved MSIX tooling for UWP apps on .NET 9 📣
Visual Studio now references the new standalone single project MSIX tooling to package UWP apps on .NET 9.
In the initial preview of UWP support for .NET 9, we relied on WindowsAppSDK to provide the MSIX tooling to package apps using the single project configuration (as opposed to using a Windows Application Packaging project, ie. a .wapproj file). Doing so introduced several issues, the main one being that the WebView2 transitive dependency from WindowsAppSDK was automatically added to all UWP apps as well, even when not needed.
We have now fully decoupled the single project MSIX tooling, and published it as a new standalone NuGet package: Microsoft.Windows.SDK.BuildTools.MSIX. This includes everything needed to build, deploy and run UWP apps on .NET 9, as well as generating MSIX packages to publish in the Microsoft Store or sideload. The UWP on .NET 9 tooling in Visual Studio will automatically add these two package references when needed:
This both fully removes the WebView2 transitive dependency, and the build error that was present for new projects in previous preview versions when not manually setting the WindowsSdkPackageVersion property in the .csproj file. With this change, new projects will just build and run without needing any additional changes!
📣 See feature ticket to share your feedback and continue the conversation.
Enhanced WinUI components search
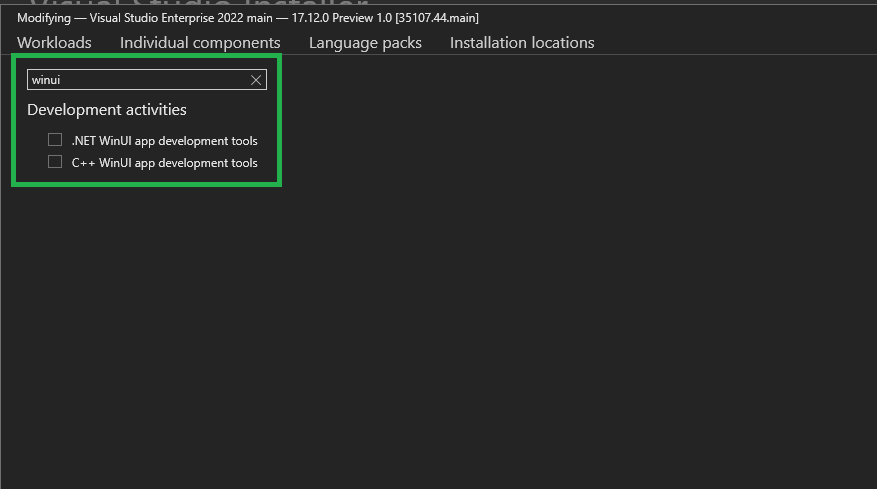
Enhance WinUI project setup with improved Visual Studio Installer search, simplifying component location for developers.
Streamline your WinUI project setup further with our latest Visual Studio installer update! Developers can now quickly locate WinUI-related components, eliminating the previous frustration of navigating through an empty search result. This enhancement simplifies the development environment configuration, allowing for a more intuitive and efficient user experience.
Open the Visual Studio Installer, go to Individual components tab and search for WinUI related keywords (WinUI, WinRT)!
.NET 9 SDK support for UWP 📣
Visual Studio now includes the .NET 9 SDK with UWP support out of the box.
One of the necessary steps to take to try out UWP on .NET 9 in the initial preview was to install a nightly build of the .NET 9 SDK. With this new release of Visual Studio, that is no longer needed.
Visual Studio now includes the .NET 9 SDK, which has all the new support for UWP on .NET 9 (specifically, logic to reference the UWP XAML projections, and to configure CsWinRT to project types for UWP XAML apps). You can now build and run UWP on .NET 9 projects with the .NET SDK that's automatically installed with Visual Studio.
📣 See feature ticket to share your feedback and continue the conversation.
Simplified .csproj for UWP 📣
UseUwpTools is now set automatically by Visual Studio for modern UWP projects on .NET 9.
UWP apps and libraries using .NET 9 used to require two properties in their .csproj files:
UseUwp, which configures the .NET SDK for UWP XAML apps, andUseUwpTools, which enables all the new tooling in Visual Studio to build and run UWP XAML apps.The
UseUwpToolsproperty is now automatically set by Visual Studio whenUseUwpis set, to make the .csproj less verbose in the common scenario. For advanced scenarios, it is still possible to opt-out by manually disablingUseUwpTools.📣 See feature ticket to share your feedback and continue the conversation.
RIDs for UWP in .NET 9 fixed 📣
UWP on .NET 9 class libraries correctly set the RIDs to the right values for Native AOT.
We fixed a bug in the APPX tooling for UWP class libraries (and WinRT components) on .NET 9, which was applying the runtime identifiers of UWP on .NET Native by default (ie. using the
win10-prefix, and including platforms which are no longer supported, such as arm).The APPX tools will now set the right RIDs for .NET 9 projects by default:
win-x86;win-x64;win-arm64. It is still possible to manually specify these, if desired.📣 See feature ticket to share your feedback and continue the conversation.
UWP project creation fixed 📣
We fixed the Universal Template Wizard that was causing to no longer show an error dialog when creating new UWP on .NET 9 projects.
If you're using the preview VSIX with the new project templates for UWP on .NET 9, you might have noticed that an error dialog was showing up right when creating a new project. This was especially problematic when creating a new solution, as Visual Studio would not open it correctly after creating the project. This issue has now been resolved, and creating new projects targeting UWP on .NET 9 will now work correctly.
📣 See feature ticket to share your feedback and continue the conversation.
Web
Request variables in HTTP files 📣
HTTP files now support request variables. That is where you can send a request and then use data from the response, or request, in future requests.
When working with HTTP files, a common scenario is calling an endpoint, taking a value from the response, and sending in a subsequent request. For example, you may call an endpoint to authenticate a user and then on later calls you can pass the token that was returned from the login endpoint. Prior to this release this was not possible in Visual Studio. In the snippet below you can see an example of how this works in an HTTP file.
# @name login
POST {{TodoApi_HostAddress}}/users/token
Content-Type: application/json

{
  "username": "{{myusername}}",
  "password": "{{mypassword}}"
}

###

GET {{TodoApi_HostAddress}}/todos
Authorization: Bearer {{login.response.body.$.token}}

###
In the above snippet there are two requests, the first calling into the
/users/tokenendpoint to authenticate the user. Immediately above the request line, you'll see the comment# @name login. This syntax gives the request a name (loginin this case) and configures it as a Request Variable. When the request is sent you can access values from the response, or request, in any future request that is sent from that HTTP file. Since this is a request to login, you should be careful to secure your secrets. In Visual Studio we have support for accessing secrets in a secure manner. See this section on the docs for more info on handling secrets.The second request calls into an authenticated endpoint,
/todos, which will return thetodoitems for that user. In the request the token is passed in as a header with the line.Authorization: Bearer {{login.response.body.$.token}}The
/users/tokenendpoint returns a response in JSON. The token is extracted with a JSON Path expression,$.token, on the body of the response. If you are using an endpoint that returns XML, instead of a JSON Path expression you can pass in an XPath expression. The support in Visual Studio has been inspired by the existing OSS extension for REST Client that is available for Visual Studio Code. You can learn more about Request Variables there. We will be adding documentation soon to discuss this support in much more detail.📣 See feature ticket to share your feedback and continue the conversation.
Vitest support in JavaScript and TypeScript 📣
When using JavaScript and TypeScript projects you can now author test cases with Vitest.
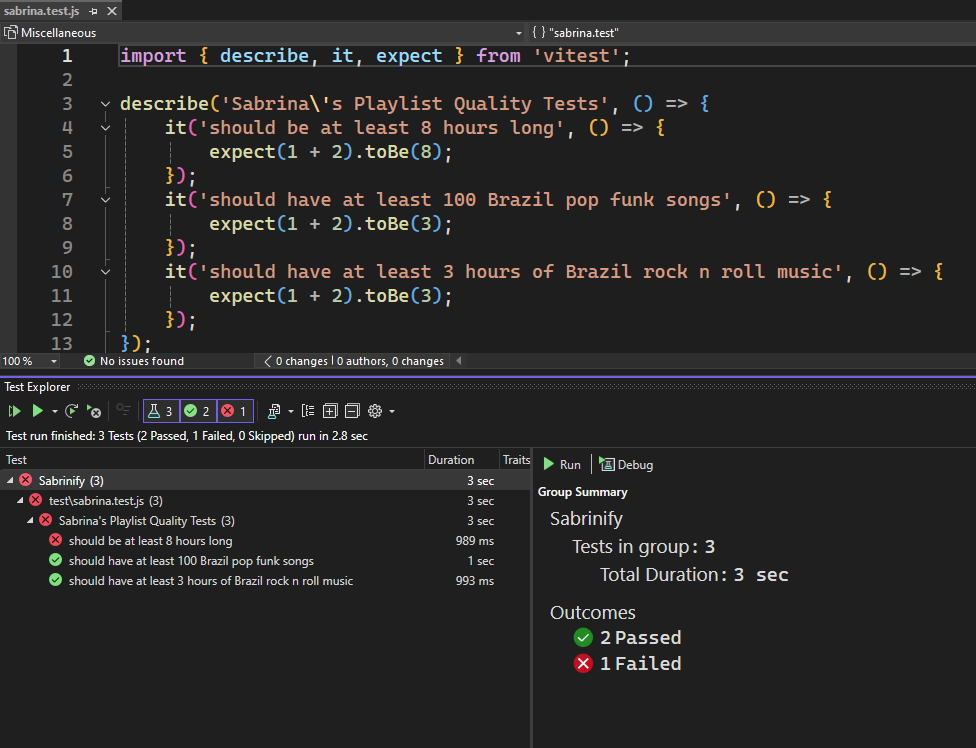
In JavaScript and TypeScript projects (JSTS), projects that have the extension .esproj, we have added support to discover and run tests authored with Vitest. To get started with Vitest tests, in a JSTS project add the vitest package using the npm in the Solution Explorer and then modify the project file to have the following properties declared.
    <JavaScriptTestRoot>test\</JavaScriptTestRoot>
    <JavaScriptTestFramework>Vitest</JavaScriptTestFramework>
Ensure that the value for
JavaScriptTestRoothas the correct relative path to where your test files are located.Add your tests to the correct folder and build the project/solution. After that, you should see the test cases in the Test Explorer.
In the Test Explorer you can see the different test cases that are discovered and execute the test cases.
We have not yet added support for debugging, but we will be adding that support soon. Another known issue is when you double click on a test case in Test Explorer, it will take you to the first line of the file where the test case is defined. We will be improving this experience as well.
📣 See feature ticket to share your feedback and continue the conversation.
Inlay Hints for more languages 📣
Inlay Hint support has been added to JavaScript, TypeScript, Python and Razor as well as a setting to control its behavior.
Inlay hints show additional information about source code that is rendered inline. This is usually used to show inferred types, parameter names, and other implicit information from your code directly in your editor.
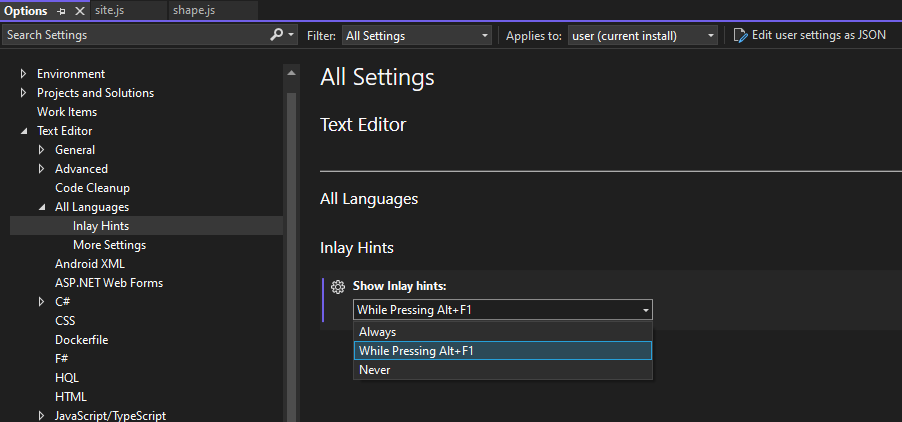
We have added support to show Inlay Hints in JavaScript, TypeScript, Razor, and Python. We have also added a new setting so that you can customize the behavior of hints across these languages. This setting doesn't apply to C# and C++ yet. To enable Inlay Hints for these languages you can use the new setting at Tools > Options > Text Editor > All Languages > Inlay Hints. You can see the new option in the following image.
There are three different values for Inlay Hints.
- Always: Always show the Inlay Hints.
- While Pressing Alt+F1: Only shows Inlay Hints while Alt and F1 are pressed. This is the default value.
- Never: Inlay Hints are never shown.
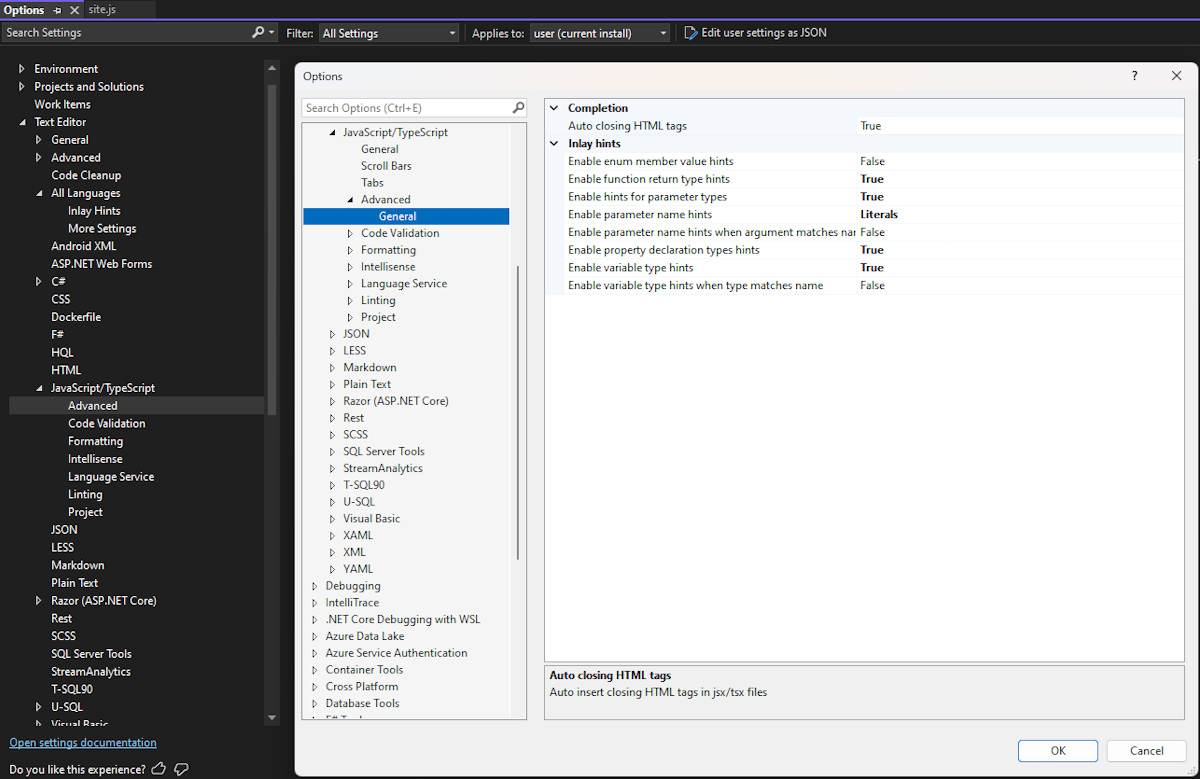
For JavaScript and TypeScript, there is an additional options page to configure the behavior of Inlay Hints. This can be found at Tools > Options > Text Editor > JavaScript/TypeScript > Advanced > General.
Those options are shown in the image that follows.
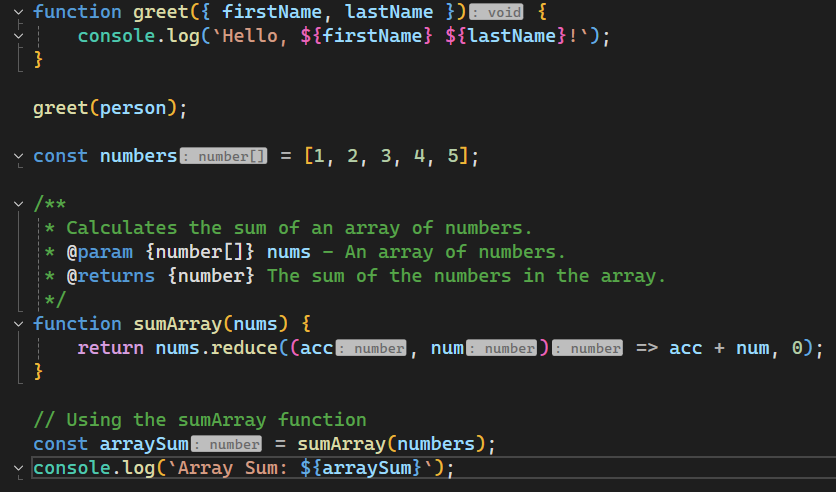
By default, all these options are disabled, you should enable the hints that you are interested in viewing for JavaScript and TypeScript files. In a future update we may change the default values for these options. In the image below you can see a JavaScript file that shows Inlay Hints.
In the previous image the Inlay Hints that are shown are the gray boxes with
: numberto indicate the type of the variable.📣 See feature ticket to share your feedback and continue the conversation.
HTTP files shared environment 📣
In HTTP environment files we have added support to share variables across environments.
When using HTTP files in Visual Studio you can define environments so that you can create different settings for API testing. Previously, sharing a variable across these environments wasn't possible. We have added support for a new entry,
$shared, in the environment file which enables you define default values for variables which are available across all environments.For example, consider the environment file (http-client.env.json) below.
{
    "$shared": {
        "HostAddress": "https://localhost:7293"
    },
    "dev": {
        "username": "sayedha"
    },
    "dev2": {
        "username": "madsk"
    },
    "staging": {
        "username": "staginuser",
        "HostAddress": "https://sayedrest.example.com"
    }
}
We have defined the shared values in
$sharedabove which consists of theHostAddressvariable which is set tolocalhost:7293.Of the three environments defined, neither dev environment has specified the value for
HostAddressbut staging has a value for it.When you use either the
devordev2environment the value forHostAddresswill come from$sharedsince those environments don't have a value forHostAddress. When using the staging environment, the value forHostAddresswill be set tohttps://sayedrest.example.com.📣 See feature ticket to share your feedback and continue the conversation.
Data
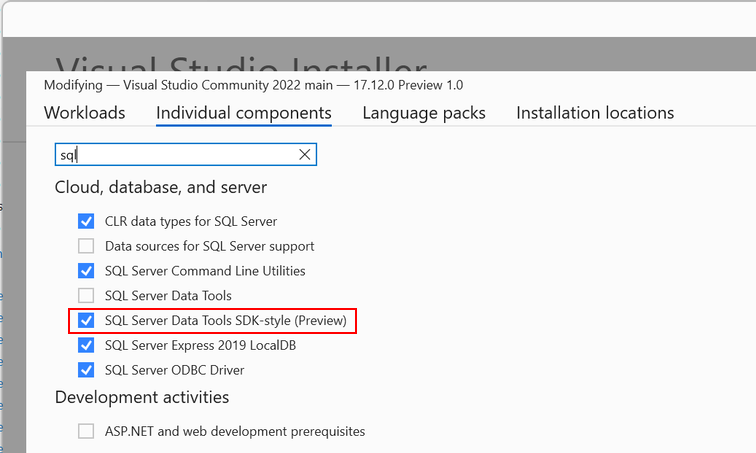
SDK-style SQL projects in SSDT 📣
You can now use the SDK-style project file format in your SQL Server Data Tools projects.
This update adds SQL projects based on the Microsoft.Build.Sql SDK, which brings cross-platform support and improved package references to SQL Server Data Tools (SSDT) projects. With less verbose project files and database references to NuGet packages, teams can more efficiently collaborate on large databases in a single project or compile multiple sets of objects from several projects.
Database deployments from a Microsoft.Build.Sql project can be automated in Windows and Linux environments where the Microsoft.SqlPackage dotnet tool publishes the build artifact (.dacpac) from the SQL project. Learn more about the preview of SDK-style SQL projects and DevOps for SQL.
The Microsoft.Build.Sql project SDK is open source and developed on GitHub.
Make sure to install the latest SSDT preview component in the Visual Studio installer to use the SDK-style SQL projects in your solution.
📣 See feature ticket to share your feedback and continue the conversation.
C++
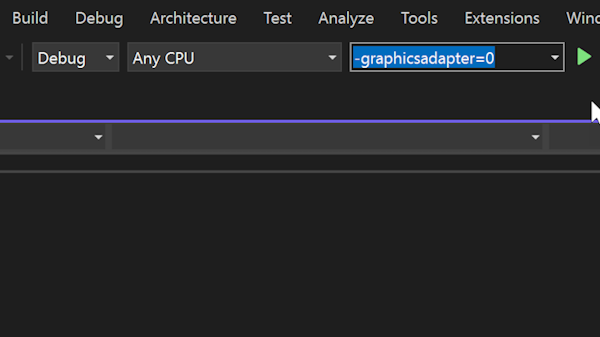
Set C++ Command Line Arguments
A new way to set your command line arguments right from the toolbar.
Quickly set your command line arguments for your C++ project with the new Set Arguments toolbar item. This combo box allows you to set your command line arguments right from the toolbar, so you can quickly change your arguments. When you run your project, any arguments entered in the box will be passed.
This toolbar component will show up by default if you have Game development with C++ workload installed. If you don't see it, you can add it by right-clicking on the toolbar and selecting Set Arguments.
Note: This feature is currently available for Unreal Engine projects only. General C++ projects will be supported in future releases.
Build Insights view explanations
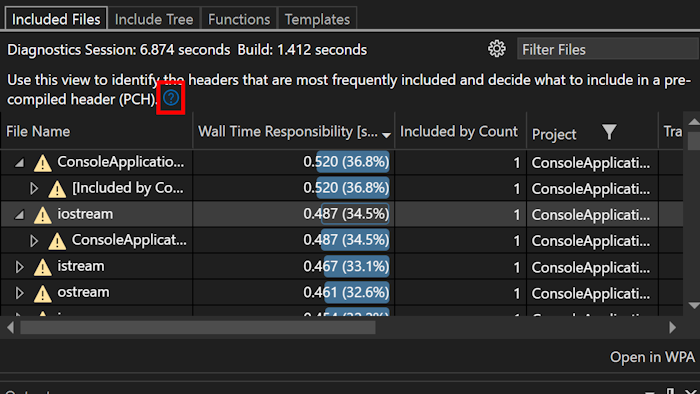
Learn how to use each tab of Build Insights via a newly added link to documentation.
You can now see a short description on how each tab of Build Insights can be used, along with a link to the documentation for a detailed explanation.
Build Insights path adjustments
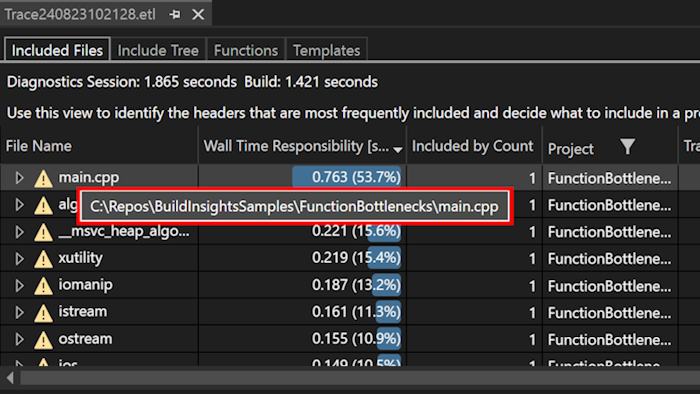
Get a clearer view of your file in Build Insights, see full path on hover.
We have hidden full and relative paths to reduce clutter. To see full paths, simply hover over the file. You will also see a new File Name column for both files and Translation Units, displayed by default to help you quickly identify files without parsing lengthy paths.
Open Folder for Unreal Engine uproject
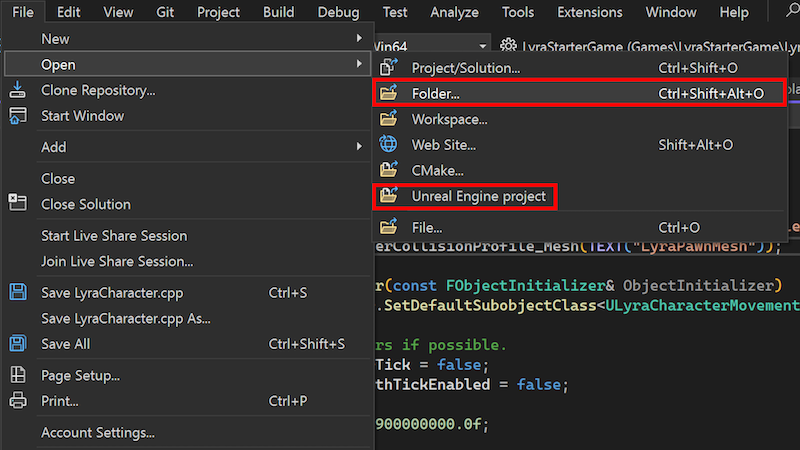
A new way of opening your uproject.
We have added an additional entry point to open your Unreal Engine uproject with Visual Studio's uproject support. You can now open your uproject directly from the File menu by selecting Open > Unreal Engine project.... This will open your Unreal Engine project in Visual Studio.
For more information on how to use this feature, see Directly Editing .uproject in Visual Studio.
Improved Change signature
You can now change signatures with our improved C++ interface.
We have updated the Change Signature interface for C++. You can now add, remove, and rearrange parameters in the parameter configuration section. Additionally, you can change their order by selecting and dragging them to a new position.
The access methods remain the same: press Ctrl+. to trigger the Quick Actions and Refactorings menu and select Change Signature.

Top user-reported bug fixes
- C# Editor cannot find controls defined in xaml file
- GIT command (sync, pull, push) and branch list missing from status bar
- VSSDK/CPS/Extensibility: Image Loading in VS Extensions via .imagemanifest is Broken in VS2022
- Backspace etc sometimes stop working
- Resource explorer cannot open resx files
- Reset all settings always results in an error
- VS2022 17.10.0 Preview 7: Internal compiler error
- Javascript Files Lose Color Coding after 10000 lines of code
- Using std::format in a module requires including format header in .cpp files using that module
- C++ Syntax Error after upgrading to Visual Studio 17.11.0
- Unable to Move a Block of Code Up and Down After VS Update
- CMake cache generation on a remote Linux host fails on a ctest query
- Error in Azure DevOps pipelines with VSTest@2
- Cannot add Apple account (VS 2022, Enterprise account)
📣 See the full list of all the user-reported bug fixes that made it into this release.
Known Issues
- "Failed exporting the certificate" error occurs when attempting to debug an ASP.NET Core web project with HTTPS enabled and using the WSL debug profile. This occurs due to Breaking change: dev cert export no longer creates folder.
This can be worked around by creating the
%appdata%\ASP.NET\Httpsfolder prior to debugging.
Version 17.12.3
Released December 3rd, 2024
| Top bug fixes | From the community |
|---|---|
| NuGet errors after upgrading from VS v17.11.6 to v17.12 with .NET 9. | Feedback ticket |
| Private Unity messages incorrectly marked as unused IDE0051. | Feedback ticket |
| Intellisense stopped working in Word C++ project. | Feedback ticket |
| Fixed an issue where characters might be duplicated when typing in a file containing an embedded language. | Feedback ticket |
| Fixed an issue in which resolving merge conflicts in .razor files and .cshtml files would result in an empty window. | Feedback ticket |
| Azure Devops Permalink from Visual Studio 2022 doesn't work. | Feedback ticket |
| Fixed an issue where Visual Studio would crash if the environment variable DOTNET_SYSTEM_GLOBALIZATION_INVARIANT was set to 1. | Feedback ticket |
| Fixed performance profiler start up error for C++ projects. | Feedback ticket |
Version 17.12.2
Released Novemeber 26th, 2024
| Top bug fixes | From the community |
|---|---|
| C++ IntelliSense no longer displays errors for projects that had working IntelliSense in Visual Studio 17.11. | Feedback ticket |
| The Copilot indexer process no longer locks files. | Feedback ticket |
| Fixed a compiler crash in C++/CLI code that targets .NET Core and uses param-arrays. | Feedback ticket |
| .NET for iOS/tvOS/macOS/macCatalyst release notes | |
| After Windows update KB5041580, Visual Studio crashes silently upon opening a merge editor window. | Feedback ticket |
| [LKG18] Some shrink-wrapped functions have incomplete unwind information in their secondary fragments. | Feedback ticket |
| Internal Compiler Error C1001 for arm64 build. | Feedback ticket |
| SSDT crashing with Critical Error Encountered in VS17.12. | Feedback ticket |
Version 17.12.1
Released Novemeber 19th, 2024
| Top bug fixes | From the community |
|---|---|
| Fixed the syntax color flicker issue while scrolling via https://github.com/dotnet/roslyn/pull/75796 | |
| This release includes updates to maintain compliance with international language laws. |
From all of us on the team, thank you for choosing Visual Studio. If you have any questions, please reach us on Twitter or Developer Community.
Happy coding!
The Visual Studio team
Note
This update may include new Microsoft or third-party software that is licensed separately, as set out in the 3rd Party Notices or in its accompanying license.
