Analyzing load test virtual user activity in the Details view of the Load Test Analyzer
Applies to: ![]() Visual Studio
Visual Studio ![]() Visual Studio for Mac
Visual Studio for Mac
Note
This article applies to Visual Studio 2017. If you're looking for the latest Visual Studio documentation, see Visual Studio documentation. We recommend upgrading to the latest version of Visual Studio. Download it here
Note
Web performance and load test functionality is deprecated. Visual Studio 2019 is the last version where web performance and load testing will be fully available. For more information, see the Cloud-based load testing service end of life blog post. To reduce the impact on users some minimum support is still available in Visual Studio 2022 Preview 3 or later. Users should also note web performance and load test functionality only supports Internet Explorer which is not available on Windows 11 and some versions of Windows 10. Read more on Internet Explorer Lifecycle policy.
Virtual User Activity Chart
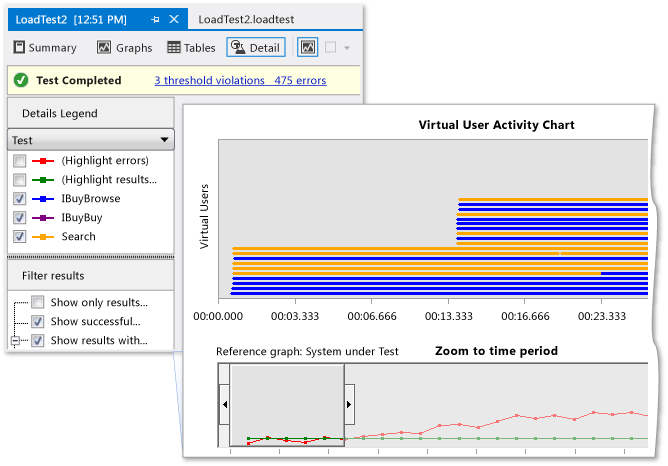
The Details view displays the Virtual User Activity Chart, which is used to visually analyze what the individual virtual users did during the load test. Virtual User Activity Chart lets you see patterns of user activity, load patterns, correlate failed or slow tests, and see requests with other virtual user activity. The Virtual User Activity Chart can also help you determine spikes in CPU usage, drops in requests per second, and what tests or pages were running during the spikes and drops.
Note
Before you run the load test for which you want to use the Virtual User Activity Details Chart, you must verify that the Timing Details Storage property is set to the AllIndividualDetails option by using the Load Performance Test Editor.
Details Legend Panel
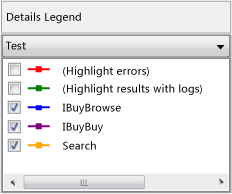
The details legend panel is visible in the Virtual User Activity Chart. The details legend pane lets you filter out tests, pages and transactions based on several different criteria. For example, you can remove certain tests from the view, or remove all successful tests, or remove tests which failed with certain failures. You can also remove all tests that do not have logs.
You can highlight tests which failed, which displays all failed tests colored in red. You can also highlight tests that have test logs. Tests with logs will be colored in green.
Filter results Panel
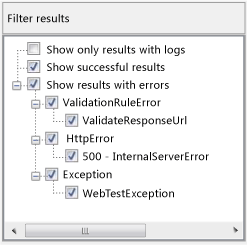
The Filter results panel is visible in the Virtual User Activity Chart. The Filter results panel can filter on the following:
Show only results with logs Displays only test results that have test logs associated with them.
Show successful results Displays successful results.
Show results with errors Displays results with errors that can help in debugging.
Tasks
| Tasks | Associated topics |
|---|---|
| Run your load test: After you have created a load test and configured it to enable virtual user activity data collecting, you must run the test until it is complete in order to view the Virtual User Activity Chart. | |
| View the load test results that contain the virtual user activity data: After your load test has been created, configured, and has completed running, you can view the virtual user activity data by using the Virtual User Activity Chart. | - Analyze load test results - How to: Analyze what virtual users are doing during a load test |