XAML data binding diagnostics
Developers who work on XAML projects often have to detect and resolve XAML data binding failures in their applications. Now there are tools within Visual Studio 2019 version 16.8 or later and Visual Studio 2022 to help find these annoying data binding failures while you debug your application. Examples of common binding failures are as follows:
- Binding to a property name that doesn't exist:
{Binding Wrong.Name} - Binding to a value of the wrong type, like binding to a Boolean when an enumeration is required:
Visibility="{Binding IsVisible}"
Because these bindings are computed at runtime by using reflection, the XAML editor isn't always able to catch them, and your build will still succeed. The failure happens only at runtime.
XAML data binding is explained in these articles:
- For WPF: Data binding overview - WPF .NET
- For UWP: Data binding overview - UWP applications
- For Xamarin.Forms: Xamarin.Forms Data Binding - Xamarin
Binding failures have always been written to the debug output window in Visual Studio. But it’s easy to miss the binding failures within debug output since it contains other debugging information that scrolls binding failures out of view. Here's an example of a WPF binding failure within the debug output window:

The binding failure might be hundreds of lines off the top of the window, and the text doesn't tell you exactly which binding had the failure, so you need to think about it and search.
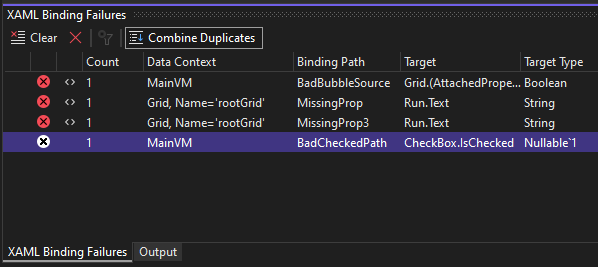
Now, with the XAML Binding Failures tool window, you can clearly see which bindings have failed, along with relevant data for each failure, such as the file location within XAML. Plus, there are many useful features for investigating the failures by searching, sorting, and even opening the XAML editor with focus set on the failed binding.

Double-clicking those rows opens the source XAML for the binding, as shown in the following image:

XAML Binding Failures tool window
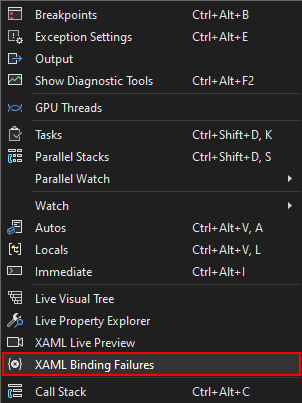
The XAML Binding Failures tool window is available during debugging. To open it, go to Debug > Windows > XAML Binding Failures.
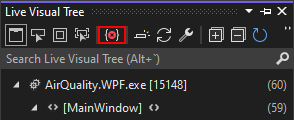
Or, select the Binding failures button in the application toolbar. The number next to the icon shows how many binding failures are shown in the tool window.

When there are no binding failures in the tool window, the icon shows as gray without a number next to it. This is helpful while running your application. If you see the icon turn red with a number, click it to quickly jump to the tool window to see what binding failures occurred. There's no need to keep an eye on the Visual Studio tool windows. When a binding fails the icon will tell you right away.

A similar icon also appears in the Live Visual Tree tool window.
The following is a description of all components of the XAML Binding Failures tool window.

- The toolbar at the top contains buttons as follows:
- Clear the list of failures: This is useful if you're about to show a new page in your app and want to see if any binding failures show up. When you start a new debugging session, the list is automatically cleared.
- Delete selected rows: If a failure has been fixed or isn't relevant, you can delete it from the list. Deleted rows will show up again if the binding fails again.
- Clear all filters: If there are any filters on the list, such as searching for text, then this button will clear them and show the full list.
- Combine Duplicates: Often the same binding will fail many times in a row when it is within an item template. When the Combine Duplicates button is selected (with an outline around it) then all duplicate failures are shown as a single row. The Count column will show how many times the failure occurred.
- The Search Binding Failures box in the top corner lets you filter the failures to only those that contain specific text.
- The table columns, in order, show:
- An icon that shows if the row is for an error or warning.
- An icon that shows angle brackets
<>if navigating to the failed{Binding}in XAML is supported. See the Supported Platforms section. - Data Context: This is the type name for the binding’s source object
- See Binding.Source
- Binding Path: This is the property path for the binding
- See Binding.Path
- Target: This is the type and property name where the binding’s value will be set.
- Target Type: This is the expected type of the binding’s target property.
- Description: This column contains more information about what exactly failed for the binding.
- File, Line, and Project: If known, this is the location in XAML where the binding is defined.
- Right-clicking a row or multiple selected rows will show a context menu, with standard options for showing/hiding columns or grouping them. Other options are as follows:
- Copy all the text from a row or just a single column to the clipboard.
- Copy Original Error will copy the text that appeared in the debug output window.
- View Source will go to the binding source in XAML for one selected row.
- Reset Columns will undo all changes to column visibility and sorting, getting you back quickly to what was originally shown.
To sort the list, click any column header. To sort again by an extra column, hold down the Shift key and click another column header. To select which columns are displayed and which are hidden, choose Show Columns from the shortcut menu. To change the order in which columns are displayed, drag any column header to the left or right.
After you double-click a row or press Enter to navigation to the source, you can press F8 or Shift+F8 to move down or up through the list of binding failures. This is like other panes in Visual Studio that show a list.
Supported platforms
Most XAML platforms are supported if binding failures are written to debug output. Some platforms supply extra source information to the debugger that allows navigating to the source.
| Platform | Supported | Navigate to source supported |
|---|---|---|
| WPF .NET Framework | Yes | No |
| WPF .NET 5.0 RC2+ | Yes | Yes |
| UWP | Yes | No |
| WinUI3 desktop | Yes | No |
| MAUI (Multi-platform App UI) | Yes | No |
| Xamarin 4.5.0.266-pre3+ | Yes | Yes |
| Xamarin before 4.5.0.266-pre3 | No | No |
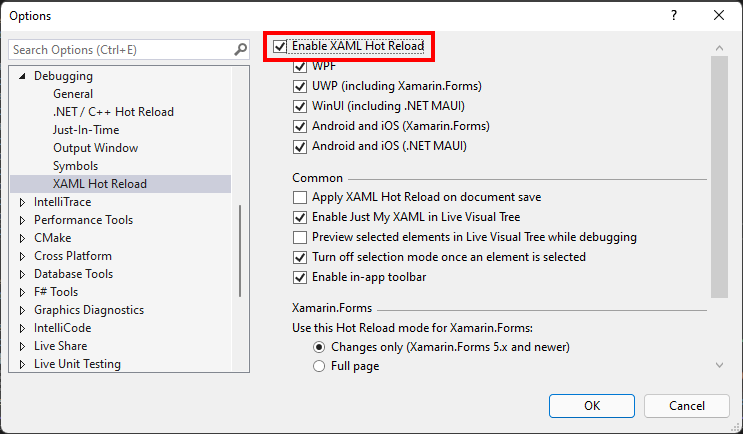
The XAML Hot Reload option must be enabled in Visual Studio for navigating to source to work. This option is in the Tools > Options > Debugging dialog:
Navigating to source only works for bindings defined in XAML source files, not if they're created through code. You can clearly see which rows support navigating to the source. If there's no angle bracket icon in the second column, then navigating to source isn't supported, such as with the highlighted row in the following screenshot:
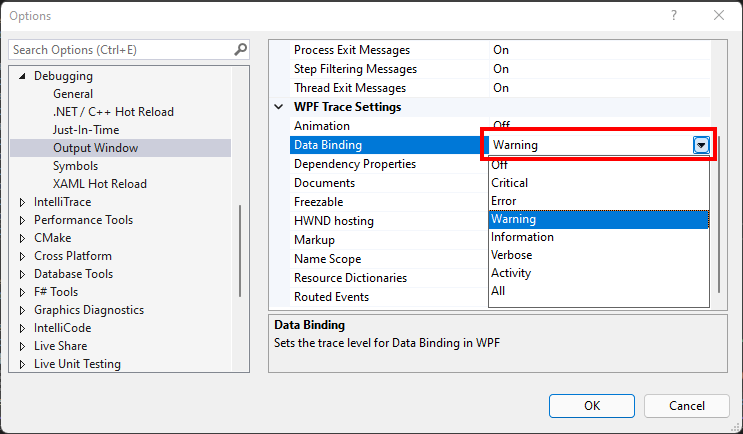
For WPF in .NET Framework, data binding failures must be shown in the debug output for the XAML Binding Failures pane to detect and show them. The option for this is in the Tools > Options > Debugging > Output Window > WPF Trace Settings dialog. If the setting is either Off or Critical, then data binding errors aren't written to debug output and can't be detected. With WPF in .NET 5, .NET 6, and later the data binding output setting doesn't affect the failure list.
Related content
Feedback
Coming soon: Throughout 2024 we will be phasing out GitHub Issues as the feedback mechanism for content and replacing it with a new feedback system. For more information see: https://aka.ms/ContentUserFeedback.
Submit and view feedback for