Queries with CRM data
Important
This article is for the legacy Workplace Analytics app and does not reflect functionality available on the updated Viva Insights platform. Access current documentation for Viva Insights advanced insights here: advanced insights documentation.
After you've successfully uploaded and processed your company’s Customer Relationship Management (CRM) data in Microsoft Viva Insights, you can use person, person-to-group, and group-to-group queries to do combined organizational and CRM data analysis, such as:
- Analyze the time your sales or other teams spent with accounts and the network size for accounts as defined in your CRM. (Today you can get time spent and network size by using specific domains.)
- Analyze collaboration data with CRM contacts and filter or group by any CRM account attribute you choose to upload, such as account tier, account geography, or account revenue potential.
- Analyze collaboration data with CRM contacts and filter by any CRM contact attribute you choose to upload, such as contact level, contact function, or contact location.
Person queries
Person queries in Viva Insights help you understand how an individual invests their time with your CRM contacts and accounts. The query results list individuals ("Persons") by their PersonIDs (de-identified), one or more metrics that you define in the query (such as Meetings or Emails sent) that can be filtered by the Participant CRM account attribute.
For example, if CRM data is available, you could analyze meeting metrics (hours) for each sales team member for meetings with at least one participant who is a Contact whose Account has AccountRevenue greater than one hundred thousand dollars. Then compare these results to the total meeting hours for meetings with internal participants only. By comparing the two customized meeting hours metrics shows the time allocation of each salesperson.
To learn more on how to create Person queries and filter metrics by organizational data, see Person queries.
Person-to-group queries
Person-to-group queries in Viva Insights help you understand how an individual invests their time with your CRM contacts and accounts. The query results list individuals ("time investors") by their PersonIDs (de-identified), one or more groups that you define in the query ("their collaborators"), and the amount of time that the time investor spends with the groups that you define.
To learn more about time allocation, general information about, and step-by-step instructions on how to create these queries, see Person-to-group queries.
Group-to-group queries
Group-to-group queries in Viva Insights give results that help you understand how a team invested their time with CRM accounts and contacts. The query results list pairs of groups, as defined by the organizational and CRM attributes that you choose, along with how much time people in the first group (the "time investors") allocated to other groups ("collaborators").
For example, if CRM data is available, you could analyze how much time each sales person (FunctionType equals Sales) spent with platinum-tier customers (CRM AccountTier equals Platinum).
To learn general information about and step-by-step instructions on how to create these queries, see Group-to-group queries.
Data analysis options
After you successfully upload and process CRM data in Viva Insights, the following additional options are available for person, person-to-group, or group-to-group queries.
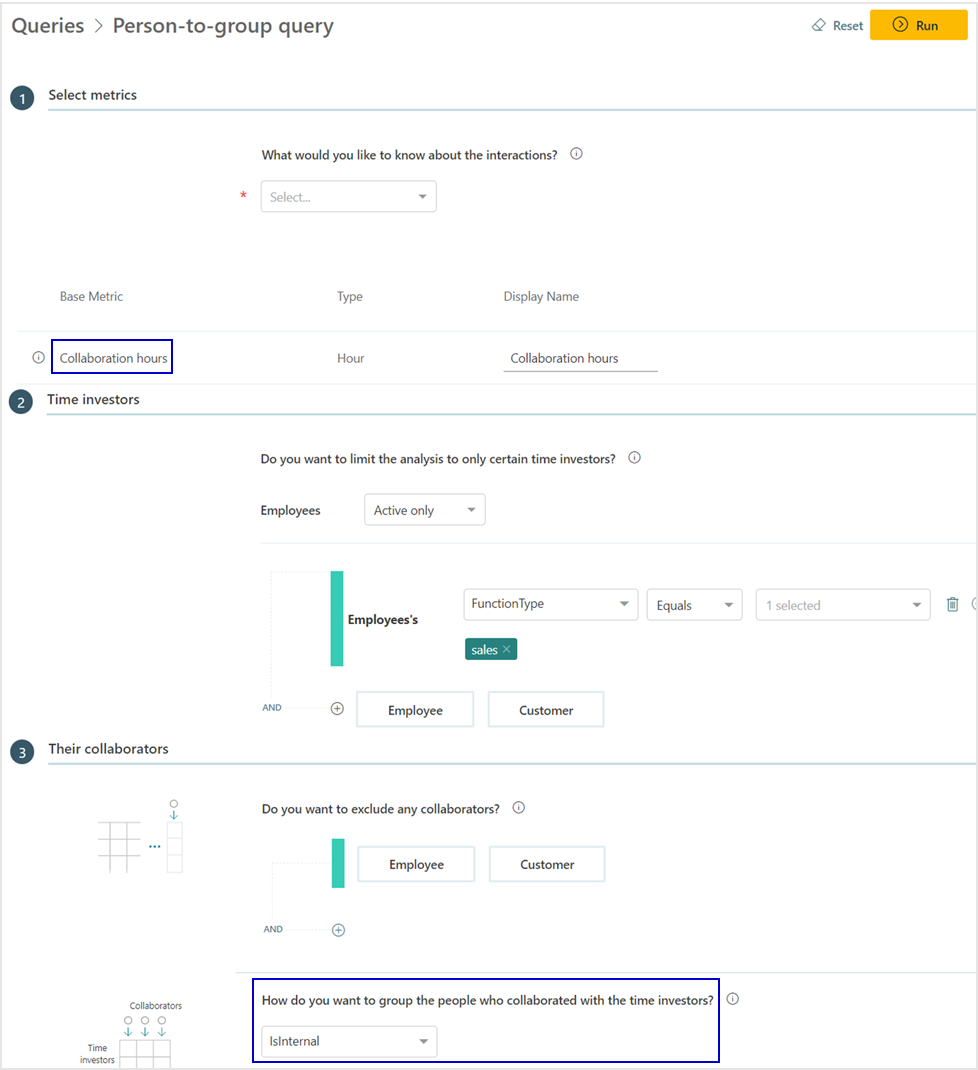
In the Time investors section, you can optionally filter to include specific time investors based on their HR attributes. Assuming you have uploaded the seller to account mapping table and completed the account owner fields, you can also filter specific time investors based on account attributes for the accounts they own or have been assigned.
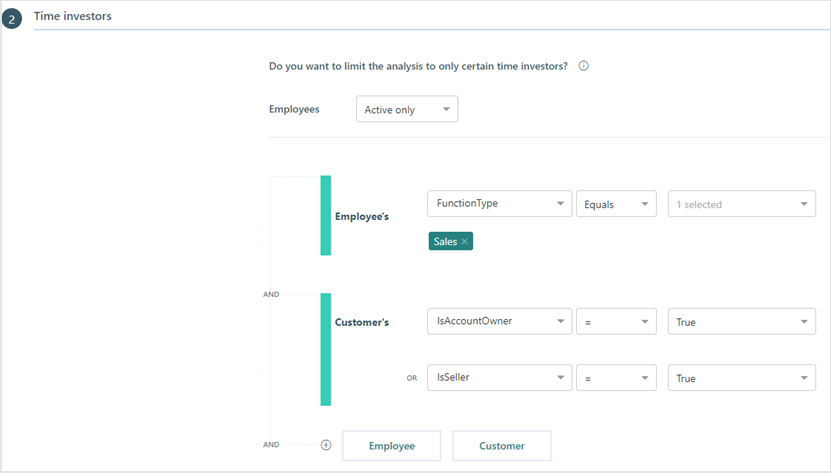
If you mapped your CRM seller and account data to account owners during the upload process, you can filter sellers or sales teams based on account attributes for the accounts they are assigned in the Time investors section.
For example, the following graphic shows an employee filter of FunctionType > Equals > Sales and customer filters of IsAccountOwner or IsSeller > Equals > True, which will include query results for employee time investors in Sales who are also account owners.
At this point, the collaborators are not grouped yet. In the Their collaborators section, answer the following questions to select which collaborators interacted with the selected time investors.
- Do you want to exclude any collaborators? - Use this to add customer attributes to exclude groups or group collaborators by specific attributes, such as Accounts or AccountName.
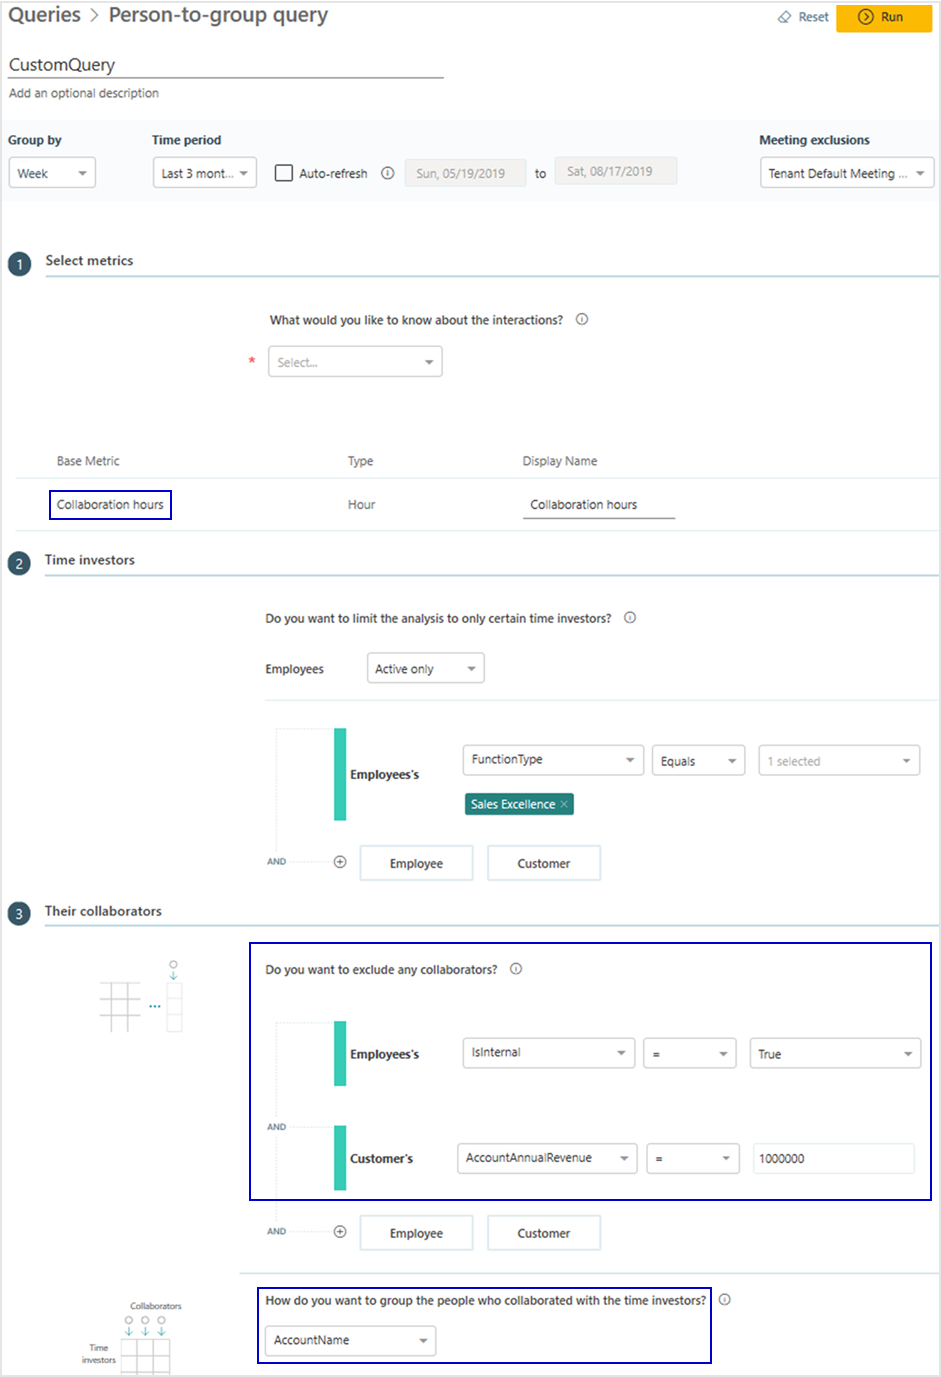
For example, the following graphic shows a customer filter of AccountAnnualRevenue less than 1000, which will exclude customers with less than that amount of annual revenue from the query results.
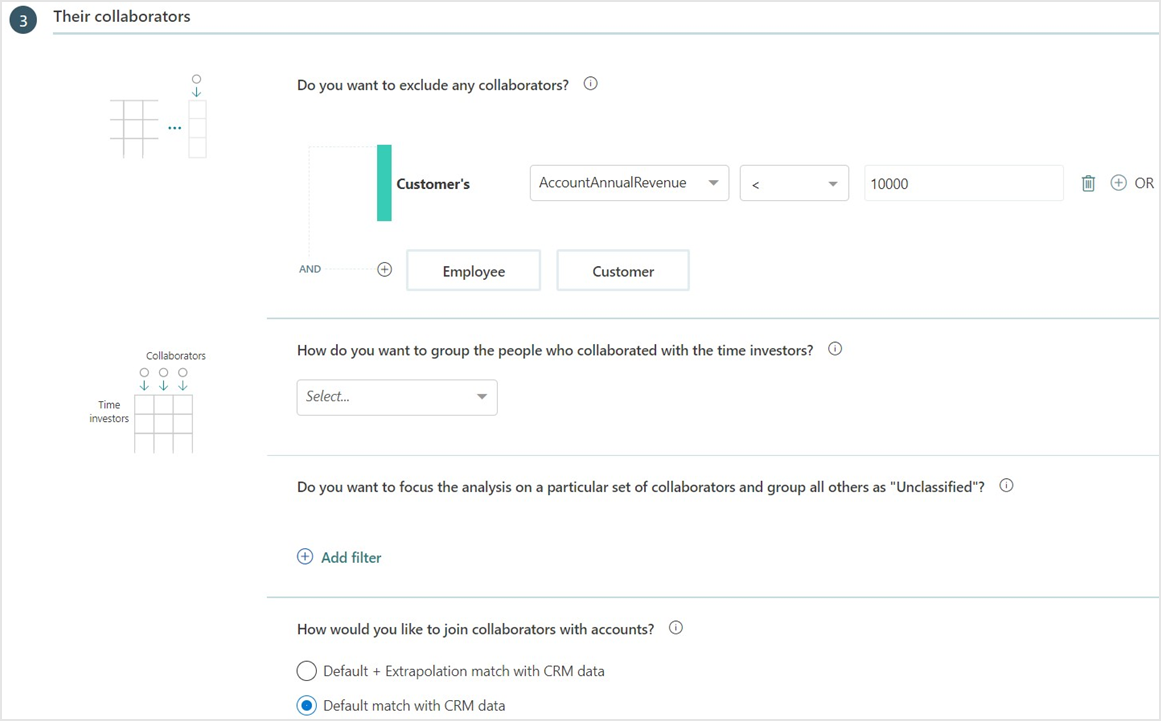
How do you want to group the people who collaborate with the time investor? - Use this to group the collaborators to analyze which groups interacted with the time investors.
Do you want to focus the analysis on a particular set of collaborators and group all others as "Unclassified"? - Use this to combine groups of collaborators for the purpose of isolating other specific groups who interacted with the time investors.
When you select a CRM group-by attribute or filter, for Person queries, you're asked: How would you like to join collaborators with accounts? Or for Person-to-group or Group-to-group queries, you're asked: How would you like to join external collaborators with accounts? The following options are the same for either question:
- Default match with CRM data - This option only uses the imported data from the CRM upload to match up email addresses for Microsoft 365 external collaborators with email addresses for CRM contacts.
- Default + Extrapolation match with CRM data - This is the preferred, default option, because it enables more coverage for external collaborators and for capturing more customer interactions. It does the same email comparison as the other option. However, for any unmatched external collaborators, it then calculates the probability of which CRM account they most likely match up with. If the probability that an external collaborator belongs to a specific CRM account is high, that external collaborator is assigned to that account.
Sample query output with CRM data
The following graphic shows example CRM data that you might see in the output .csv file.
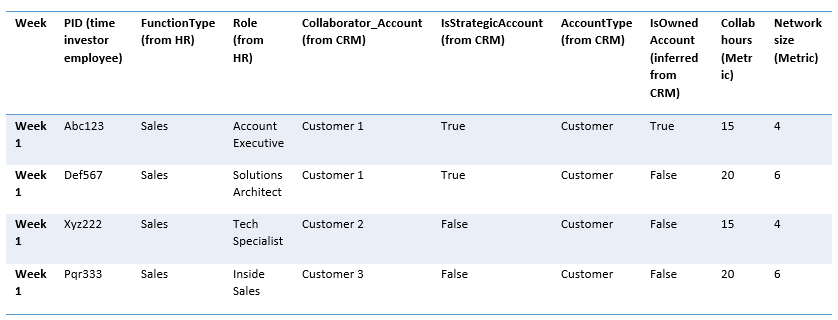
This output includes the following, which enables you to perform even further grouping for more advanced data analysis.
- Week - The number of the week that the person that meets the time investor filter criteria collaborated with the customer.
- PID - De-identified PersonIDs for each measured employee that meets the time investor filter criteria.
- Other HR attributes - Only shows those that are allowed to show in the report for these measured employees, such as FunctionType and Role.
- Collaborator Account - Shows customer account names based on the collaborators group attributes.
- Account attributes - Shows each collaborator account's attributes, such as IsStrategicAccount.
- IsOwnedAccount - If the measured employee is indicated as a seller for that account through the account and seller mappings in your CRM upload, it infers if the account is assigned or owned by a person that meets the time investor filter criteria.
- Other applicable metrics - Are based on the attributes selected when creating the query, such as collaboration hours and network size.
Analysis scenarios
The following business scenarios are a few of the ways you can use Viva Insights queries to analyze combined CRM and Organizational data.
Analysis 1 - Sellers' prioritization of accounts by value is misaligned
To evaluate prioritization of accounts, you can correlate sellers’ time with specific accounts and their value potential, as shown in the following graphic.
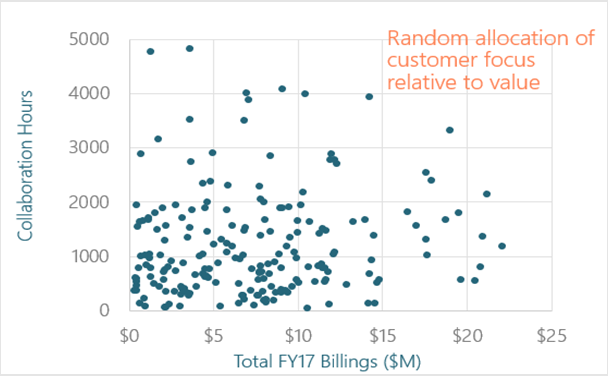
To see this correlation, you can create a query as shown in the following graphic to look at the time investment with customers as compared to their annual revenue, which can highlight any misalignments in prioritization at an account level. This can show where high-value accounts might not be getting enough attention or low-value accounts might be demanding too much time from sellers.
Analysis 2 - Sellers need to improve their customer networks
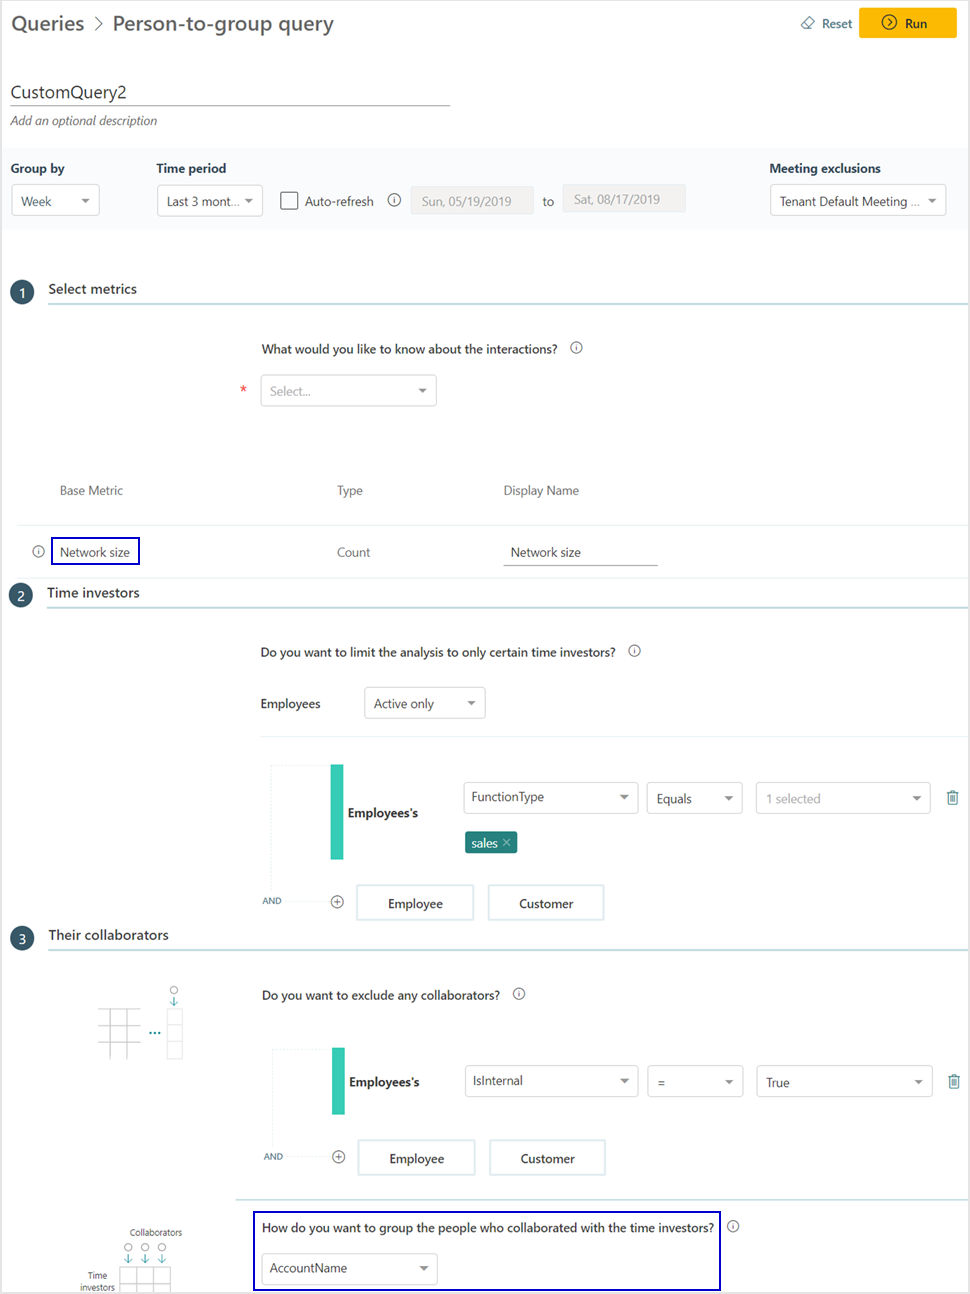
You need to compare the number of connections with customers, as well as the connections with each account, as shown in the following graphic. These connections indicate the depth of involvement with customer accounts.
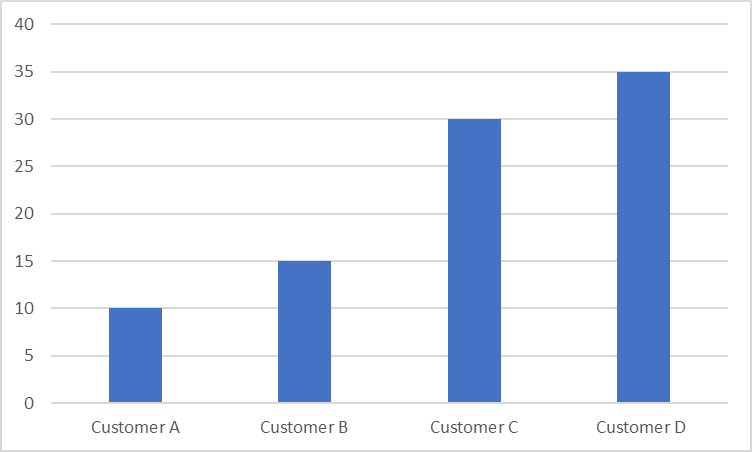
In complex sales solutions, it's the intimate connections with customers that drive success when compared to the total time spent with customers. By expanding their network within customer accounts, sellers can learn more relevant issues and present more compelling sales solutions to their customers. Create a query as shown in the following graphic for your analysis.
Analysis 3 - Sellers have limited customer focus relative to internal demands
You can analyze how the different sales roles spent time as compared to time spent focusing on customers. Complex internal processes can limit the ability to spend more time with customers.
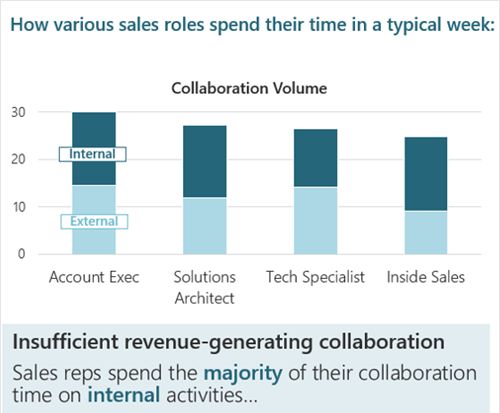
To do this, you can create a query as shown in the following graphic to analyze the ratio of customer hours to internal-only hours and evaluate how much time a seller is spending on internal and external collaborators.