Return to worksites
Important
This article is for the legacy Workplace Analytics app and does not reflect functionality available on the updated Viva Insights platform. Access current documentation for Viva Insights advanced insights here: advanced insights documentation.
The Return to worksites dashboard uses a template that’s populated by Viva Insights data to help you determine how to allocate limited-capacity seats to employees (who work at desks) for each of your organization's worksites.
As worksites begin opening at limited capacity to address safety concerns, employee seats become a limited resource. This dashboard helps you make the most of the limited seats by optimizing for on-site collaboration. The two allocation plans identify teams or a subset of teams who will benefit the most by returning to work because of their high collaboration patterns with others in the same location.
While this dashboard can help with planning, you must consider it in combination with other key factors, such as the nature of the work and individual employee circumstances and preferences.
The dashboard includes the following reports to help you allocate worksite seating:
- Which teams collaborate the most with others in the worksite? – Shows how teams have collaborated on-site as compared with off-site collaboration, where you can evaluate relationships across the organization or use a filter to evaluate a specific location. This view is the basis for the two alternative plans for seating allocation in the dashboard. With either plan, team leaders must account for personal circumstances of individual team members and their ability to return to work when determining how to allocate available workspaces.
- Plan 1: Allocate seats to the teams with the most on-site collaboration – This allocation plan identifies which teams should return to work based on the selected location and limited-seating capacity. This plan simplifies a leader’s decision by making it an all-or-nothing seat allocation for each team. However, if on-site leadership requires all teams have some worksite presence during a limited-seat capacity opening, then Plan 2 is a better option.
- Plan 2: Allocate seats across teams in proportion to on-site collaboration – This option provides each team with some presence in a limited-capacity worksite. It allocates each team a proportionate number of seats based on the team’s on-site collaboration patterns and the limited-seat capacity for the selected location. If leadership prefer the all-or-nothing approach, then Plan 1 is a better option.
To populate the dashboard in Power BI, you must set up and successfully run the predefined Return to worksites query in the advanced insights app. After the query successfully runs, you can download the template for the Return to worksites query on the Results page. This template is required to create the dashboard in Power BI. After the template is downloaded, you need to connect the query data from the advanced insights app to the dashboard in Power BI.
After the dashboard populates with data, you can evaluate which of the two seat-allocation plans will work for your organization’s teams.
Demonstration
This uses sample data that is only representative of the dashboard and might not be exactly what you see in a live dashboard specific to your organization's unique data.
To find the template for the Return to worksites dashboard, go to the Query designer. (If that link doesn't work, try this link instead.) For complete steps, see Set up the dashboard.
Prerequisites
Before you can run the setup steps and populate the dashboard in Power BI, you must:
Be assigned the role of Analyst in the advanced insights app.
Have the latest version of Power BI Desktop installed. If you have an earlier version of Power BI installed, uninstall it before installing the new version. Then go to Get Power BI Desktop to download and install the latest version.
Have the following organizational attributes already uploaded and processed in the advanced insights app.
- Worksite location - Represents the most recent worksite location (or projected location) for each employee.
- Team or Organization - Each employee’s team assignment that reflects the organizational level at which decisions for seat allocation can be made for each worksite.
Set up the dashboard
Note
This dashboard is currently only available in English and will only work with data generated from the English version of the app. Before running the required queries, confirm the browser language in the app's URL includes en-us, or change it to include en-us: ...office.com/en-us/...
In the app(if that link doesn't work, try this link instead), select Analyze > Query designer.
In Create > Other templates, select Return to worksites to see the required setup steps, and then in step 2, select Set up next to Return to worksites.
When prompted, select or confirm the following settings:
- Name - Customize or keep the default name
- Group by - Week
- Time period - Last 3 months
- Auto-refresh - Keep this setting disabled
- Meeting exclusions - Select the preferred rule for your tenant
Important
The dashboard is designed to allocate worksite seats by team based on the current organizational structure. For best results, select Last 3 months for the Time period to reflect the most current organizational structure.
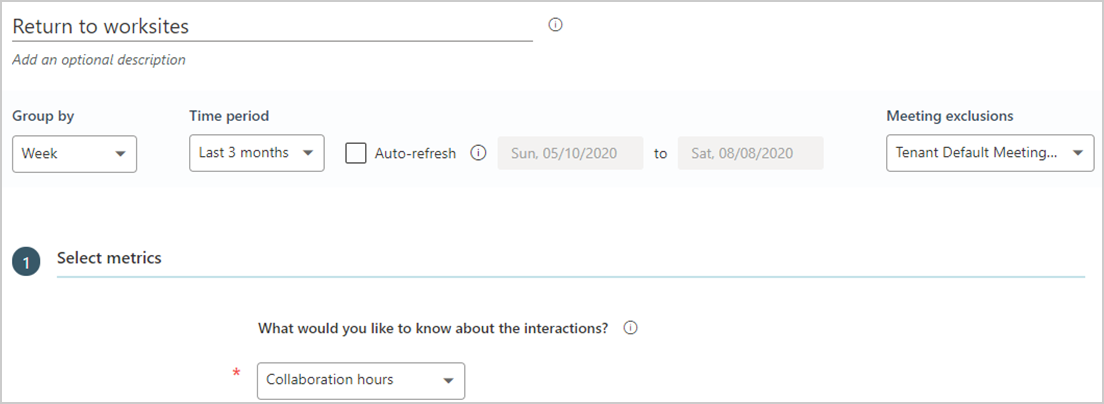
In Select metrics, keep Collaboration hours selected, and then do not add any additional metrics or the template will not load correctly.
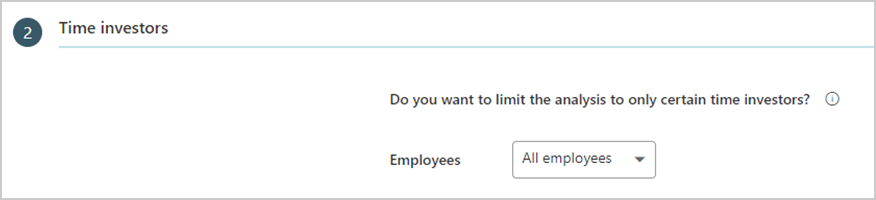
In Time investors > Do you want to limit the analysis to only certain time investors?, keep All employees selected. Optionally, you can further filter the employees in scope for the dashboard. For example, excluding contractors or essential workers who already have seats allocated at a worksite. For more details about filter and metric options, see Create a Person Query.
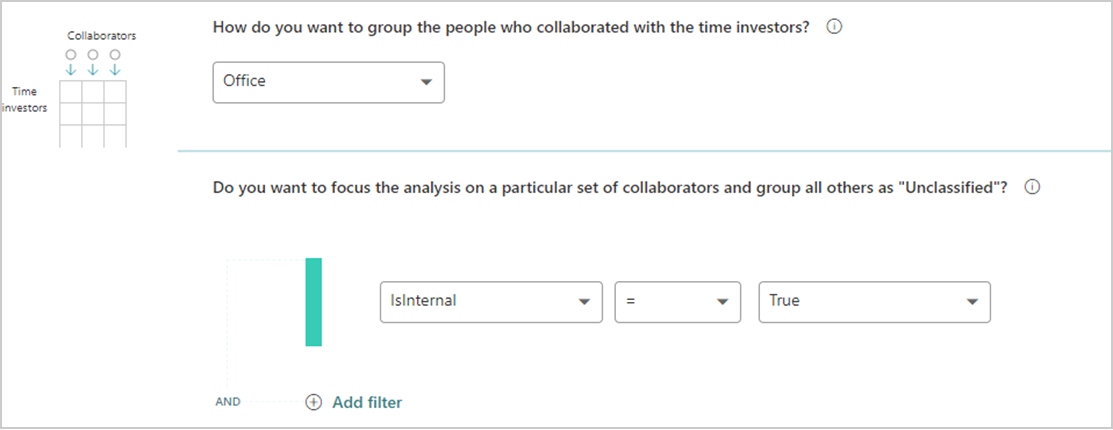
In Their Collaborators, do not exclude any collaborators.
For the How do you want to group the people who collaborated with the time investor? question, select the organizational attribute that represents the employee’s worksite location, such as Office or Building.
Important
The dashboard is designed to allocate worksite seats based on the amount of on-site collaboration time. If the worksite location is not selected, you might disable one or more Power BI charts.
For the Do you want to focus the analysis on a particular set of collaborators and group all others as Unclassified? question, keep the preselected filter as IsInternal equal to True.
In Organizational data, keep the preselected Organization and LevelDesignation attributes, and add the organizational attributes that reflect the worksite locations and applicable Teams (or Organizations) requiring seat allocation.
Important
You must include the organizational attribute selected in Step 7 for worksite locations or the data won’t load correctly in Power BI.
Select Run to run the query, which can take a few minutes up to a few hours to complete.
When prompted, select to go to Results. After the results successfully run, select the Download icon for the Return to worksites results, select PBI template, and then select OK to download the template.
Open the downloaded Return to worksites template.
If prompted to select a program, select Power BI.
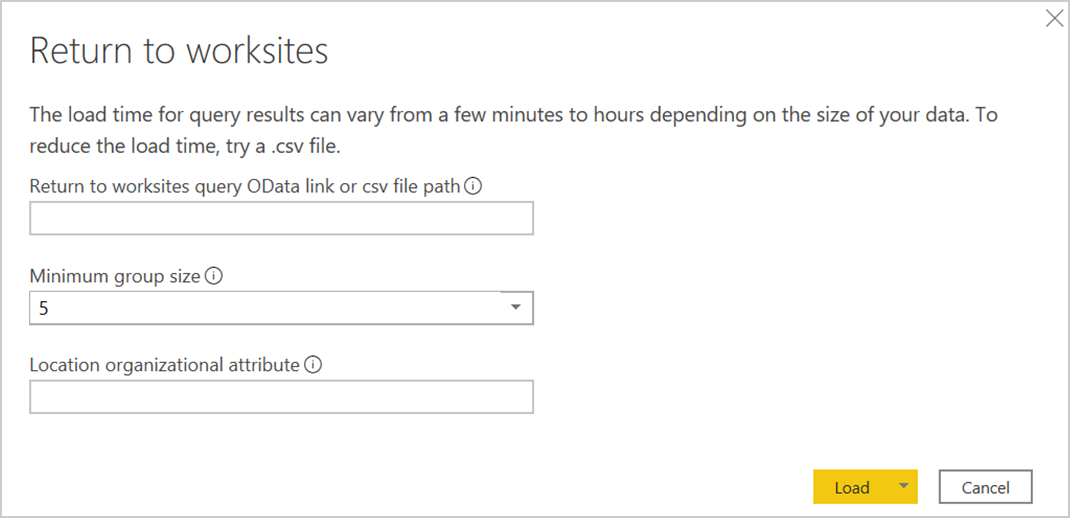
When prompted by Power BI, enter the following, and then select Load to import the query results into Power BI.
Query OData link or file path - Both options are in Query designer > Results > Return to worksites. Data from the .csv file will load faster than through the OData link, which can take several minutes to several hours to load.
- For the link, select the Link icon, and then select to copy the generated OData URL link and paste it in.
- For the file path, select the Download icon, and then download the file. After it downloads, copy and paste the file path and file name.
Minimum group size - Enter a number for data aggregation within this report's visualizations that complies with your company's policy for viewing Viva Insights data.
Location organizational attribute - Enter the case-sensitive name of the organizational attribute you selected in the Return to worksites query that represents the worksite locations.
If you're already signed in to Power BI with your Viva Insights organizational account, the dashboard visualizations will populate with your data. You are done and can skip the following steps. If not, proceed to the next step.
If you're not signed in to Power BI, or if an error occurs when updating the data, sign in to your organizational account again. In the OData feed dialog box, select Organizational account, and then select Sign in. See Troubleshooting for more details.
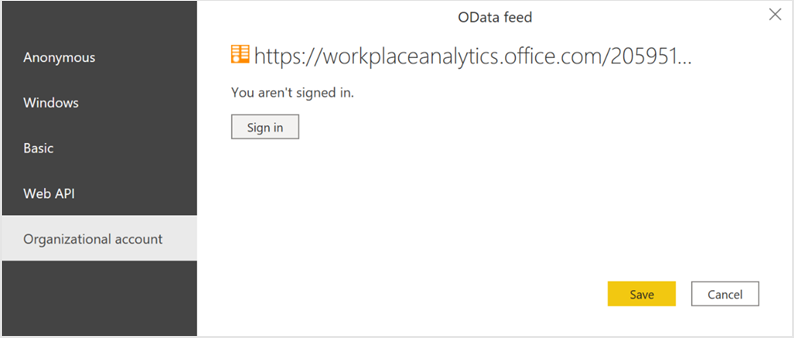
Select and enter credentials for the organizational account that you use to sign in to the advanced insights app, and then select Save.
Important
You must sign in to Power BI with the same account you use to access Viva Insights.
Select Connect to prepare and load the data, which can take a few minutes to complete.
Dashboard settings
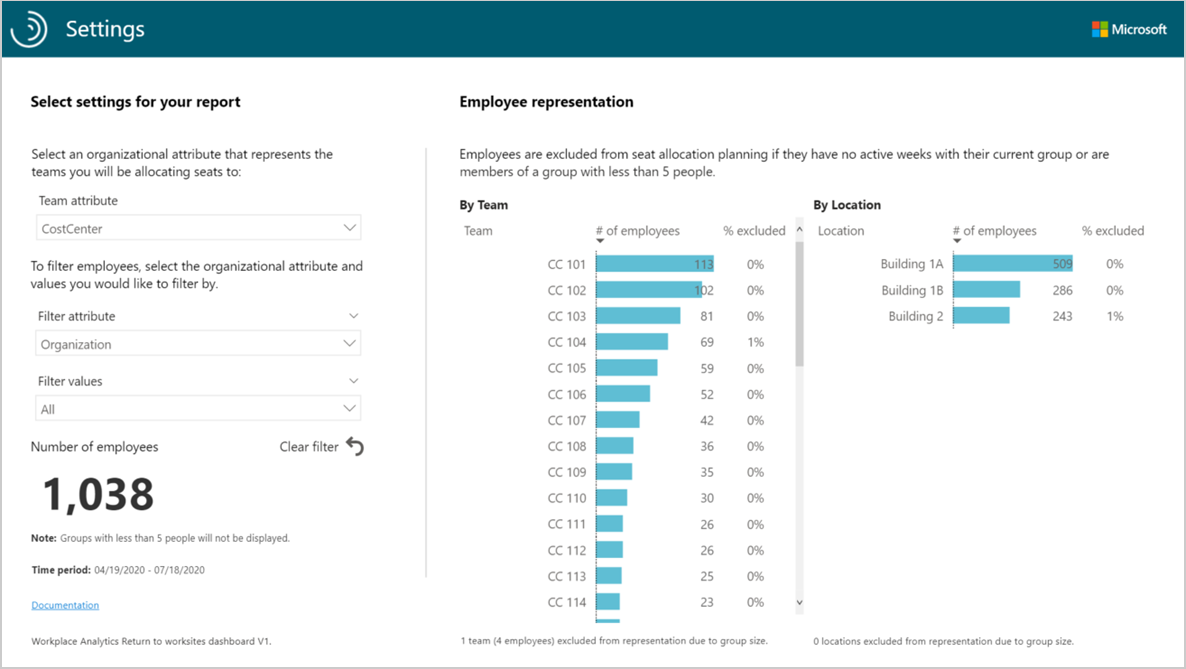
After the Return to worksites dashboard is set up and populated with Viva Insights data in Power BI, as a first step to viewing data in the dashboard, view and set the following parameters on the Settings page.
- Team attribute - The primary “group-by” attribute that represents the teams shown in all subsequent reports for making your seat allocation plan. You can change this attribute at any time and all subsequent report pages will show group values by the new attribute.
- Filter attribute – To filter the employee population, you can filter by any selected Organizational attribute, and then filter by any of the values for these attributes. If you filter, the employee count will reflect a reduced number. To clear an existing filter, select Ctrl while clicking the Clear filter arrow (or with a touchscreen, select the Clear filter arrow). This reflects the number of employees in the filtered population for the time period, that's specified on this page.
- Number of employees – Confirm that the number of employees meets your expectations.
- Employee representation – Shows the Number of employees divided into the different teams, which is based on the Team attribute selected on the left, and by location, which is based on the Organizational attribute selected for worksite locations in the query. In addition to employee count, the percent excluded statistic indicates what percentage of each team in the specified location has no active weeks of collaboration in their most recent role (as specified in the organizational data), or are in a group with less than the specified minimum number of employees.
Important
- If a worksite already has essential workers with permanent seat assignments, or employees who have chosen not to return, you must filter them out of the seat allocation plan. Use the filter attribute or re-run the Return to worksites query and use filters for the Time investors in Step 5.
- A high value for % excluded, such as greater than 50 percent, might suggest a group who has recently experienced organizational changes, which can cause their data to be less reliable for developing a seat allocation plan.
Tip
When you select a chart bar for Teams, it updates the data to show that team’s Location. Select a chart bar for Location and it will update the data to that location’s Teams.
Seat allocation plans
For either seat allocation plan, you’ll need the following information.
- The number of employees permitted in each location.
- The number of essential employees who are returning regardless of other factors. To account for essential employees, filter them out of your employee population and subtract their number from the total employees permitted in each location.
After you specify a location and the number of employees permitted in that location, each plan allocates and assigns seats to teams who spend more time in on-site collaboration. Each plan summary provides an estimate of the on-site collaboration. These estimates factor in adjustments to on-site collaboration based on the proportion of employees who are not assigned a seat.
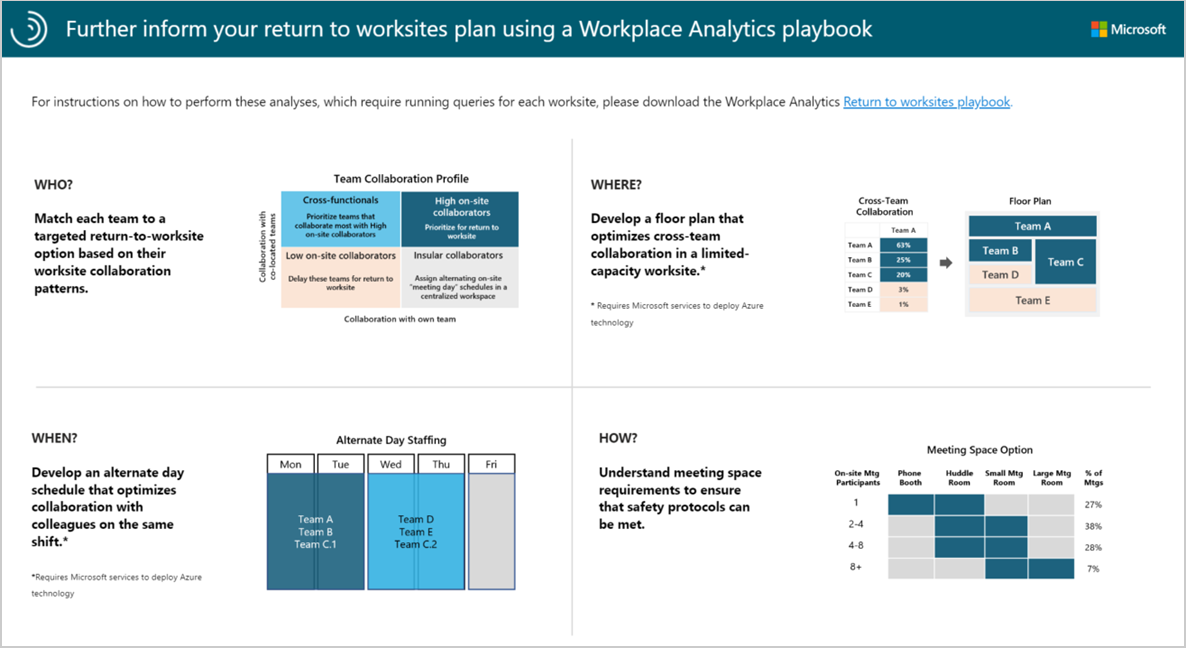
Return to Worksites Playbook
The last report in the Return to worksites dashboard describes further analysis you can do for planning when, who, where, and how employees can return to work. The Return to worksites playbook has more details and instructions on how to create and use the analysis.
Power BI tips, FAQ, and troubleshooting
For details about how to share the dashboard and other Power BI tips, troubleshoot any issues, or review the FAQ, see Power BI tips, FAQ, and troubleshooting.