Training
Module
Build data models in finance and operations apps - Training
Explore how to define, create, and manage tables in finance apps using Visual Studio for efficient data handling and development.
This browser is no longer supported.
Upgrade to Microsoft Edge to take advantage of the latest features, security updates, and technical support.
This section describes how to work with the data model menu in the WinDbg debugger.
Use the New Model Query dialog to create a new model query. You can put anything here you'd put into a normal dx command.
For example, specify Debugger.Sessions to examine the debugger sessions objects.

For general information about the debugger objects refer to dx (Display Debugger Object Model Expression).
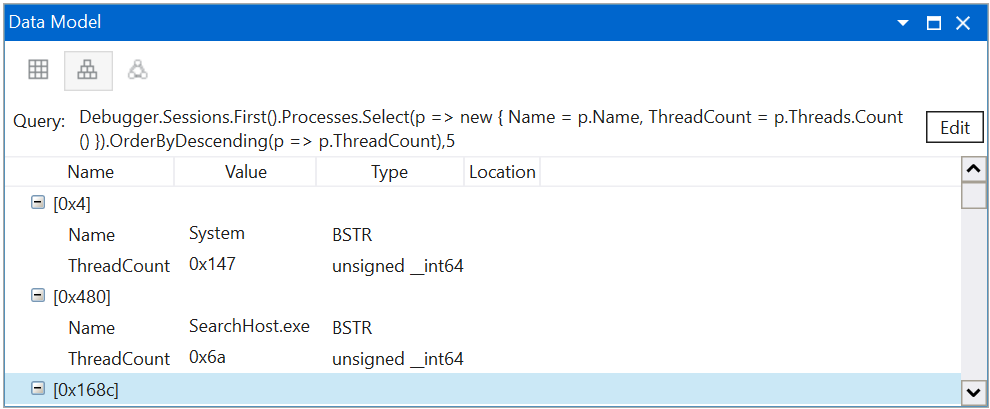
Use LINQ queries to dig deeper into the session. This query shows the top 5 processes running the most threads.
Debugger.Sessions.First().Processes.Select(p => new { Name = p.Name, ThreadCount = p.Threads.Count() }).OrderByDescending(p => p.ThreadCount),5
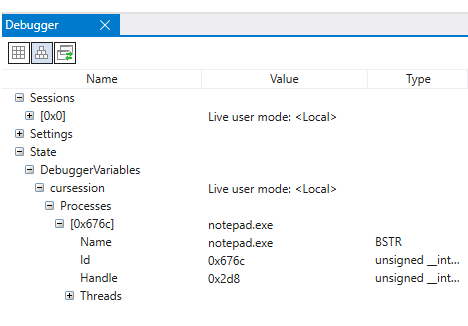
Use the data model explorer to quickly browse every data model object in the Debugger namespace.
Use display mode to toggle between grid and hierarchy display mode. You can right-click column headers to hide or show more columns.
Grid mode can be useful to dig down in the objects. For example, here is the previous top threads query in grid view.
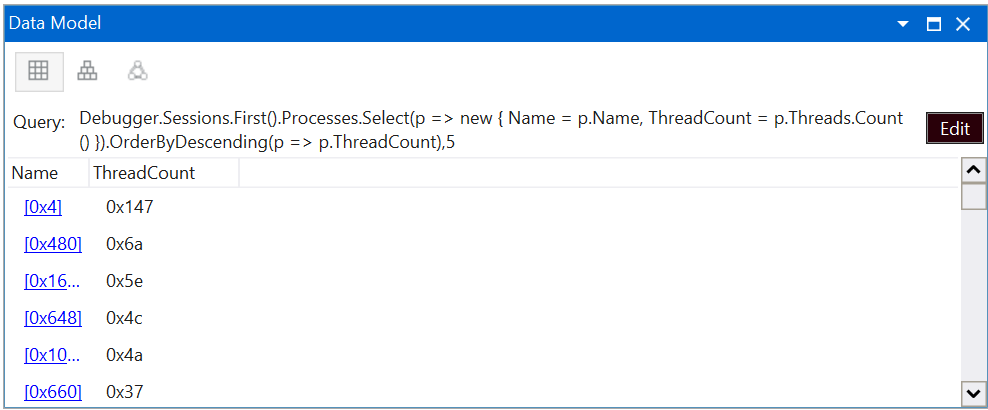
When you click on any underlined item a new tab is opened and a query is run to display that information.
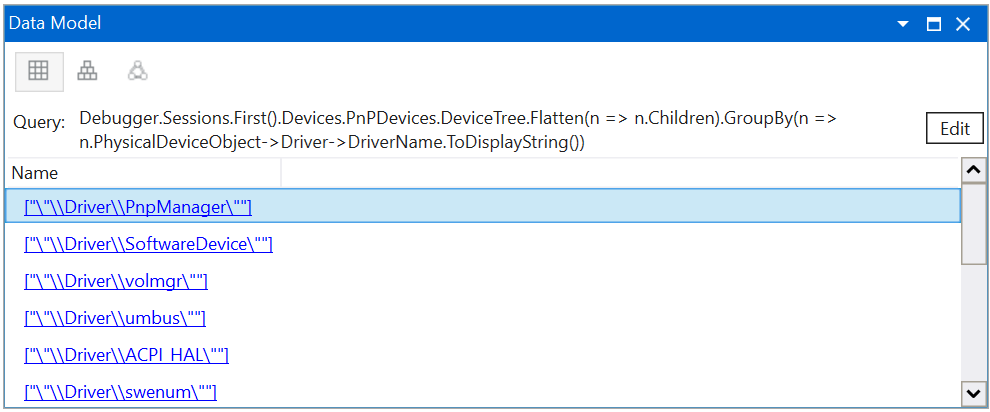
This query shows the devices in the plug and play device tree grouped by the name of the physical device object's driver for a kernel session.
Debugger.Sessions.First().Devices.DeviceTree.Flatten(n => n.Children).GroupBy(n => n.PhysicalDeviceObject->Driver->DriverName.ToDisplayString())
Use change query to change the query that is used in the active data model window.
Training
Module
Build data models in finance and operations apps - Training
Explore how to define, create, and manage tables in finance apps using Visual Studio for efficient data handling and development.
Documentation
WinDbg - Notes, Command, Memory and Source Menus - Windows drivers
This section describes how work with the Notes, Command, Memory and Source menus.
WinDbg Basics - Windows drivers
This section describes the basic capabilities of WinDbg debugger.
WinDbg - Breakpoints Menu - Windows drivers
This section describes how to set and clear breakpoints using the WinDbg debugger.