Analyzing datamarts
You can analyze your datamarts with multiple tools, including the Datamart editor and the SQL Query Editor among others. This article describes how to analyze your datamarts with those tools, and suggestions on how best to see the information you need.
Analyze inside the Datamart editor
The Datamart editor provides an easy visual interface to analyze your datamarts. The following sections provide guidance on how to use the Datamart editor to gain insights into your datamarts, and your data.
Visual query
Once you've loaded data into your datamart, you can use the Datamart editor to create queries to analyze your data. You can use the Visual Query editor for a no-code experience to create your queries.
There are two ways to get to the Visual query editor:
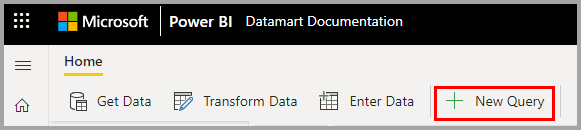
In the Data grid view, create a new query using the + New Query button on the ribbon, as shown in the following image.
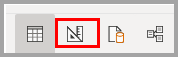
Alternatively you can use the Design view icon found along the bottom of the Datamart editor window, shown in the following image.
To create a query, drag and drop tables from the Object explorer on the left on to the canvas.
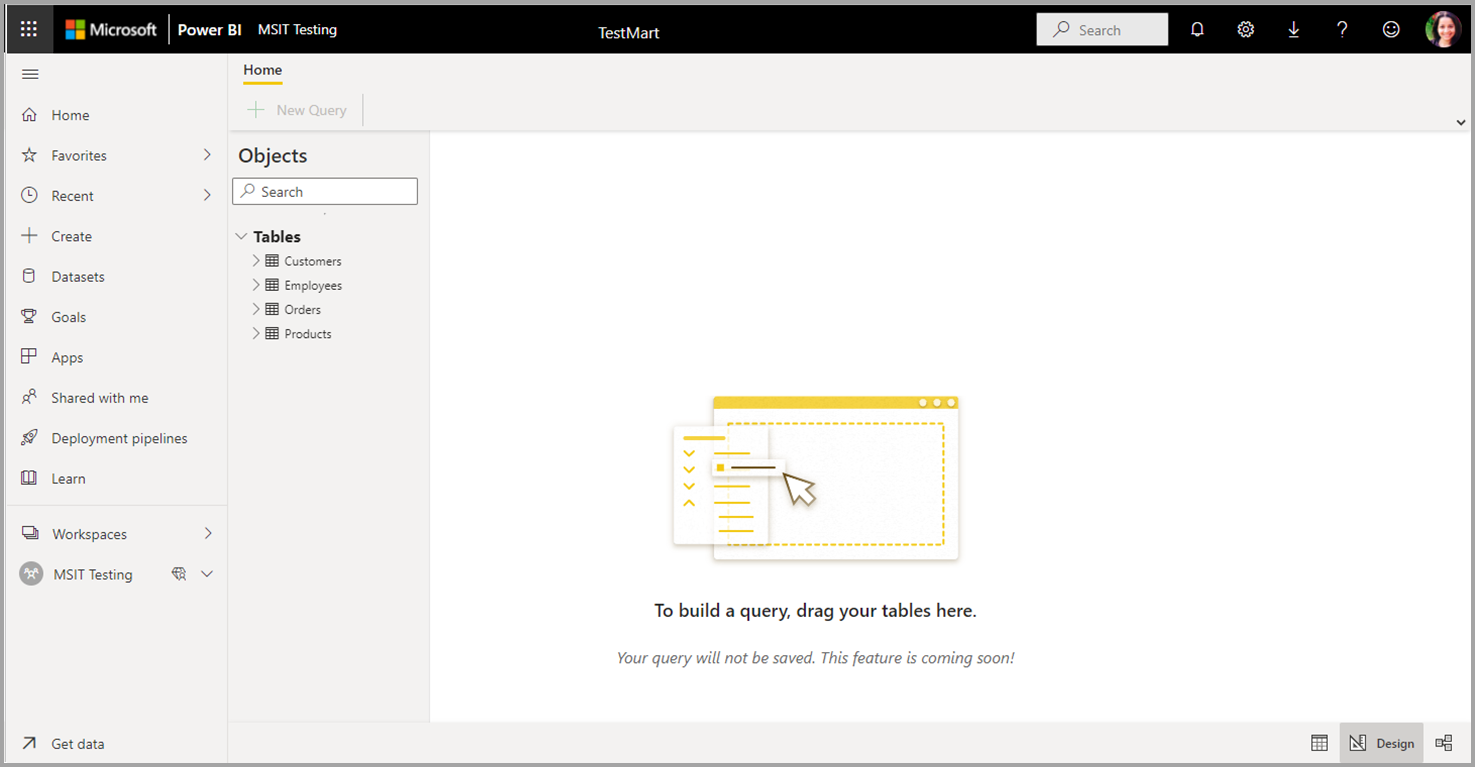
Once you drag one or more tables onto the canvas, you can use the visual experience to design your queries. The datamart editor uses the similar Power Query diagram view experience to enable you to easily query and analyze your data. Learn more about Power Query diagram view.
As you work on your Visual query, the queries are automatically saved every few seconds. A “saving indicator” that shows up in your query tab at the bottom indicates that your query is being saved.
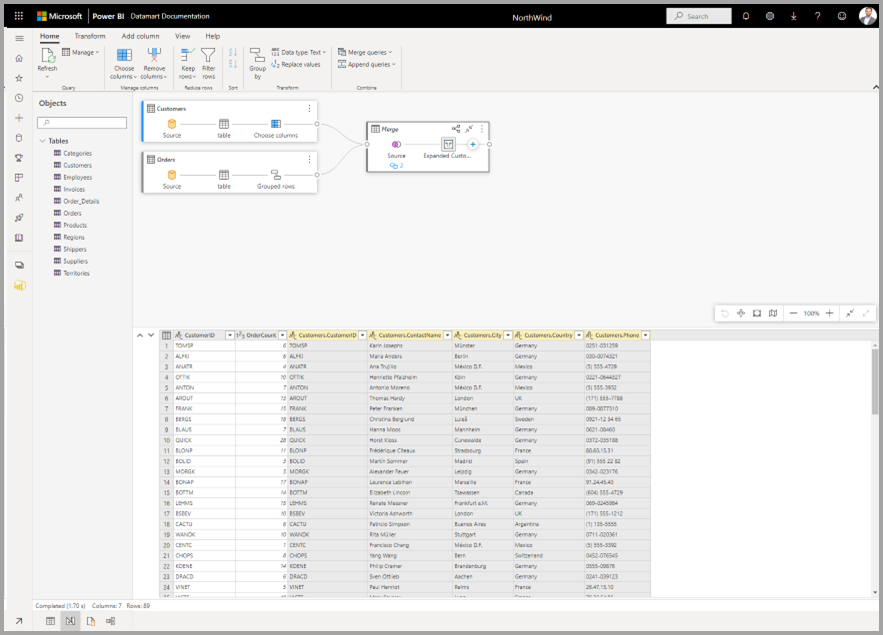
The following image shows a sample query created using the no-code Visual Query editor to retrieve the Top customers by Orders.
There are a few things to keep in mind about the Visual Query editor:
- You can only write DQL (not DDL or DML)
- Only a subset of Power Query operations that support Query folding are currently supported
- You can't currently open the visual query in Excel
SQL Query Editor
The SQL Query Editor provides a text editor to write queries using T-SQL. To access the built-in SQL query editor, select the SQL query editor view icon located at the bottom of the datamart editor window.
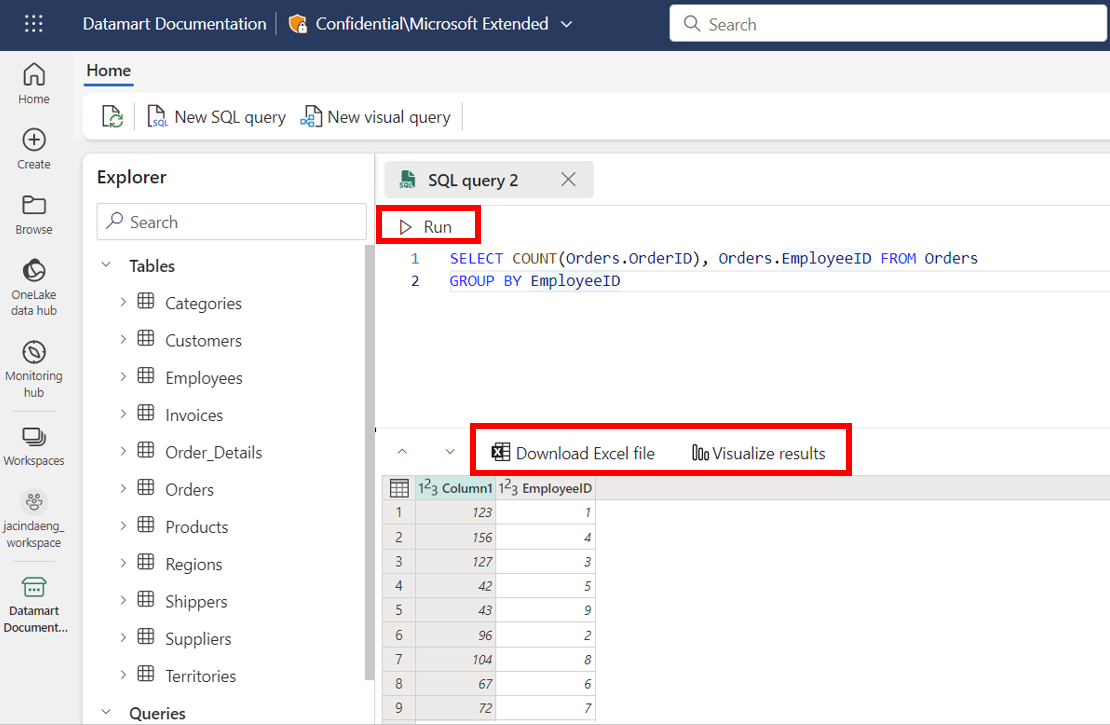
The SQL Query editor provides support for intellisense, code completion, syntax highlighting, client-side parsing and validation. Once you’ve written the T-SQL query, select Run to execute the query. As you work on your SQL query, the queries are automatically saved every few seconds. A “saving indicator” that shows up in your query tab at the bottom indicates that your query is being saved. The Results preview is displayed in the Results section. The Download in Excel button opens the corresponding T-SQL Query to Excel and executes the query, enabling you to view the results in Excel. The Visualize results allows you to create reports from your query results within the SQL query editor.
There are a few things to keep in mind about the Visual Query editor:
- You can only write DQL (not DDL or DML)
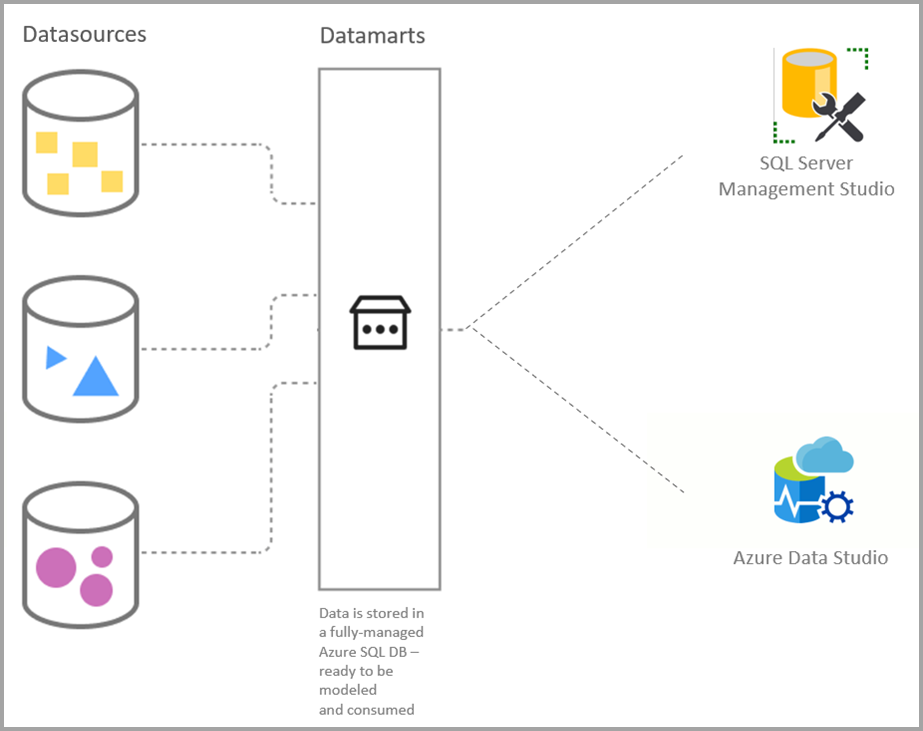
Analyze outside the editor
Datamarts provide a SQL DQL (query) experience through your own development environment – such as SSMS or Azure Data Studio. You must run the latest version of the tools and authenticate using Microsoft Entra ID or MFA. The login process is the same as the sign-in process for Power BI.
When to Use In-Built Querying vs External SQL Tooling
The no-code visual query editor and datamart editor are available within Power BI for your datamart. The no-code visual query editor enables users who aren't familiar with the SQL language, while the datamart editor is helpful for quick monitoring of the SQL DB.
For a querying experience that provides a more comprehensive utility, combining a broad group of graphical tools with many rich script editors, SQL Server Management Studio (SSMS) and Azure Data Studio (ADS) are more robust development environments.
When to Use SQL Server Management Studio vs Azure Data Studio
While both analysis experiences offer extensive development environments for SQL querying, each environment is tailored toward separate use cases.
You can use SSMS for:
- Complex administrative or platform configuration
- Security management, including user management and configuration of security features
- Live query statistics or client statistics
Use ADS for:
- macOS and Linux users
- Mostly editing or executing queries
- Quick charting and visualizing set results
Get the T-SQL connection string
For developers and analysts with SQL experience, using SQL Server Management Studio or Azure Data Studio as an extension to Power BI datamarts can provide a more thorough querying environment.
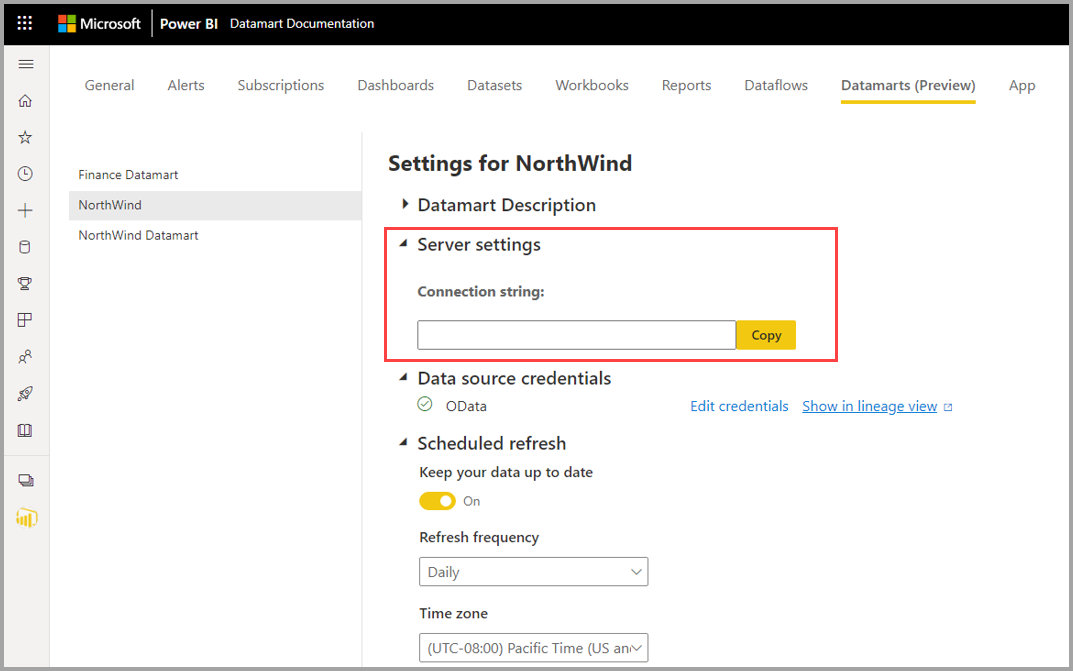
To connect to a datamart’s SQL endpoint with client tooling, navigate to the semantic model settings page by selecting the Datamarts (Preview) tab in Power BI. From there, expand the Server settings section and copy the connection string, as shown in the following image.
Get started with SSMS
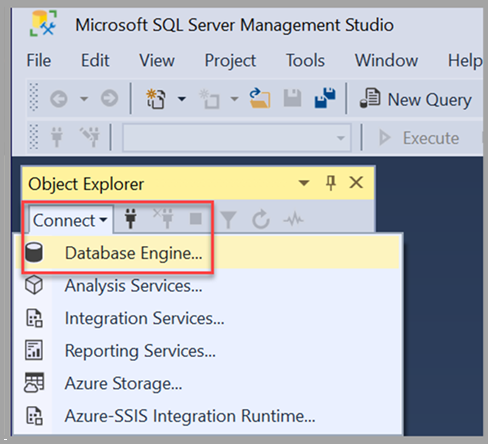
To use SQL Server Management Studio (SSMS), you must be using SSMS Version 18.0 or above. When you open SQL Server Management Studio, the Connect to Server window appears. You can open it manually by selecting Object Explorer > Connect > Database Engine.
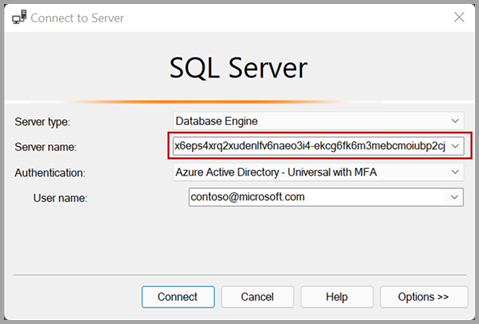
Once the Connect to Server window is open, paste the connection string copied from the previous section of this article into the Server name box. Select Connect and proceed with the appropriate credentials for authentication. Remember that only Microsoft Entra ID - MFA authentication is supported.
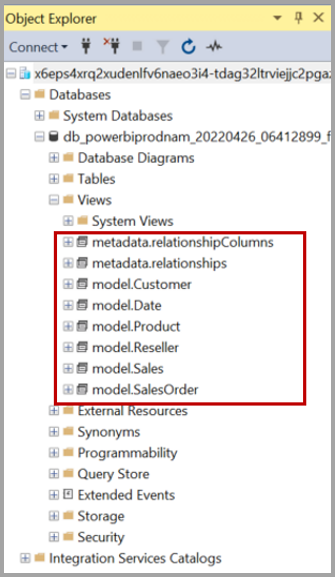
When the connection has become established, the object explorer displays the connected SQL DB from your datamarts and its respective tables and views, all of which are ready to be queried.
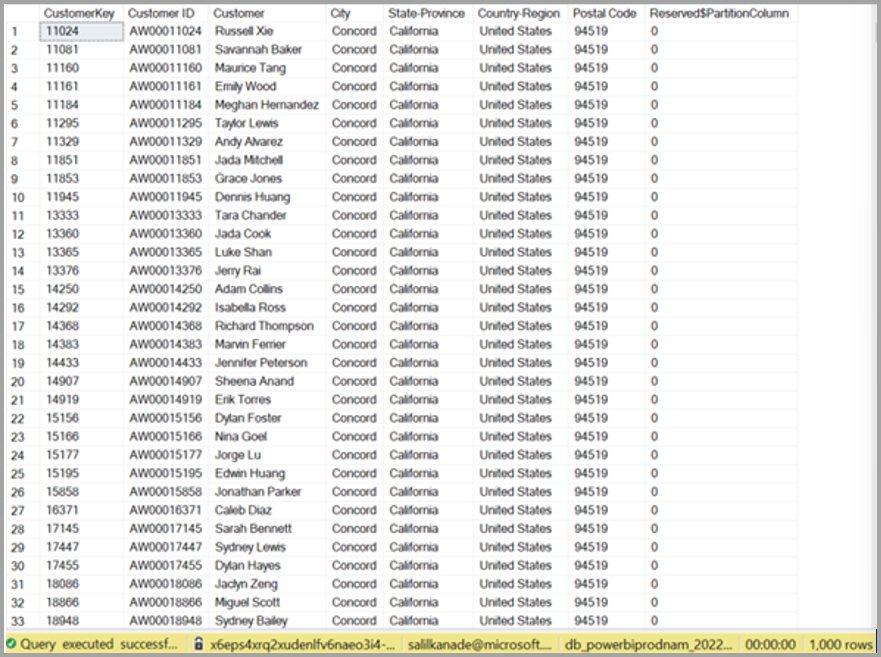
To easily preview the data within a table, right-click on a table and select Select Top 1000 Rows from the context menu that appears. An autogenerated query returns a collection of results displaying the top 1,000 rows based on the primary key of the table.
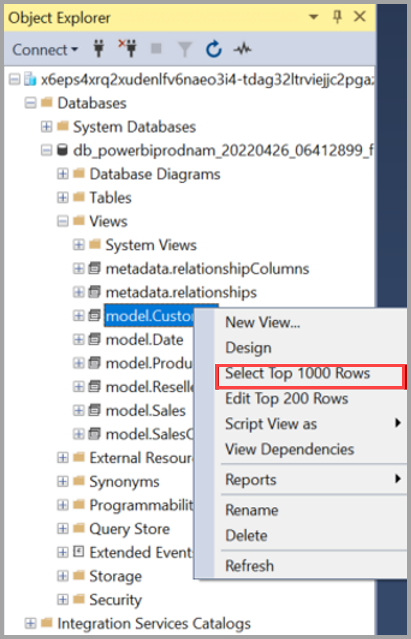
The following image shows the results of such a query.
To see the columns within a table, expand the table within Object explorer.
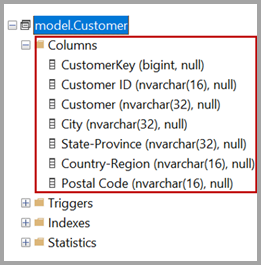
When you connect to datamart using SSMS or other client tools, you can see views created in Model schema of the datamart. The default schema configuration on a datamart is set to Model.
A datamart shows two other roles as admin and viewer under security when connected using SSMS. Users added to a workspace in any of the Admin or Member or Contributor roles get added to the admin role on the datamart. Users added to the Viewer role in the workspace get added to viewer role in the datamart.
Relationships metadata
The extended property isSaaSMetadata added in the datamart lets you know that this metadata is getting used for SaaS experience. You can query this extended property as below:
SELECT [name], [value]
FROM sys.extended_properties
WHERE [name] = N'isSaaSMetadata'
The clients (such as the SQL connector) could read the relationships by querying the table-valued function like the following:
SELECT *
FROM [metadata].[fn_relationships]();
Notice there are relationships and relationshipColumns named views under metadata schema to maintain relationships in the datamart. The following tables provide a description of each of them, in turn:
[metadata].[relationships]
| Column name | Data type | Description |
|---|---|---|
| RelationshipId | Bigint | Unique identifier for a relationship |
| Name | Nvarchar(128) | Relationship's name |
| FromSchemaName | Nvarchar(128) | Schema name of source table "From" which relationship is defined. |
| FromObjectName | Nvarchar(128) | Table/View name "From" which relationship is defined |
| ToSchemaName | Nvarchar(128) | Schema name of sink table "To"which relationship is defined |
| ToObjectName | Nvarchar(128) | Table/View name "To"which relationship is defined |
| TypeOfRelationship | Tinyint | Relationship cardinality, the possible values are: 0 – None 1 – OneToOne 2 – OneToMany 3 – ManyToOne 4 – ManyToMany |
| SecurityFilteringBehavior | Tinyint | Indicates how relationships influence filtering of data when evaluating row-level security expressions. The possible values are 1 – OneDirection 2 – BothDirections 3 – None |
| IsActive | Bit | A boolean value that indicates whether the relationship is marked as Active or Inactive. |
| RelyOnReferentialIntegrity | Bit | A boolean value that indicates whether the relationship can rely on referential integrity or not. |
| CrossFilteringBehavior | Tinyint | Indicates how relationships influence filtering of data. The possible values are: 1 – OneDirection 2 – BothDirections 3 – Automatic |
| CreatedAt | Datetime | Date the relationship was created. |
| UpdatedAt | datetime | Date the relationship was modified. |
| DatamartObjectId | Navrchar(32) | Unique identifier for datamart |
[metadata].[relationshipColumns]
| Column name | Data type | Description |
|---|---|---|
| RelationshipColumnId | bigint | Unique identifier for a relationship's column. |
| RelationshipId | bigint | Foreign key, reference the RelationshipId key in the Relationships Table. |
| FromColumnName | Navrchar(128) | Name of the "From" column |
| ToColumnName | Nvarchar(128) | Name of the "To" column |
| CreatedAt | datetime | ate the relationship was created. |
| DatamartObjectId | Navrchar(32) | Unique identifier for datamart |
You can join these two views to get relationships added in the datamart. The following query will join these views:
SELECT
 R.RelationshipId
,R.[Name]
,R.[FromSchemaName]
,R.[FromObjectName]
,C.[FromColumnName]
,R.[ToSchemaName]
,R.[ToObjectName]
,C.[ToColumnName]
FROM [METADATA].[relationships] AS R
JOIN [metadata].[relationshipColumns] AS C
ON R.RelationshipId=C.RelationshipId
Limitations
- Visualize results currently does not support SQL queries with an ORDER BY clause.
Related content
This article provided information about analyzing data in datamarts.
The following articles provide more information about datamarts and Power BI:
- Introduction to datamarts
- Understand datamarts
- Get started with datamarts
- Create reports with datamarts
- Access control in datamarts
- Datamart administration
For more information about dataflows and transforming data, see the following articles:
Feedback
Coming soon: Throughout 2024 we will be phasing out GitHub Issues as the feedback mechanism for content and replacing it with a new feedback system. For more information see: https://aka.ms/ContentUserFeedback.
Submit and view feedback for