AL Profiler overview
> INTRODUCED IN: Business Central 2021 release wave 2 and updated with sampling profiling for Business Central 2022 release wave 1.
Profiling allows you to collect data about performance and analyze this data with the goal of optimizing a certain area in the code or a certain process. The AL Profiler for the AL Language extension for Microsoft Dynamics 365 Business Central offers options for instrumentation profiling and sampling profiling. The AL Profiler is based on a snapshot of running code. The snapshot is a recording of running code that allows for later offline inspection. The AL Profiler is a powerful tool for analyzing performance in code written for Business Central.
Snapshot of the running code
With the AL Profiler for the AL Language extension for Microsoft Dynamics 365 Business Central, you can capture a performance profile of the code that was executed for a snapshot. There are two types of profiling; instrumentation profiling and sampling profiling. Both types of profiling are based on a snapshot of running code. The instrumentation profiling is more accurate and provides more insight. Using the performance profiling editor view in Visual Studio Code, you can investigate the time spent on execution, using top-down and bottom-up call stack views. The sampling profiling is less accurate, but can provide faster insights into performance trends on code.
Snapshot configuration settings
In order to do any profiling on code, first, you must capture a snapshot of running code. Before doing that, you must set up a snapshot configuration in the launch.json file. The configuration settings depend on what type of profiling you want to perform. For more information, see Snapshot debugging and Launch JSON file.
To set up a snapshot configuration for instrumentation profiling
The parameter called executionContext has the following values in the table below. If nothing is specified, the configuration is DebugAndProfile by default.
| Option | Description |
|---|---|
Debug |
The snapshot session won't gather profile information. |
Profile |
The snapshot session will only gather profile information, snappoints will be ignored, and debugging won't work. |
DebugAndProfile |
Both debugging and profiling will be available as a result of a snapshot session. This is the default setting. |
The profilingType must be set to Instrumentation as illustrated in the example below.
Looking at the example, if we want to use the snapshot both for debugging and profiling purposes, the configuration for the snapshot in the launch.json file must look equivalent to the following example file:
"configurations": [
        {
            "name": "snapshotInitialize: Your own server",
            "type": "al",
            "userId": "555",
            "request": "snapshotInitialize",
            "environmentType": "OnPrem",
            "server": "http://localserver",
            "serverInstance": "BC200",
            "authentication": "Windows",
            "breakOnNext": "WebClient",
            "executionContext": "DebugAndProfile",
            "profilingType": "Instrumentation"
        }
To set up a snapshot configuration for sampling profiling
For sampling profiling, choose Sampling as the profilingType in the launch.json configuration file. The executionContext property must be set to Profile. Debugging isn't supported while running sampling profiling. Finally, the profilingType must be set to Sampling as shown in the example below.
"configurations": [
        {
            "name": "Your own server",
            "type": "al",
            "userId": "555",
            "request": "snapshotInitialize",
            "environmentType": "OnPrem",
            "server": "http://localserver",
            "serverInstance": "BC200",
            "authentication": "Windows",
            "breakOnNext": "WebClient",
            "executionContext": "Profile",
            "profilingType": "Sampling",
            "profileSamplingInterval": 100
        }
Getting a snapshot file
When a configuration is defined and you've ensured that the executionContext parameter is either DebugAndProfile or Profile a snapshot debugging session can be initialized by pressing Ctrl+Shift+P, and then selecting AL:Initialize Snapshot Debugging or by pressing F7.
Once a snapshot debugging session is initialized, the snapshot debugging session counter on the status bar will be updated and look like this:
Press Alt+F7 to finish a snapshot debugging session. Stopping the session brings up all snapshot sessions that have been started. Choosing one will close the session debugging on the server and download the snapshot file. For more information, see Snapshot debugging.
Generating a profile file for instrumentation profiling
Once the snapshot file is downloaded, you can generate a profile file. This can be done in one of the two ways:
- Open the Command Palette by using the Ctrl+Shift+P shortcut, then select the AL: Generate profile file command and choose a snapshot from the dropdown menu.
- Alternatively, in the Visual Studio Code explorer, right-click the specific snapshot file and choose Generate Profile File.
The profile file for AL code has the extension .alcpuprofile and when you open the file, it displays in the performance profiling editor view in the Visual Studio Code.
Graph of method calls
To investigate the graph of method calls, open the generated profile file in the performance profiling editor. If you select the file directly, it opens up in top-down view. For more information, see the View modes section. You can also right-click a profile file and get the following options: AL Profile Visualizer TopDown Graph and AL Profile Visualizer BottomUp Graph. When the profile file opens, it looks similar to the illustration below:
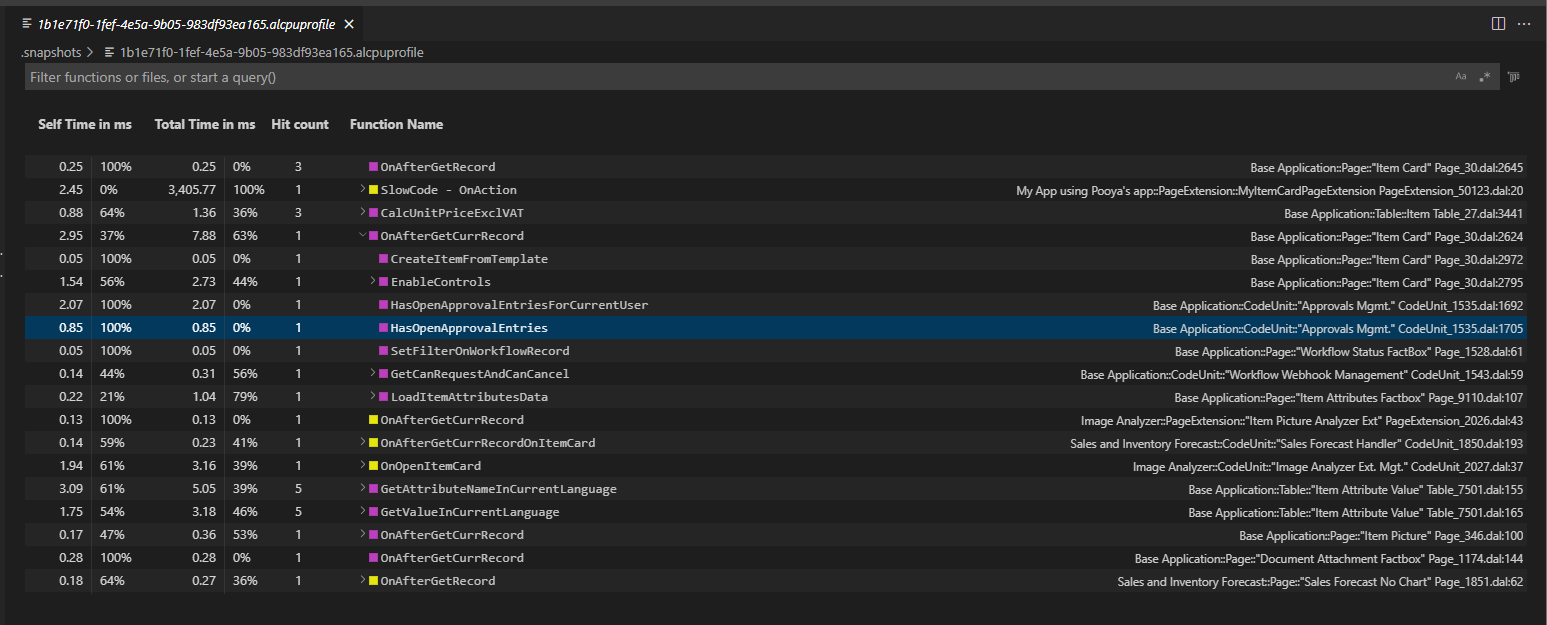
To investigate the data shown in the graph, you can use different view modes as described in the next section. Choose a specific method to navigate to the code. The (default) color legend of the graph is as follows:
| Layer | Color |
|---|---|
| System Application | Green |
| Base Application | Magenta |
| Other Extensions | Yellow |
| System | Blue |
| Custom | Named extension, defaults to "extension" if not found |
The color legend can be changed by specifying the al.profilerColors property in the AL configuration. For more information, see AL Language Extension Configuration.
Important
If you run Visual Studio Code with the setting Run as administrator, the graph will not display in the performance profiling editor view. As a workaround, you can launch Visual Studio Code from the command line with the flag --no-sandbox.
View modes
To switch between views, you can either right-click the profile file and choose a view, or you can use the small button in the upper right corner. There are two different view modes in the graph; top-down and bottom-up.
When sorting the stack in top-down direction, the graph sorts the methods according to the call sequence, which means that the child nodes are the methods called from the parent node. And when sorting bottom-up, the graph is sorted as a reverse call stack, which means that the child nodes are methods who called the parent node.
Details
To investigate further, the Self-time and Total time columns are important indicators of where time is spent in the code. The Self-time is the amount of time spent in the method only, excluding any calls out of the method. The Total time is the amount of Self-time plus any calls out of the method. On bottom-up graphs the Total time and Self-time columns are sortable. Clicking them will first sort them in ascending order, clicking again will sort them in descending.
Hit count is only available on top-down graphs and shows the number of times a specific method was called. Time spent is aggregated.
Filter
The nodes in the graph can be filtered. The syntax is as follows:
@column name | <alias> <op> <value> where
<column name> := [function, url, path, selfTime, totalTime, id, objectType, objectName, declaringApplication]
Column name aliases
The aliases that are available for the column names are:
<alias> := [f, u, p, s, t, id, ot, on, da]
<op> := [numeric operators, boolean operators, string operators]
numeric operators : [:, =, >, <, <=, >=, <>, !=]
: := equal
boolean operators : [:, =, <>, !=]
string operators : [:, =, !=, <>, ~, =]
~ = := <regex>
Filter examples
| Expression | Result |
|---|---|
| @t > 1000 | Shows all nodes in the graph where the total time is greater than 1 second. |
| @h > 20 | Shows all nodes in the graph where the hit count was larger than 20. |
| @da ~= Ba* | Shows all nodes in the graph that start with Ba. |
Keyboard shortcuts for navigating the graph
The following table provides an overview of the shortcut key combinations that you can use when you're working in the graph of method calls.
| Keyboard Shortcut | Action |
|---|---|
| Enter+Toggle | Expand and collapse a node. |
| Left arrow | Collapse a node. |
| Right arrow | Expand a node. |
| Tab+Enter | Go to the source code of a node. |
| F12 | Jump to selected node. |
| Home | Jump to the first node of the list. |
| End | Jump to the last node of the list. |
| Down arrow | Jump to the next node. |
| Up arrow | Jump to the previous node. |
| - (minus) | Collapse all nodes. |
| * (star) | Expand one level for all nodes. Consecutive keystrokes will expand to the next level. |
Inline Profiler CodeLens for AL profiling results
The Profiler CodeLens for AL shows profile results. At hover, the Profiler CodeLens displays time spent in milliseconds for a specific method, and the number of hits on the method. When opening a profiler file, the lens will show information on all statements that appear as frames in the profiler.
General CodeLens support for the Visual Studio Code is enabled in the user or workspace settings by adding the "editor.codeLens": true setting for the specific user or for the workspace. To activate this setting, select Ctrl+Shift+P, and then choose Preferences: Open Settings (UI) for workspace settings, or choose Preferences: Open User Settings for user settings.
While in the settings file, you can now add two options for the Profiler CodeLens for AL. The "al.areProfileLensesSupported": true enables the CodeLens and is by default true. The option for adding a lower limit for time spent on statement execution is al.statementLensMin. This must be set to the value in milliseconds, which is the lower limit. The default for this setting is 500 milliseconds (ms). Any value below the stated threshold won't be shown. For more information, see AL Language Extension Configuration.
Note
Because of the aggregation of frames, there can be minor discrepancies between the information appearing in the CodeLens and in the profiler.
Sampling profiling
Sampling profiling is useful as an initial analysis of code performance. You can perform sampling profiling in Visual Studio Code on AL code. Sampling profiling is based on a snapshot of running code. It gets the AL stack frame of the currently executing AL method in the context of an attached session in a given time interval.
Sampling isn't as accurate as instrumentation profiling is. But it can give an indication about the self-time of an AL method. The benefit of doing sampling profiling is that it's less noisy and is much faster to get profile information.
There are a few server restrictions for sampling profiling to be aware of:
- The maximum duration of a sampling session is 10 minutes.
- The number of stack frame entries is limited to 2000.
In-client performance profiling
In Business Central, you can use the Performance Profiler page to record a snapshot to do sampling profiling. This allows for recording of a process that seems slow directly in Business Central. When the Performance Profiler has run and recorded a process in Business Central, it generates a .alcpuprofile file, which can be downloaded and shared using OneDrive. When receiving such a .alcpuprofile file, it can be opened in another Business Central Performance Profiler, or in Visual Studio Code and further investigated. For more information, see In-client Performance Profiler overview.
See also
Snapshot debugging
AL Language extension configuration
In-client performance profiler overview
JSON files
Comentarios
Próximamente: A lo largo de 2024 iremos eliminando gradualmente GitHub Issues como mecanismo de comentarios sobre el contenido y lo sustituiremos por un nuevo sistema de comentarios. Para más información, vea: https://aka.ms/ContentUserFeedback.
Enviar y ver comentarios de